The options market continues to reflect elevated optimism.
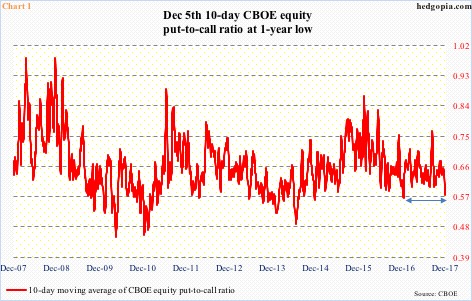
In nine of the last 12 sessions, the CBOE equity put-to-call ratio registered readings in the 0.50s. The other three were in the low 0.60s.
In fact, major U.S. stock indices yesterday reversed hard, giving back early gains, with the S&P 500 large cap index closing down 0.4 percent and the Dow Industrials ending down 0.5 percent, but the ratio still came in at 0.57.
Consequently, the 10-day moving average of the put-to-call ratio yesterday was 0.57, which was the lowest since 0.568 on December 19 last year (Chart 1). Back then, between the 13th and the 30th that month the S&P 500 dropped 1.9 percent. In four sessions ended the 30th, the Nasdaq composite fell 2.6 percent.
In the very near term, the bulls likely have their work cut out.
Medium- to long-term, there likely is another variable at play.
U.S. manufacturing activity in recent months has sprung to life.
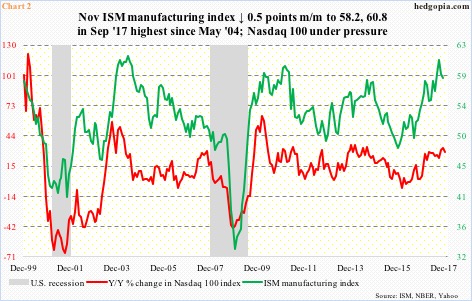
The ISM manufacturing index in November dropped five-tenths of a point month-over-month to 58.2, but September’s 60.8 was the highest since 61.4 in May 2004. In August 2016, the index languished sub-50 at 49.4. This has been quite a comeback. Stocks have followed.
Chart 2 pits the manufacturing index with year-over-year change in the Nasdaq 100 index. The two follow each other closely. Recently, both the red and green lines have hooked down. Given how elevated the green line is, it likely continues lower in months ahead – if nothing else, just to give some of the recent strength back. In this scenario, the red line continues lower.
Right here and now, stocks have come under pressure in recent sessions, but it is hard to imagine them fall apart in a seasonally favorable period. In all likelihood, dip-buyers at some point will step up to defend support. Support at 2600 on the S&P 500 (2629.57) for instance also approximates the 20-day.
But before that, at least some of the optimism built into options probably is on its way out.
Thanks for reading!

