
Once Again, a rally in VIX was used as an opportunity to sell – sell hard.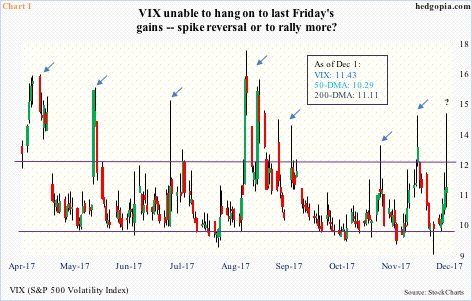
Last Friday, in the wake of the Michael Flynn news, VIX shot up to 14.58 intraday but only to end the session up 0.15 to 11.43. The resulting candle has the look of a spike reversal.
In the past, such candles have subsequently resulted in downside pressure on VIX (Chart 1).
Just 11 sessions ago, VIX reversed from a similar level, proceeding to drop to a new intraday low of 8.56 by November 24.
If it is a spike reversal, volatility bulls have their work cut out near term.
Normally, VIX has an inverse relationship with the S&P 500 large cap index, although last week both rallied – VIX up 18.5 percent and the S&P 500 1.5 percent.
If their normal relationship holds, and VIX drops, this is more tailwind for the S&P 500 – potentially.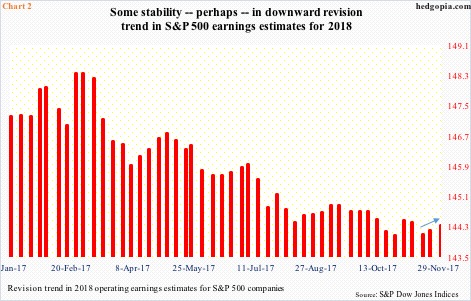
At the time of this writing – at midnight – S&P 500 futures were up 17 points. The passage of the tax bill in the Senate is probably the reason for the new enthusiasm. It is worth pointing out that by Friday close it was clear that the Republicans had secured the votes – the reason why the Flynn dip was bought hand over fist.
In fact, the sell-side arguably already began to pencil in tax cuts.
As of last Thursday, 2018 operating earnings estimates for S&P 500 companies were revised up $0.12 from a week ago to $144.33. Mid-November, these estimates were $144.10. Chart 2 (arrow) highlights this slight uptrend in the past couple of weeks.
Big picture, though, going back to January this year, the revision trend is still down. Further, these estimates compare with the current consensus of $125.10 for this year.
Be that as it may, there is a lot of optimism built into next year’s estimates.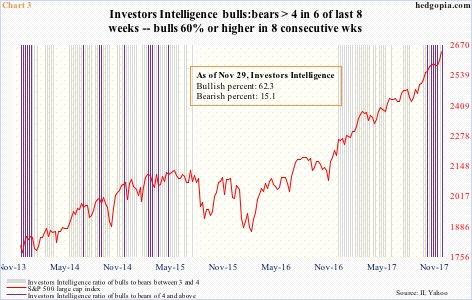
Ditto with investor sentiment.
Investors Intelligence bulls were 62.3 percent last week. In the last eight weeks, they have been 60 percent or higher, while the bears have languished in the 14-15 percent. Consequently, the ratio of bulls to bears has been north of four or higher in six of of the last eight weeks, with the other two at 3.95 and 3.99 (Chart 3).
In the past, such persistent optimism sooner or later has caused stocks to pull back – duration and magnitude notwithstanding.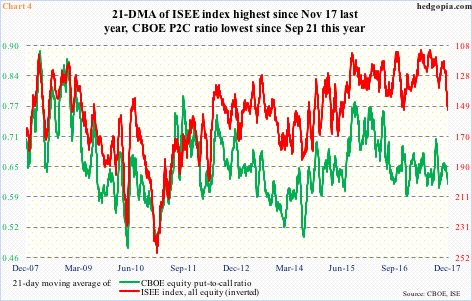
This is beginning to get reflected in the options market.
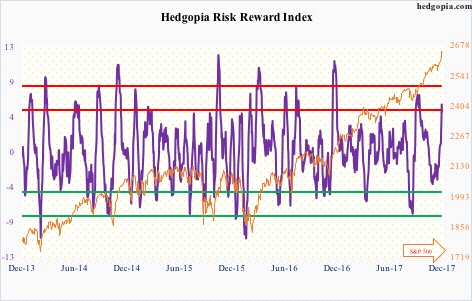
(Hedgopia Risk Reward Index just entered the red zone, and inched lower last Friday.)
Chart 4 plots the CBOE equity put-to-call ratio with the ISEE index, all equity. The latter is a call-to-put ratio, hence inverted.
The ISEE index excludes trades from market makers and broker/dealers, and only uses opening long trades. From the sentiment perspective, the ISEE index can be considered a cleaner number.
The chart uses a 21-day moving average. The ISEE index in particular is at a one-year high.
Using a 10-day moving average (not shown here), the CBOE P2C ratio Friday registered 0.57, which was the lowest since December 19 last year, while the ISEE index last Wednesday stood at 165.9 – the highest since April 28, 2015.
These are elevated readings, and in due course will be unwound. The only question is if the unwinding begins right here or after getting even more extended. If seasonality in stocks prevails, the latter is possible. This likely gets decided today. It is entirely possible the ‘buy the rumor, sell the news’ phenomenon kicks in as the session progresses, as traders realize risk-reward dynamics do not favor getting aggressive at this point – not at least stocks pull back some, before drawing seasonality-focused dip buyers.
Thanks for reading!
