
Unless momentum changes swiftly, the tech-dominated Nasdaq 100 index once again is beginning to lag, creating opportunities for nimble traders.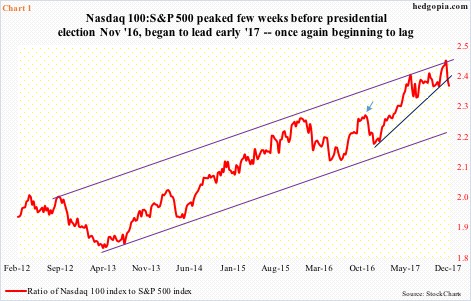
The Nasdaq 100 has come a long way. It is up nearly 29 percent this year – much more than its major U.S. peers.
The index began to lead the S&P 500 index as soon as 2017 was rung in.
The ratio between the two finds itself within a five-year trend channel, the upper end of which was recently kissed. Resistance is holding.
Importantly, the ratio yesterday lost a rising trend line from November last year (post-presidential election).
Last year, tech stocks, which began to lag just a few weeks before the election (arrow in Chart 1), continued to do so after President Trump won the White House. Among other things, he promised to cut taxes and regulations as well as increase infrastructure spending.
Investors only gravitated toward tech early this year. This continued until last Monday, when the ratio once again peaked. The U.S. senate last Friday passed a bill that would drastically reshape the tax code.
Relatively, tech companies do not pay a whole lot in taxes. S&P puts it at an effective rate of 18.5 percent – among the lowest. Rightly or wrongly, markets perceive this as a negative for the sector.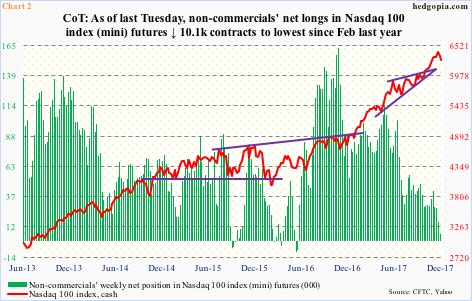
Interestingly, non-commercials have been actively reducing net longs in Nasdaq 100 index (mini) futures. In fact, their holdings peaked at 162,662 contracts as far back as the week ended October 25 last year – just before the election. They are still cutting back. As of last Tuesday, they owned 5,611 net longs, down from 42,009 just four weeks ago.
It must be pointed that these traders have been on the wrong side of this trade. Post-election, the cash has rallied massively (Chart 2).
That said, non-commercials in general tend to be trend followers, and do a good job of doing so. It is also worth pointing out that, going back several years, they have not stayed net short for too long. Currently, net longs are the lowest since February last year. If they start increasing long exposure, the cash can get a tailwind.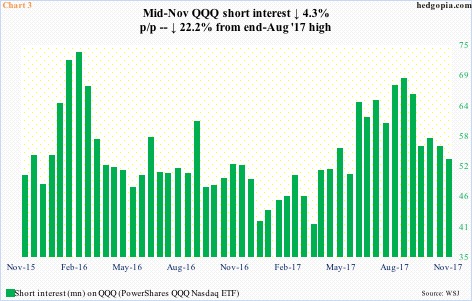
In this scenario, there is fuel for short squeeze elsewhere.
As of mid-November, short interest on QQQ (PowerShares QQQ Nasdaq ETF) stood at 53 million. This is down from 68.2 million at the end of August this year. The ETF bottomed on August 21, suggesting some level of squeeze probably took place.
Short interest has come down, but is still much higher than 40.7 million at the end of March this year. QQQ has 375.5 million shares outstanding.
More important perhaps, short interest on other tech-focused ETF’s remains high. As of mid-November, SMH (VanEck Vectors semiconductor ETF) had 22.8 million – the highest since mid-September last year and up from 11.9 million in mid-February this year. Similarly, XLK (SPDR technology sector ETF) shorts are staying put with their elevated short interest, which they built post-election last year.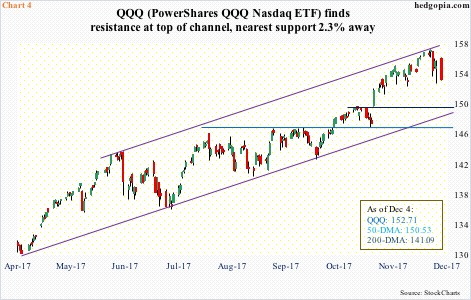
Hoping for a squeeze at this point in time is nothing but a ‘woulda, coulda, shoulda’. Right here and now, tech is lagging.
QQQ (152.71) in fact just faced resistance at the upper end of a months-long channel (Chart 4).
The all-time high of 156.69 last Tuesday also tagged the daily upper Bollinger band, followed by a 1.7-percent decline in the next session. Yesterday, it gapped up, but faced persistent selling to end the session down 1.2 percent.
At least near term, there is room for it to continue lower, particularly if the weekly chart exerts control.
There is gap support at just north of 149, which is 2.3 percent away, give and take. The 50-day moving average lies at 150.53.
With all that said, we are also in a seasonally favorable period for stocks. Sentiment can change on a dime.
Viewed this way, it is probably preferable to deploy options to take advantage of potential downside pressure near term. Below is a hypothetical example of a bear call spread.
QQQ December 2017 (expires 22nd)
- Sell out-of-the-money 153.50 call for $1.67
- Buy out-of-the-money 155.50 call for $0.82
This results in net credit of $0.85. Breakeven is at $154.35, and $1.15 is at risk.
The short call is used to generate income, while the long call helps limit the upside risk. Risk is defined.
Thanks for reading!
