
Here is a brief review of period-over-period change in short interest in the November 1-15 period in nine S&P 500 sectors.
XLB (SPDR materials ETF)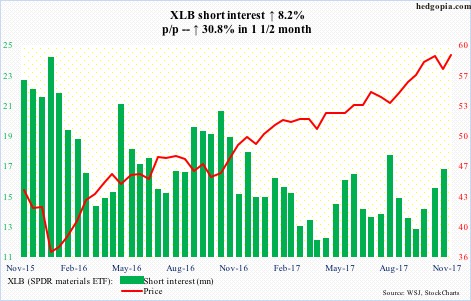
XLB (59.14) peaked at 59.62 on October 26. The bears were able to push the ETF under short-term support at 57.70, but only for a session.
A breakout potentially squeezes the shorts. Short interest has gone up in past month and a half.
The bulls will have the ball so long as the aforementioned support is intact.
XLE (SPDR energy ETF)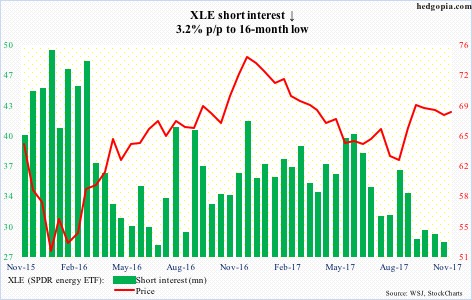
XLE (67.71), caught between the 50- and 200-day moving averages, recently got repelled at Fibonacci resistance.
Between December 12 last year and August 21 this year, the ETF dropped intraday from 76.04 to 61. A 61.8-percent retracement of that decline is 70.29. On November 7, XLE peaked at 70.47.
There is horizontal support at 66.30. The 200-day (66.42) is slightly above.
Shorts are actively cutting back.
XLF (SPDR financial ETF)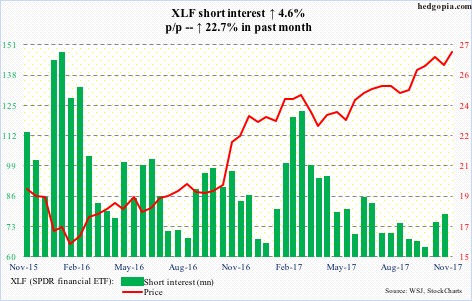
Tuesday’s 2.6-percent rally off of the 50-day brought XLF (26.88 close…26.91 intraday high) within striking distance of its all-time high of 26.92 on October 26.
Shorts have been adding of late – possinly just in time to get squeezed. A breakout is likely, regardless it holds or not.
XLF is comfortably above 25, where resistance goes back more than a decade and which it broke out of in September after several tries. A trend line from February last year draws to that level as well.
XLI (SPDR industrial ETF)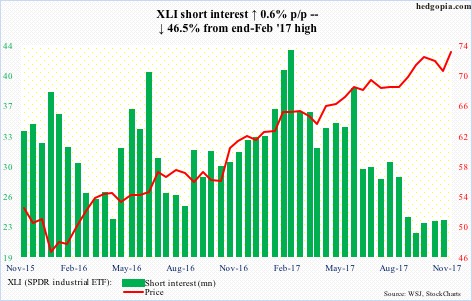
XLI (72.62) peaked at 73.20 on October 24, and is now a stone’s throw away from that high. It has room to continue higher.
There is short-term support at 71.60. The 50-day (71.52) is right there.
XLK (SPDR technology ETF)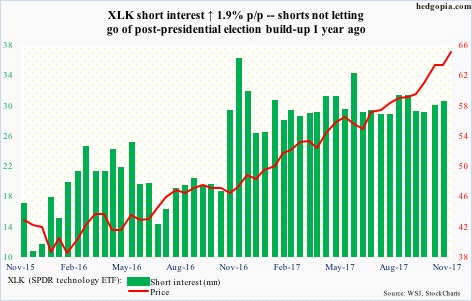
XLK (64.71) remains overbought on nearly all timeframe. This probably encourages the shorts to stay put with losing positions. Short interest has gone sideways at an elevated level post-presidential election of last November.
On the other hand, the bulls notice this elevated short interest, and are trying to force a squeeze, which is yet to occur.
Since October 25, they already defended the 20-day twice – the latest on November 15. Both the 10- and 20-day are rising. The ETF rose to a new all-time high of 64.77 Tuesday.
In the very near term, there is support at 64.
XLP (SPDR consumer stables ETF)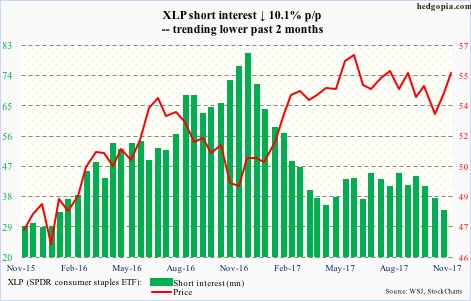
XLP (55.25) broke out of a falling trend line from June this year, but is taking time to build on this. It is also above horizontal support at 53.50-54.00.
Near-term, resistance lies at 55.40.
XLU (SPDR utilities ETF)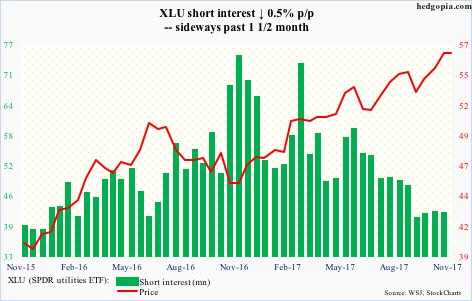
Two weeks ago, XLU (56.38) produced an ominous-looking weekly shooting star. On the 15th this month, it rose to an all-time high of 57.23 but only to reverse hard.
Despite these developments, the ETF is hanging in there, with the bulls having just defended support at 55.50. As long as this level holds, momentum is with them near term.
XLV (SPDR healthcare ETF)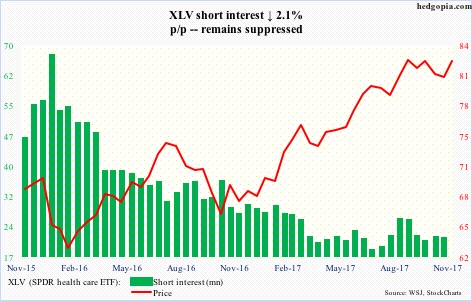
After defending five-month support at just under 81 several times this month, XLV (82.44) bulls kept hammering on the 50-day in the past several sessions, until Tuesday when that resistance gave way.
The daily chart is beginning to look extended, but looking at the daily RSI and MACD, momentum has probably shifted the bulls’ way near term.
XLY (SPDR consumer discretionary ETF)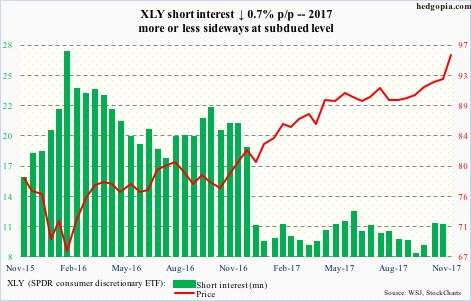
Since June this year, 92 has been a real roadblock on XLY (95.75), until a little over two weeks ago when it broke out and then went parabolic, rallying all along/and beyond the daily upper Bollinger band.
Shorts probably did not contribute much, although short interest has gone up in the past month and a half from a very subdued level.
Thanks for reading!
