Here is a brief review of period-over-period change in short interest in the August 16-31 period in nine S&P 500 sectors.
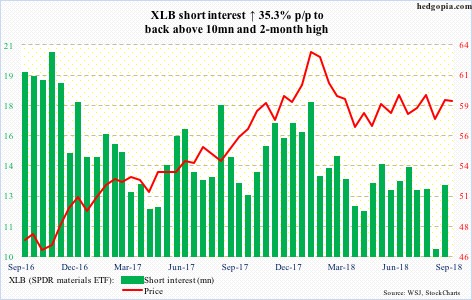
XLB (59.20) continues to go back and forth around its 50- and 200-day moving averages (currently in between). Late August, it rallied to 60.29, but only to get rejected at a falling trend line from late January. The ETF is in the midst of a giant descending triangle, with support at 57, which has been defended several times since February.
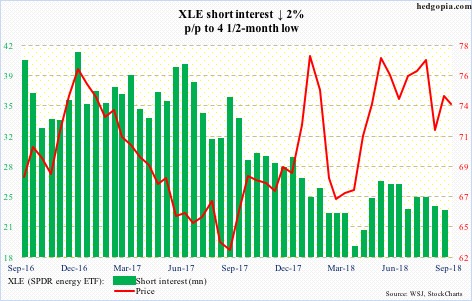
After a mid-August test, the 200-day (72.85) was tested again last week. XLE (73.84) in the meantime is held down by a falling trend line from May 22 when it peaked at 79.42. That resistance gets tested around 75, which is where the 50-day lies. Potential fuel for short squeeze is much less compared to a year ago.
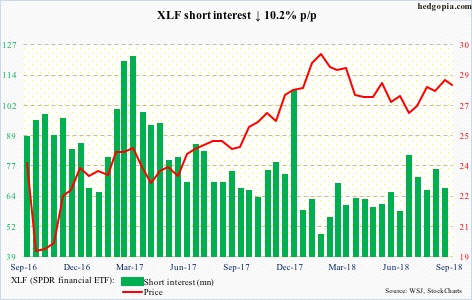
XLF (28.07) broke out of a falling trend line from late January mid-July, but building on it has proven tough. Sellers continue to show up at 28.50. Short interest has slightly built up over the past seven months. Wednesday, the ETF closed right on the 200-day. Bulls will start sweating once they lose 26.70.
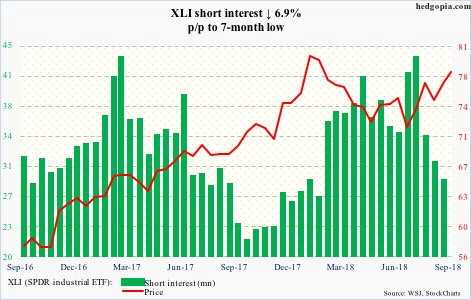
Since peaking mid-July, XLI (78.21) short interest is down 33.6 percent. The ETF rallied strongly during that period. Wednesday, it rose to a six-month high. Conditions are overbought, but momentum is yet to break. There is decent support at 77.
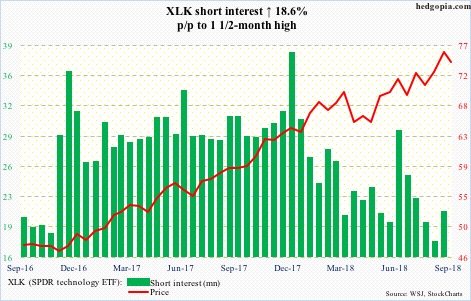
On August 30, XLK (74.13) rose to a new all-time high of 76.03 in a long-legged doji session. Having gotten aggressive post-presidential election (November 2016), shorts lent a helping hand. By the August 1-15 period, all that buildup was gone. In the latest period, shorts added a bit. Since that high, the ETF has come under pressure, but nothing major. Bulls thus far have defended a rising trend line from April, with sideways action the past five sessions right above the 50-day. Medium term, breach risks are rising.
XLP (SPDR consumer staples ETF)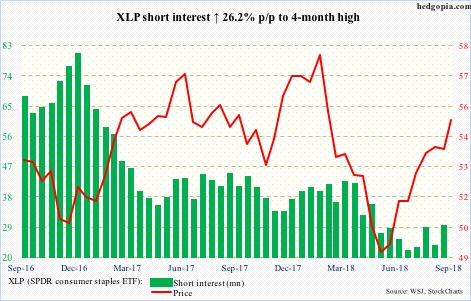
XLP (54.99) faces decent resistance at 55-55.50 going back two-plus years. It has had a strong rally since early May. Shorts have pretty much gone on the sidelines, even though short interest rose to a four-month high in the latest period. More shorts likely leave if the aforementioned resistance is taken out. A golden cross just formed between the 50- and 200-day.
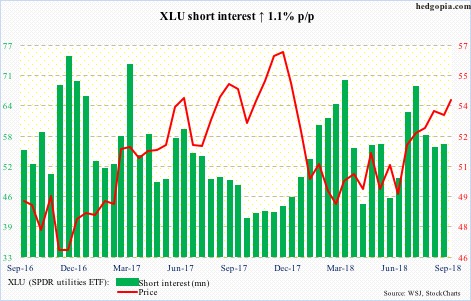
Since early June, XLU (54.18) has rallied strongly. That low defended a rising trend line from March 2009. Earlier in February this year, bids showed up near the same support. The upper end of the channel thereof currently lies at 56.50. Near-term, there is resistance at just under 55. Short interest is high enough a breakout can cause a squeeze.
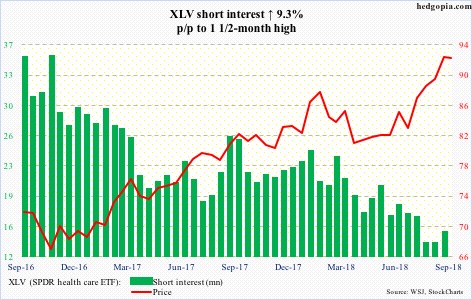
XLV (92.69) has had strong July and August. Shorts may have played a tiny role in this. Short interest remains subdued. Bulls have the momentum. They are currently trying to force another break – out of 93. Earlier, XLV broke out of 91.80 a little less than three weeks ago, with successful retest thus far.
XLY (SPDR consumer discretionary ETF)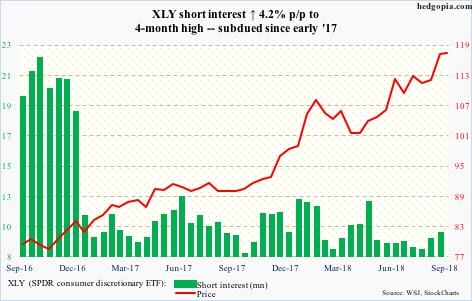
As overbought as XLY (117.16) is, momentum is intact. The ETF is on the verge of another mini-breakout. Shorts continue to lie low – rightly so. Near-term, support lies at 115-ish.
Thanks for reading!

