The Russell 2000 has broken out. There are many reasons to doubt the breakout – ranging from elevated valuations to falling profit estimates to several soft economic data points. But as long as the breakout remains intact, bulls deserve the benefit of the doubt.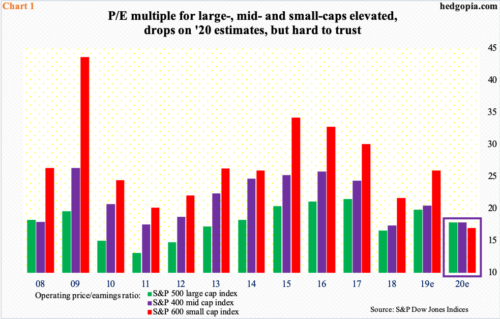
It is a potentially dangerous combination – falling profit estimates and rising stock prices. Yet, this is what major US equity indices are in the midst of currently. P/E multiples across the board have risen – some uncomfortably so.
Chart 1 presents the operating P/E for S&P 500/400/600 companies going back to 2008. Of this, years up to 2018 use trailing estimates, while 2019/2020 are based on forward estimates. With one quarter to go this year, the multiple is higher for all three indices this year versus last year. Noticeably, the P/E multiple for the S&P 600 small cap index has risen from 21.6x last year to 25.9x this year.
As far as 2020 is concerned, two facts are worthy of attention. One, multiples across the board go down significantly for next year. This is because the sell-side has penciled in very high growth rates for next year – 11.3 percent for S&P 500 companies, 14.5 percent for 400 and 52.6 percent for 600! And two, the revision trend in these estimates is not very encouraging.
In March this year, 2020 estimates for S&P 500 companies were $186.36; as of last Thursday, they had been revised downward to $176.42. Similarly, estimates for S&P 400 companies went from $136.71 in January this year to $113.32, and for S&P 600 companies from $67.63 in February this year to $59.06. Next year’s estimates for S&P 600 companies in particular suddenly fell through the roof; as recently as November 11, the sell-side expected $65.70 for next year.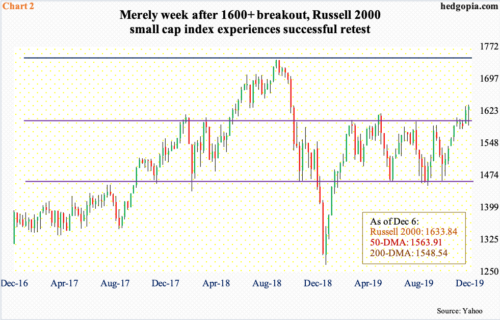
Amidst this, the Russell 2000 small cap index broke out two weeks ago, joining mid-caps which staged a range breakout five weeks ago. Both small- and mid-caps were otherwise lagging their large-cap cousins. The S&P 500 large cap index (3145.91) surpassed its July high six weeks ago; its all-time high of 3154.26 from seven trading sessions ago is a stone’s throw away. In contrast, both the Russell 2000 (1633.84) and the S&P 400 mid cap index (2021.98) reached their highs in August last year, at 1742.09 and 2053.06 respectively.
The Russell 2000’s breakout in particular is being closely watched. The index was being held down by important horizontal resistance, going back to January last year. Two weeks ago, it broke out. Then last week, a retest of that breakout was bought (Chart 2). In a perfect scenario for small-cap bulls, breakout traders could be looking to test last year’s record high.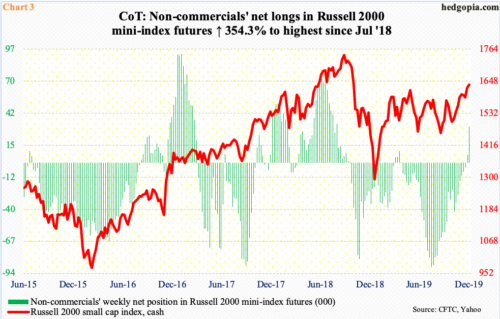
In the futures market, non-commercials increasingly are turning bullish. As of Tuesday last week, they were net long 30,842 contracts in Russell 2000 mini-index futures, up 24,053 contracts week-over-week. This was the highest weekly increase in two years.
Interestingly, these traders mid-July were net short as much as 88,737 contracts. Then they began to cut those back (Chart 3). In the meantime, bulls kept hammering on 1600+ on the cash, but the resistance held firm, including the end of July, the middle of September and most of November – until it gave way two weeks ago (Chart 2). That breakout probably led non-commercials to accumulate last week’s contracts. The question is, are bulls just trying to take advantage of favorable seasonality or something else going on?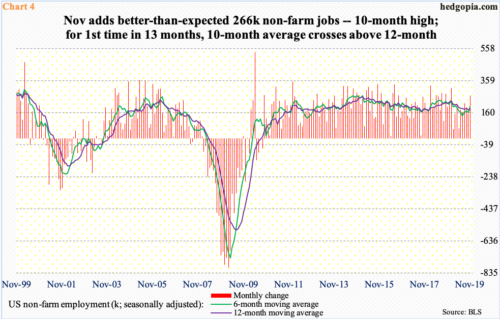
The US economy is in its 11th year of recovery/expansion post-Great Recession. Several data points such as manufacturing and business capital expenditures are in deceleration – even contraction. Several others are holding firm, such as consumer spending and jobs.
In late 2015-early 2016, manufacturing was in similar contraction. In 4Q15, as a matter of fact, real GDP only rose 0.1 percent. Then, things stabilized. The economy picked back up. Equity bulls are hoping for a similar resolution to the current softening. They remain hopeful particularly because the jobs locomotive is yet to fall off the track.
In fact, November produced much-better-than-expected 266,000 non-farm jobs – a 10-month high. For the first time in 13 months, the six-month average crossed above the 12-month (Chart 4). It could be a sign momentum is building. Better jobs data can spark small-cap stocks, as they lagged for so long.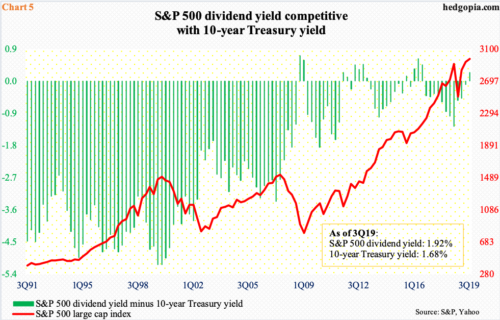
The Russell 2000 breakout two weeks ago preceded November’s jobs report. As things stand, as long as the breakout remains intact, small-cap bulls deserve the benefit of the doubt. This can be viewed as the collective wisdom of markets deciding that things are going to get better. Time will tell.
With all that said, breakouts are not always genuine. They can be false as well. Hence the need to beware the ‘this time is different’ crowd. The bond market in particular continues not to buy the enthusiasm shown by equity holders.
The 10-year Treasury yield (1.84 percent) dropped all the way to 1.43 percent early September. The rally since that low ended November 7 at just under two percent. Encouragingly for bond bears (on price), there has been a pattern of higher lows in yields the past three months, but no higher highs yet. For that to happen, the 10-year has to eclipse 1.97 percent. Should yields continue higher, they will begin to compete well – or better – with equities.
In 3Q19, the dividend yield for the S&P 500 was 1.92 percent, versus the 10-year yield at 1.68 percent. This was the first time in three years large-caps were yielding better than 10-year T-notes (Chart 5). Yields have moved up since, but not enough to exceed the dividend yield. For yield-focused investors, this is a tailwind for large-cap stocks.
In an environment where small-caps were lagging, investors were already hiding in the ‘safety’ of large-caps. This can change if – big if – small-caps are breaking out for the right reasons. In the past, investors tend to gravitate toward small-caps when they are in a mood to take on risk. If the Russell breakout is genuine, small-caps should begin to outperform large-caps soon.
Thanks for reading!

