
Major US equity indices rallied big last week, closing out right at, or near, important resistance, including moving averages, Fibonacci resistance and breakdown backtest. Concurrently, VIX is sitting on a rising trend line from early January.
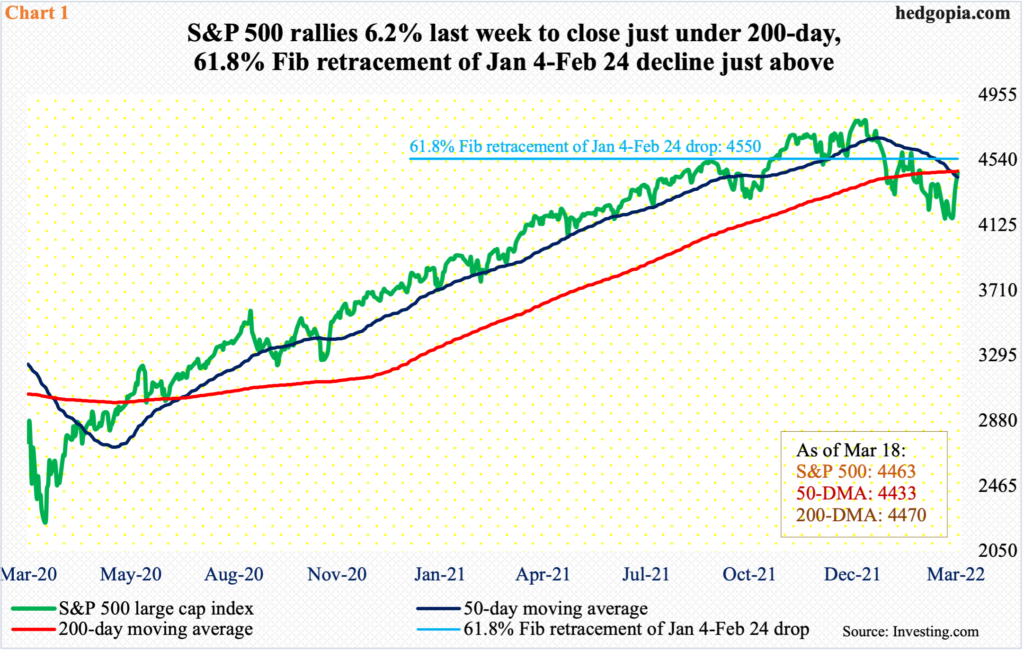
The S&P 500 (4463) began last week by testing a rising trend line from February 24 – successfully. In the next four sessions, it added 290 points, jumping 6.2 percent for the week. Friday’s 1.2-percent rally put the large cap index slightly past the 50-day moving average and essentially at the 200-day (Chart 1). The large cap index has been below the 200-day for a month now.
Should last week’s momentum carry over this week, there is another layer of resistance at 4550, which represents a 61.8-percent Fibonacci retracement of the January 4-February 24, 14.6-percent drop. Shorts are likely to actively look for opportunities should the index get near this level.
The Nasdaq 100 similarly sits at a crucial juncture.
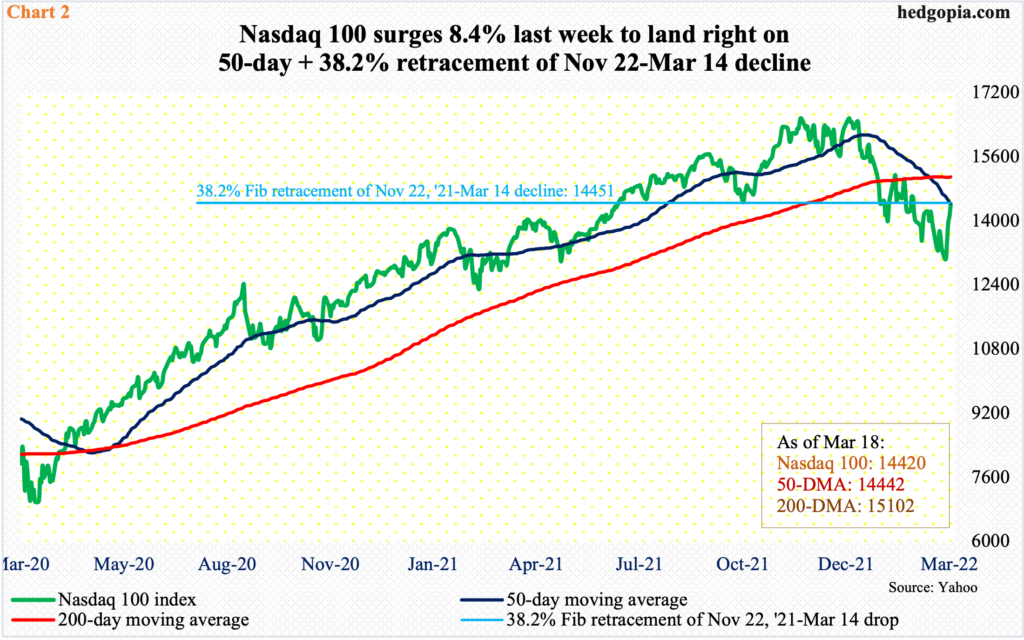
The tech-heavy index last Monday held the February 24 low – 13020 versus 13065 back then. It then went vertical in the next four sessions, jumping 8.4 percent for the week and ending right on the 50-day, which approximates horizontal resistance at 14400s.
Through last Monday’s low, the index was down 22.3 percent from the record high of 16765 posted last November. A 38.2-percent Fibonacci retracement of this drop lies at 14451. The Nasdaq 100 ended last week at 14420 (Chart 2).
Bulls can take solace in the fact that the monthly candles for December, January and February all produced candles with long lower wicks. With nine sessions to go, this is once again the case this month with a huge hammer reversal.
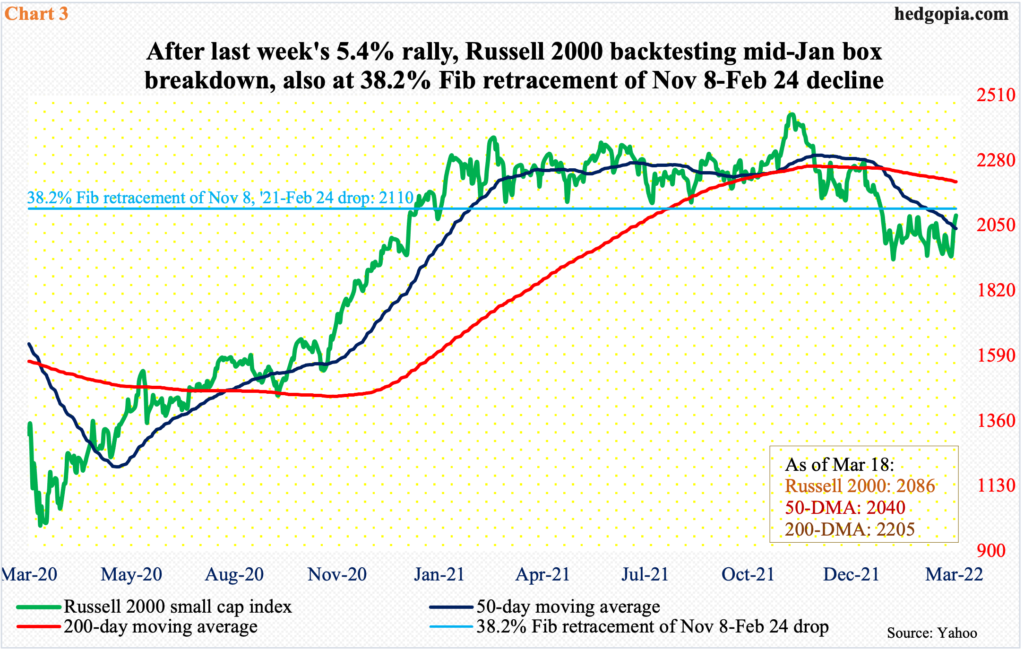
Small-cap bulls, too, should feel happy that last week’s 5.4-percent rally followed weeks of sideways action just below a breakdown point.
From last March through January, the Russell 2000 was rangebound between 2350s and 2080s, and between 2280s and 2150s within this rectangle. On Nov 3, it broke out but was quickly followed by a failed retest on the 19th (November), followed by a range breakdown in January.
On January 28, it tagged 1901, which was slightly breached on February 24 when the index ticked 1894. From the November 8 record high of 2459 through that low, the Russell 2000 tumbled 23 percent. A 38.2-percent Fibonacci retracement of this decline lies at 2110. The index closed last week at 2086, which also comprises a backtest of the rectangle breakdown.
A decisive takeout of 2080s will have significantly improved odds for higher price.
In the meantime, some interesting signals are coming out of the earnings front.
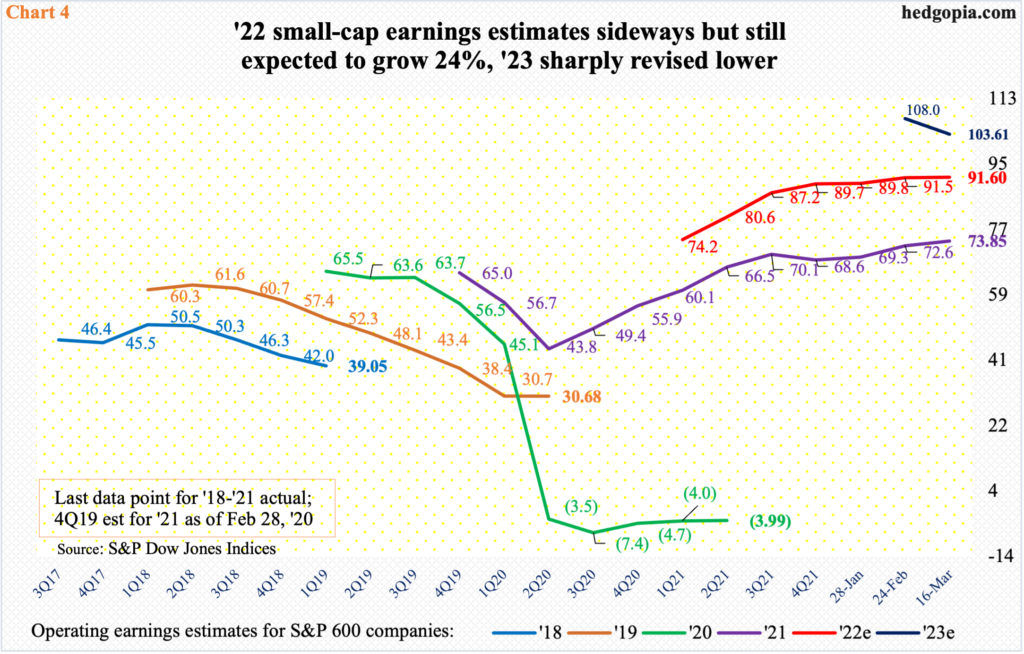
As of the 16th, S&P 600 companies rung up $73.85 in operating earnings for last year. When 4Q began, the sell-side expected these companies to bring home $20.57 for the quarter; with the quarter just about done, they have earned $25.39.
Estimates for this year were $91.60 as of the 16th, which continue to trudge higher but with a flattish look (Chart 4). Earnings are expected to grow 24 percent this year; mid-November last year, this was just under 33 percent. Growth is expected to decelerate substantially next year, when earnings are expected to rise 13.1 percent to $103.61. Less than a month ago, the sell-side expected $108.64.
By nature, small-cap companies have the largest domestic exposure versus their larger-cap cousins. The sharp leg lower in next year’s estimates could be telling in that the Fed is in a tightening mood and uncertainty has grown with it.
Last week, the Federal Reserve raised benchmark rates for the first time since December 2018, hiking by 25 basis points to a range of 25 basis points to 50 basis points. The dot plot signals six more hikes this year – essentially one each in the remaining six scheduled meetings.
The next meeting is on May 3-4. It is in that meeting the Fed also plans to announce a plan to shrink its balance sheet, which has grown from $4.24 trillion in early March 2020 to $8.95 trillion. In essence, things are getting tighter on two fronts – conventionally (fed funds rate) and unconventionally (balance sheet reduction).
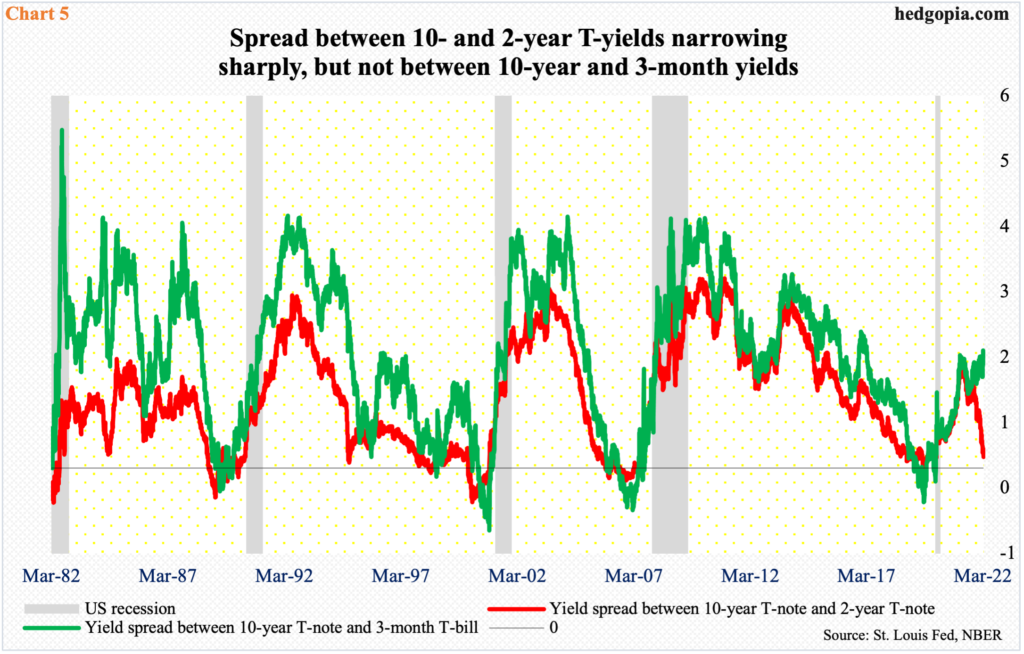
This has introduced a lot of uncertainty. The treasury yield curve is beginning to price in meaningful deceleration in economic activity.
Last Friday, the spread between 10- and two-year treasury notes stood at 17 basis points. It does not take long for this spread to invert. Historically, inversion has proven to be a reliable indicator for economic contraction (Chart 5).
With that said, the spread between 10-year notes and three-month bills is diverging, with 172 basis points separating the two last Friday. This probably gives hope for the optimists that this is no time yet for complete risk-off.
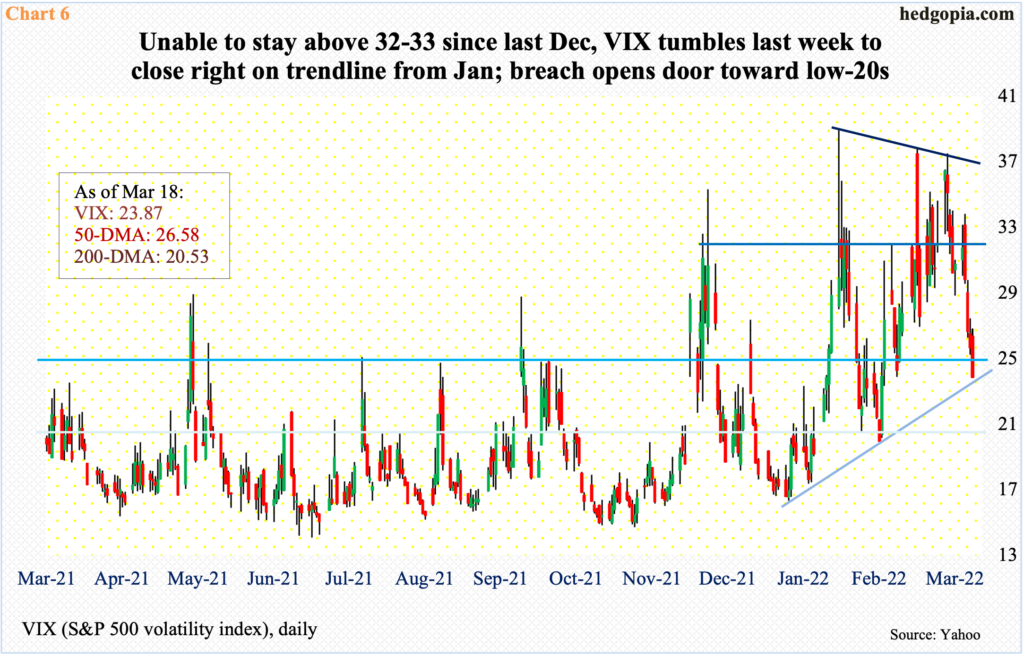
As mentioned earlier, the last four sessions last week massively took on risk. As a matter of fact, VIX (23.87) gave back 6.88 points. As did the three equity indices mentioned above, the volatility index too ended at an interesting spot, which was a rising trend line from early January (Chart 6).
Last week’s pullback in volatility preceded a rare positive correlation between VIX and the S&P 500 in the prior week, as both fell. VIX also failed to sustainably stay above 32-33 and made lower highs since the January 24 high of 38.94.
As things stand, should the trend line in question give way, VIX can head toward horizontal support at low-20s, which approximates the 200-day at 20.53. In this scenario, the S&P 500 heads toward the 61.8% Fibonacci resistance; right here and now, it is hard to imagine this getting taken out and VIX bulls not defending low-20s.
Thanks for reading!
