
Following futures positions of non-commercials are as of Feb 10, 2026.
10-year note: Currently net short 813k, up 83.6k.
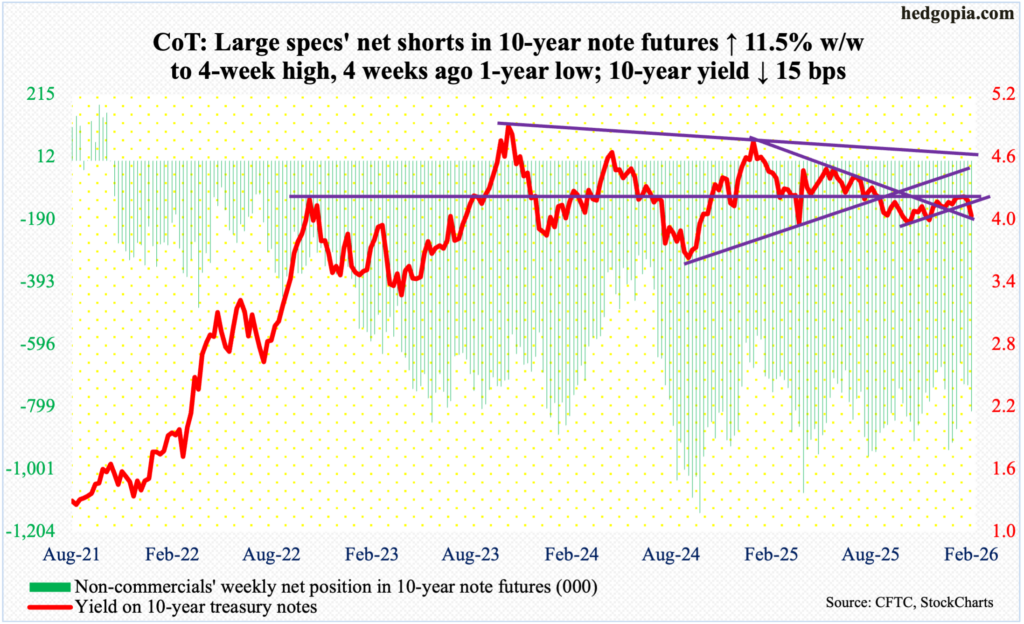
Minutes of the January 27-28 FOMC meeting will be out Wednesday. The fed funds rate was left unchanged at that meeting at a range of 350 basis points to 375 basis points. There were two dissents, with Governors Stephen Miran and Christopher Waller voting for a quarter-point rate cut.
The Federal Reserve has eased by 75 basis points – in three 25-basis-point increments – since last September, and by 175 basis points since September 2024. President Donald Trump has consistently argued for much lower rates, and Chair Jerome Powell, who will be retiring in May, has refused to yield.
Trump wants lower rates not only on the short end but also on the long end of the yield curve. The Fed controls the short rates, while long rates, such as the 10-year treasury yield, are priced in the bond market. The Fed can, however, influence the long end with the help of its balance sheet.
Prior to the financial crisis, its balance sheet was under $1 trillion. After four iterations of quantitative easing, the balance sheet peaked at $8.9 trillion in May 2022. As of Wednesday, the central bank’s assets totaled $6.6 trillion, having bottomed at $6.5 trillion in early December.
Kevin Warsh, who has been nominated to replace Powell and previously served as governor between February 2006 and March 2011, is a known hawk, having resisted continued QE during the financial crisis. Markets are currently grappling with the prospect of QE – or a lack thereof – under the Warsh leadership, and the minutes will obviously not be shedding light on this.
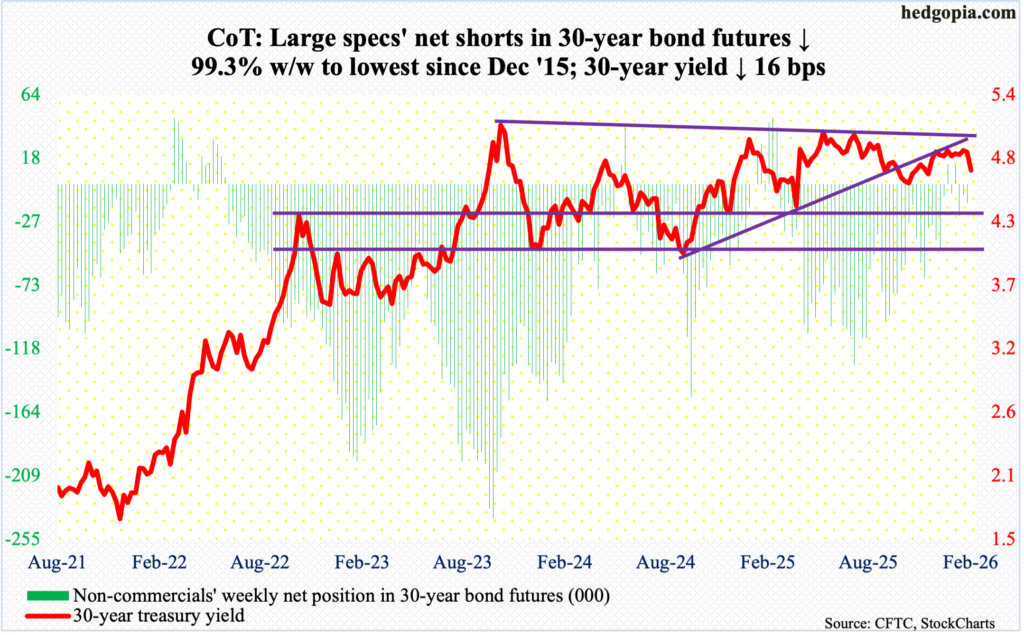
30-year bond: Currently net short 92, down 13.5k.
Major US economic releases for next week are as follows. Markets are closed Monday for observation of President’s Day holiday.
The NAHB housing market index (February) is due out Tuesday. Homebuilder optimism in January dropped three points month-over-month to 37 – a three-month low.
Housing starts (November and December), durable goods orders (December) and industrial production/capacity utilization (January) are on schedule for Wednesday.
October housing starts fell 4.6 percent m/m to a seasonally adjusted annual rate of 1.25 million units. This was the lowest reading since May 2020.
Orders for non-defense capital goods ex-aircraft – proxy for business capex plans – increased 0.4 percent m/m in November to $78.2 billion, which set a record.
Capacity utilization in December inched up 0.2 percent m/m to 76.3 percent – a five-month high.
Friday brings GDP (4Q25, advance), personal income/spending (December), new home sales (November and December) and University of Michigan’s consumer sentiment index (February, preliminary).
In the September quarter, real GDP expanded at an annual rate of 4.4 percent – an eight-quarter high.
In the 12 months to November, headline and core PCE (personal consumption expenditures) rose 2.77 percent and 2.79 percent respectively, with both at a two-month high.
Sales of new homes edged lower 0.1 percent m/m in October to 737,000 units (SAAR). September’s 738,000 hit a 28-month high.
Consumer sentiment in January grew nine-tenths of a point m/m to 57.3 – a six-month high. Last November’s 51 print was the lowest since the record low 50 set in June 2022.
WTI crude oil: Currently net long 208.6k, up 6.2k.
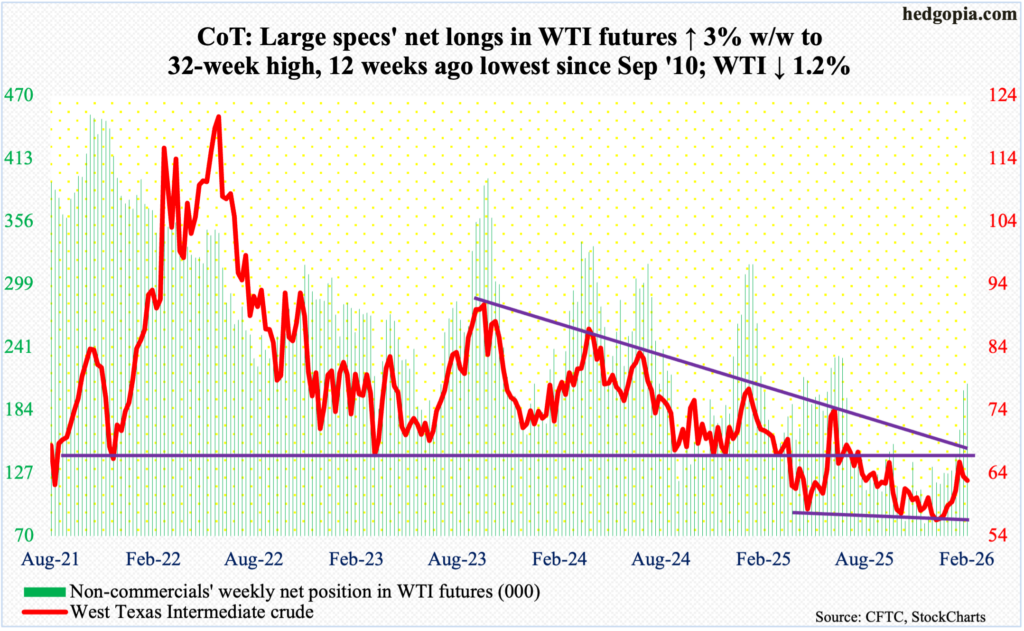
Horizontal resistance at $65-$66 goes back many years, and it held this week, as it did in the prior two weeks.
This Week, West Texas Intermediate crude dropped 1.2 percent to $62.81/barrel, with an intra-day high of $65.83 on Wednesday. The highs in the prior two weeks were $65.53 and $66.48. Sellers are showing up at $65-$66. Right around there also lies a falling trendline from March 2022 when the crude hit $126.42 intraday and reversed lower.
Previously, WTI stabilized around $56, which going back to at least last April has drawn bids.
The 200-day has provided support since late January, but the average ($62.30) – flattish – is vulnerable. The next layer of support rests north of $61, with the 50-day at $59.92.
In the meantime, as per the EIA, US crude production in the week to February 6 increased 498,000 barrels per day week-over-week to 13.713 million b/d; output registered a record 13.862 mb/d in the week to November 7 last year. Crude imports increased 604,000 b/d to 6.8 mb/d. As did crude and gasoline inventory, which respectively grew 8.5 million barrels and 1.2 million barrels to 428.8 million and 259.1 million barrels. Stocks of distillates dropped 2.7 million barrels to 124.7 million barrels. Refinery utilization fell 1.1 percentage points to 89.4 percent.
E-mini S&P 500: Currently net short 105.1k, down 27.8k.
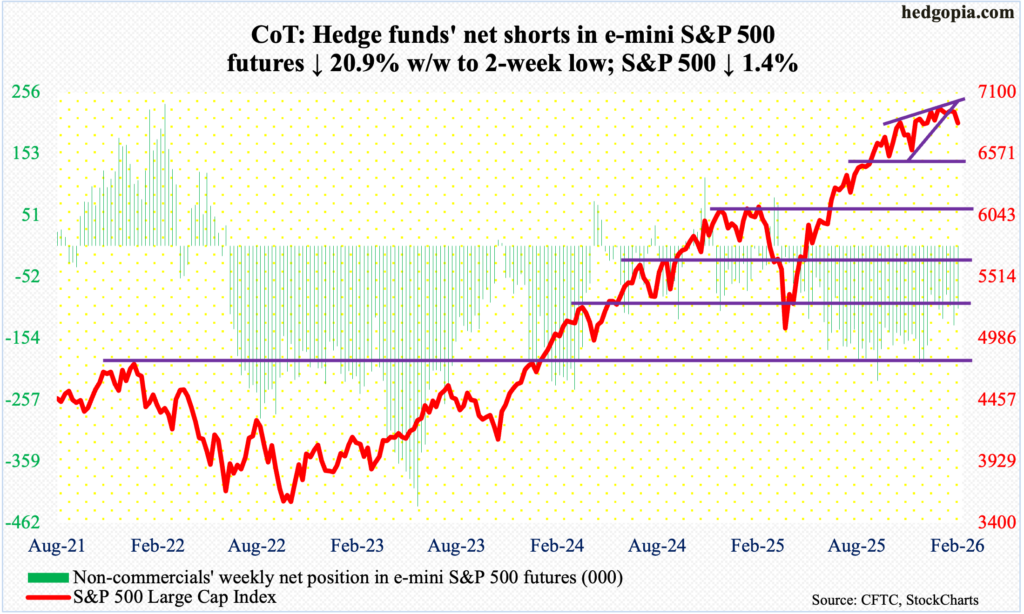
The 50-day (6895) is beginning to turn lower, albeit ever so slightly. Down 1.4 percent this week to 6836, the S&P 500 breached both the average and lateral support at 6920s. The large cap index has essentially straddled 6920s for 16 weeks now, with a record 7002 printed on 28 January. In the week in which that high was recorded, the index finished with a weekly spinning top, which also appeared two weeks before that and a week after, meaning the candle showed up in three out of four weeks. The sideways move follows a massive rally from last April when the index bottomed at 4835.
The S&P 500 was also caught in a rising wedge, which often breaks to the downside, and it has. On the monthly, January’s spinning top followed December’s spinning top and November’s hanging man. All in all, equity bears have an opportunity here to push prices lower; more downward pressure is likely once they take control of 6770s.
Euro: Currently net long 180.3k, up 16.9k.
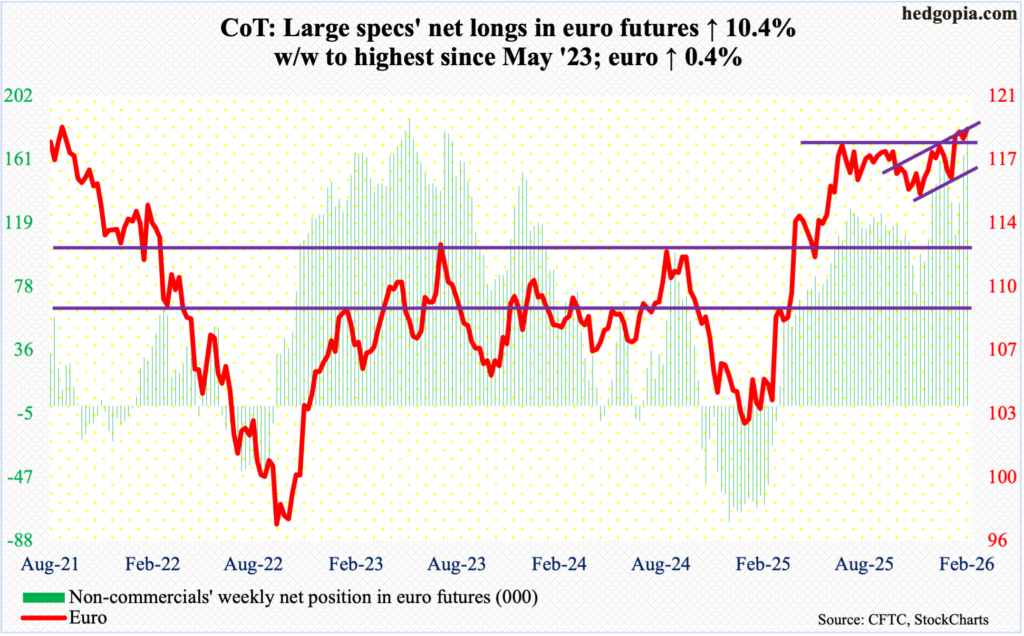
Non-commercials are convinced better days lie ahead for the euro, as the net longs that they have accumulated are at the highest since May 2023. In the meantime, bulls and bears continue to lock horns in search of control of $1.18. Resistance just north of $1.18 goes back to at least last June.
Four weeks ago, the euro jumped two percent to $1.1829, breaking a three-week losing streak. This was followed by a breakout a couple of weeks ago, with an intraday tag on 27 January of $1.2083, which the bulls were unable to keep, finishing the week at $1.1852 and forming a weekly gravestone doji, which is a bearish pattern.
That said, bulls are not in a mood to let go of $1.18 that easy. This week, they rallied the currency 0.4 percent to $1.1869. In the event they fail to defend $1.18, there is straight-line support at $1.15s.
Gold: Currently net long 160k, down 5.6k.
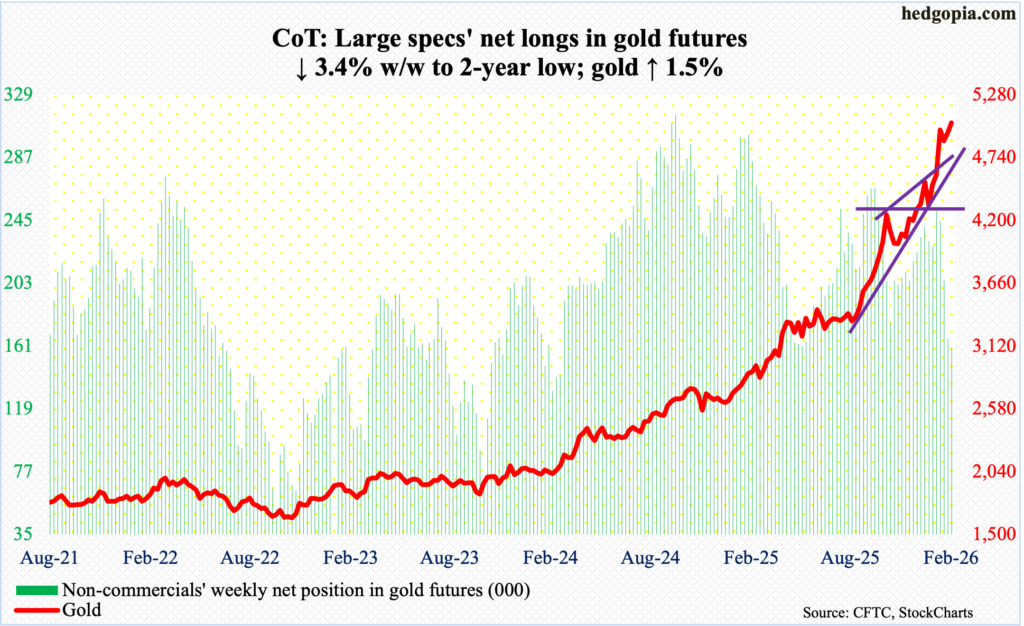
With the month halfway through, February is up 3.2 percent. If gold bugs hang on to these gains, the metal would have rallied for seven months in a row; in fact, over 27 months, there have only been five down months. In October 2023, gold bottomed at $1,810.
This looks fine and dandy, except when one takes a deeper look at how the monthly candles are beginning to take shape. On 29 January, gold ticked $5,608 intraday but only to then drop to $4,405 two trading sessions later. January ended with a monthly candle with a very long wick, even as February’s is way off the lows. This week, the yellow metal rose 1.5 percent to $5,042/ounce.
The February 2 low of $4,405 was essentially a defense of horizontal support at $4,370s. The January 29 high is an important price point, which is likely to draw sellers. Should the bulls fails to save $4,370s, the next layer of support lies at $3,900 and then $3,440s.
Nasdaq (mini): Currently net long 13.4k, down 827.
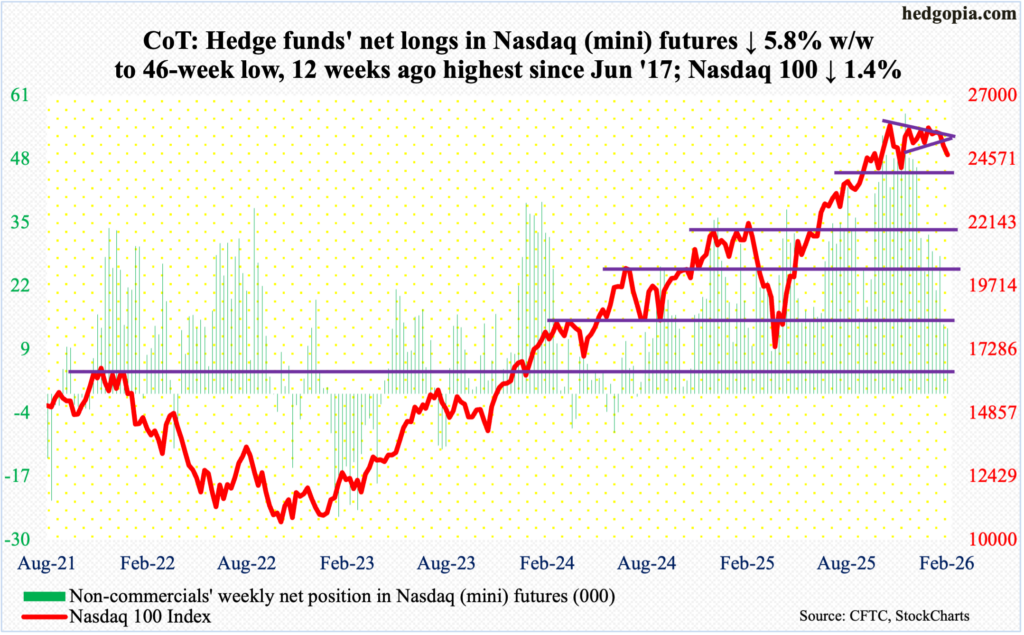
The Nasdaq 100 rallied 58 percent between the intraday low of 16542 on 9 April and the all-time high of 26182 on 29 October. A symmetrical triangle from the October high just broke to the downside. This week, the tech-heavy index gave back 1.4 percent to 24733. For nine trading sessions now, the index has been under the 50-day (25421), which seems to be in the early stages of rolling over.
At some point, a test of the 200-day (23884) is just a matter of time. Signs of fatigue are showing up. Both January and December produced a monthly doji, which followed November’s hanging man.
Russell 2000 mini-index: Currently net long 7.1k, up 2.8k.
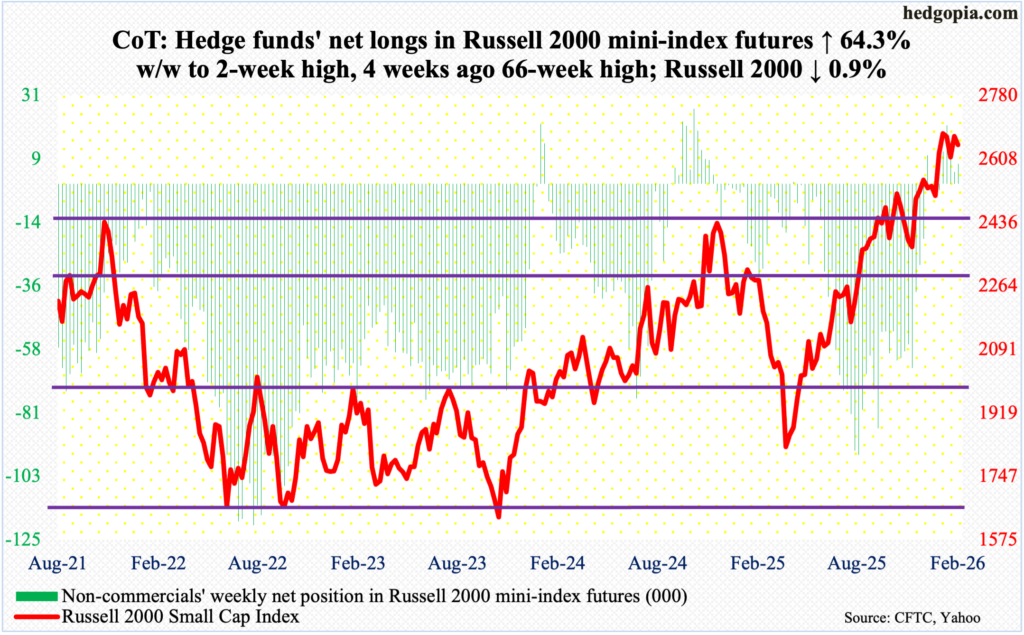
The Russell 2000 came within less than 29 points of its all-time high of 2735 set on 22 January, but bulls were unable to keep the gains. On Tuesday and Wednesday this week, the small cap index reached 2704 and 2706 respectively, but only to finish the week at 2647, down 0.9 percent.
In the week the index tagged 2735, a weekly shooting star developed; this week, a weekly spinning top formed. Even as small-cap bulls are struggling at 2700, the fact remains that the index is above 2540s, wherein occurred a breakout retest last week. Bulls deserve the benefit of the doubt if this level is intact. After this lies another crucial retest at 2460s.
The current consolidation follows potentially bearish candles of November and December, which respectively produced a hanging man and a shooting star.
US Dollar Index: Currently net short 729, down 123.
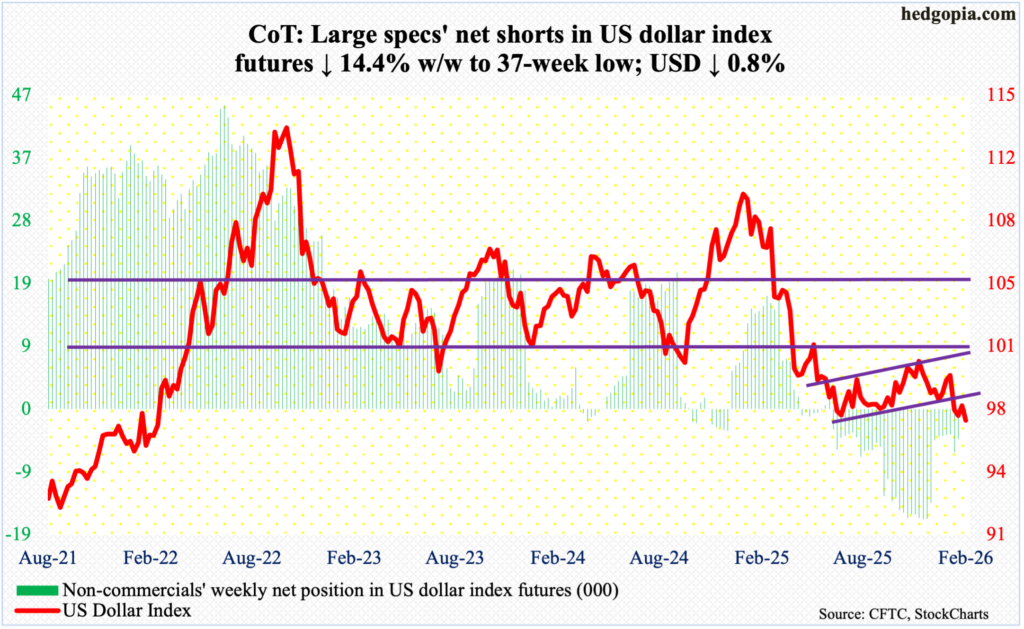
Once again, resistance just south of 98 proved tough to crack. The US dollar index began the week with a rejection Monday at 97.76, closing the week down 0.8 percent to 96.88, with a low of 96.49 on Wednesday. Three weeks ago, there was aggressive buying interest under 96.
In January last year, after a three-plus-month rally, the index reversed hard at 110.18, subsequently reaching 96.38 in June and successfully testing that low with a lower low of 96.22 in September. Three weeks ago, another lower low of 95.55 was ticked on 27 January, and that was embraced by dollar bulls, ending the week with a weekly dragonfly doji.
Bulls need to recapture 98 before they can eye resistance just north of 100, which goes back more than a decade.
VIX: Currently net short 65.1k, down 15.5k.
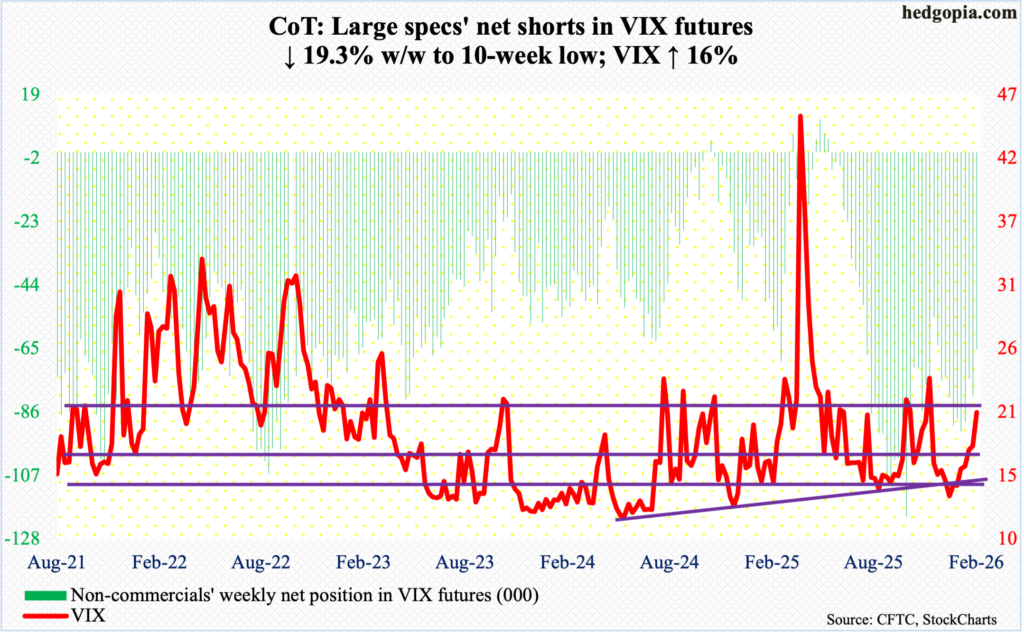
Volatility bulls continue to defend a rising trendline from Christmas Eve when VIX ticked 13.38 intraday. On Wednesday, it tagged 16.75 intraday, closing the week up 2.84 points to 20.60, although Friday’s high 22.40 was squandered.
In the right circumstances for volatility bulls, both the daily and weekly have room to head higher.
Thanks for reading!
