
Following futures positions of non-commercials are as of Feb 17, 2026.
10-year note: Currently net short 877.9k, up 64.8k.
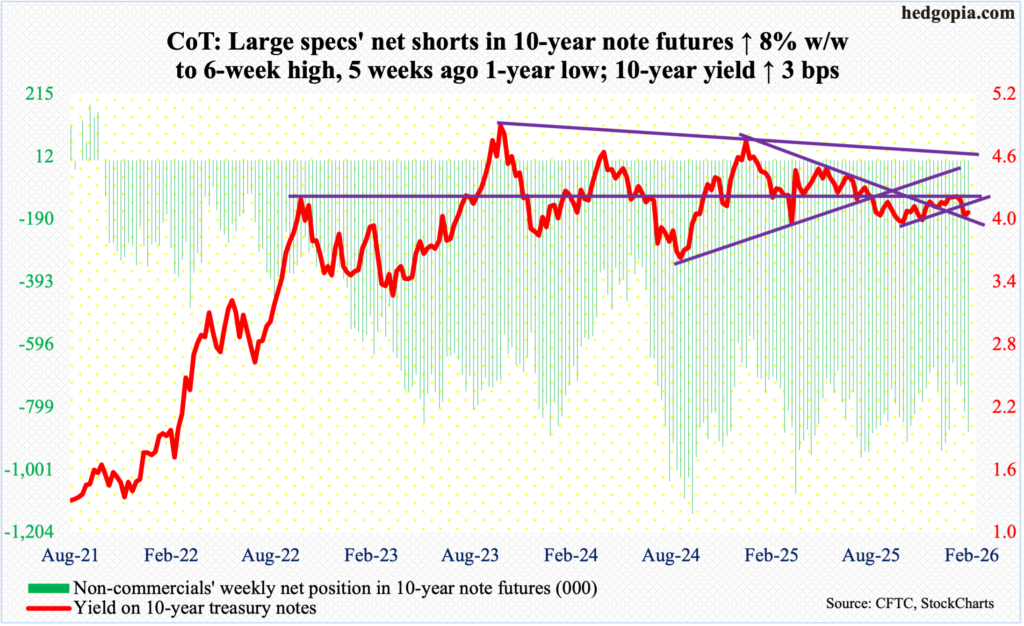
On Friday, the day the Supreme Court struck down President Donald Trump’s blanket tariffs in a 6-3 vote, the 10-year treasury yield rose a basis point to 4.09 percent; in fact, rates rallied nearly three basis points from the session low 4.06 percent. Non-commercials, who are betting on higher rates with massive holdings of net shorts, must be happy, although it is hard to tell if there is any message in the way these notes traded on Friday.
Tariffs effectively are a tax, and an absence of tariffs means more money in the pockets of consumers and companies. This could help goose up the economy – and possibly inflation – so a rally in the 10-year yield makes sense. At the same time, now that the tariff uncertainty has gone away, rates arguably should have gone lower. Amidst this push and pull, the fact remains that the daily technicals currently favor a rally in the yield.
Then, there is this. Yes, the Court ruled that the tariffs imposed by Trump using the International Emergency Economic Powers Act are illegal, but the President quickly followed that with an executive order to impose 10 percent import taxes on goods from all nations. He is doing so under a different tariff authority, Section 122 of the Trade Act of 1974, and this will be in place for 150 days.
The Court, however, was silent on whether the Trump administration will be required to issue refunds to US importers that have already paid the tariffs, which have now been ruled illegal. This opens the probability of litigation. Plus, Trump almost certainly will try to find other ways to maintain high tariffs once the 150 days are over. Translation: more chaos to come.
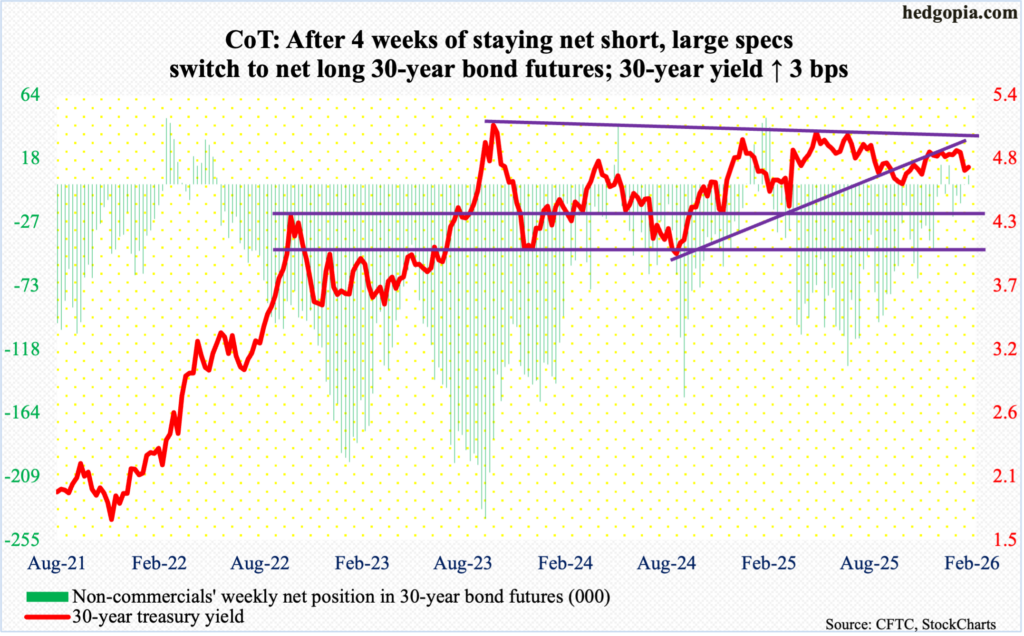
30-year bond: Currently net long 6.4k, up 6.5k.
Major US economic releases for next week are as follows.
Factory orders (December) are due out Monday. Preliminarily, December orders for non-defense capital goods ex-aircraft – proxy for business capex plans – increased 0.6 percent month-over-month to a seasonally adjusted annual rate of $79 billion, which set a record.
The S&P Cotality Case-Shiller home price index (December) is on schedule for Tuesday. In November, home prices nationally rose 1.4 percent from a year ago. September’s 1.3-percent growth rate was the slowest year-over-year appreciation since July 2023.
Friday brings the producer price index (January). In the 12 months to December, headline and core PPI increased three percent and 3.5 percent, in that order. This was the second month in a row both metrics rose with a three handle.
WTI crude oil: Currently net long 210.7k, up 2.1k.
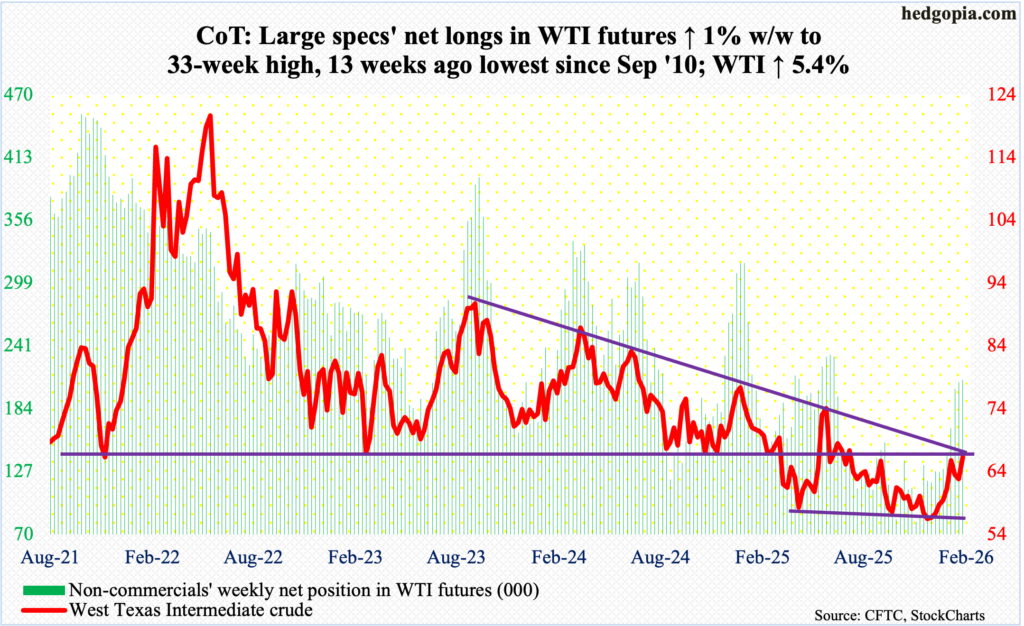
In late December-early January, West Texas Intermediate crude bottomed at $56, which going back to at least last April has drawn bids. The crude then has had seven out of nine up weeks, including this week’s 5.4-percent jump to $66.31/barrel, but it also remains bound by dual resistance. Horizontal resistance at $65-$66 goes back many years. Right around there also lies a falling trendline from March 2022 when WTI hit $126.42 intraday and reversed lower.
Last week’s intraday high $65.83 was tagged on Wednesday; this was preceded by the highs in the prior two weeks of $65.53 and $66.48. Sellers are showing up at $65-$66. This is likely to occur again as the daily is getting stretched; the weekly remains extended. Mid- to long-term, oil bulls have an edge here. They have defended the 200-day moving average ($62.44) in excess of three weeks now, with the crude already above the 50-day ($60.37).
In the meantime, as per the EIA, US crude production in the week to January 13th increased 22,000 barrels per day week-over-week to 13.735 million b/d; output registered a record 13.862 mb/d in the week to November 7 last year. Crude imports decreased 281,000 b/d to 6.5 mb/d. As did stocks of crude, gasoline, and distillates, which respectively declined nine million barrels, 3.2 million barrels and 4.6 million barrels to 419.8 million barrels, 255.8 million barrels and 120.1 million barrels. Refinery utilization grew 1.6 percentage points to 91 percent.
E-mini S&P 500: Currently net short 177.8k, up 72.7k.
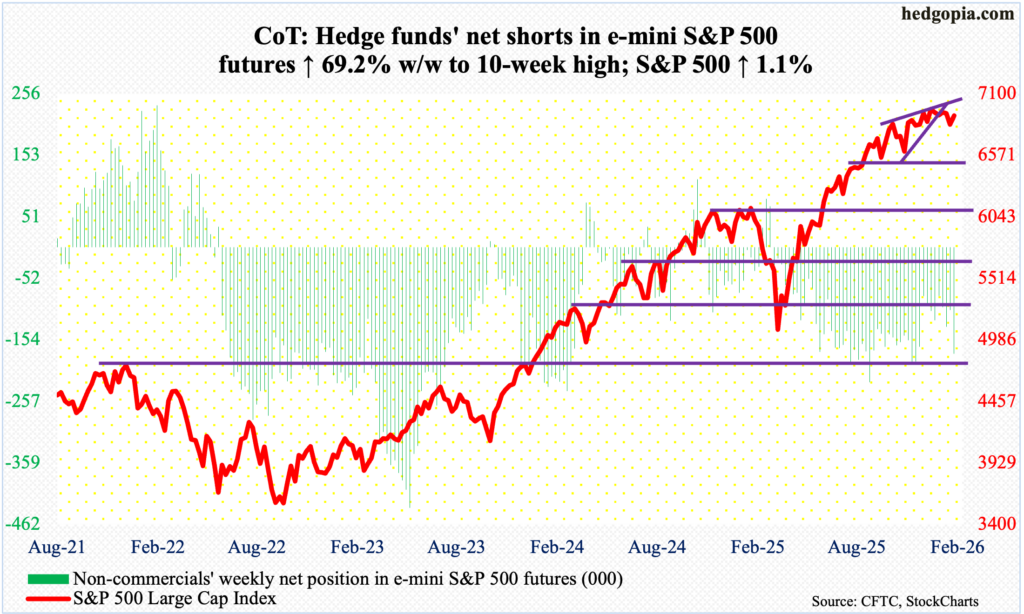
On 28 January, the S&P 500 posted a new all-time high of 7002, before coming under minimal pressure and rising again. A lower high of 6993 was tagged on the 11th this month; the subsequent downward pressure once again found bids waiting this Tuesday at 6776. Going back four and a half months, 6770s has proven to be important for both bulls and bears. Defending the support, bulls rallied the large cap index 1.1 percent this week to 6910 – past the 50-day at 6896 and just under horizontal resistance at 6920s.
The S&P 500 has essentially straddled 6920s for 17 weeks now. The sideways move followed a massive rally from last April when the index bottomed at 4835.
Near-term, odds are decent that the index reclaims 6920s and rallies toward 6960, wherein lies trendline resistance from 28 January. Mid- to long-term, bulls still need to shake off the lethargy writ all over how the index is trading.
On the monthly, January’s spinning top followed December’s spinning top and November’s hanging man. With five sessions to go, February is on course for a monthly doji.
Euro: Currently net long 174.5k, down 5.8k.
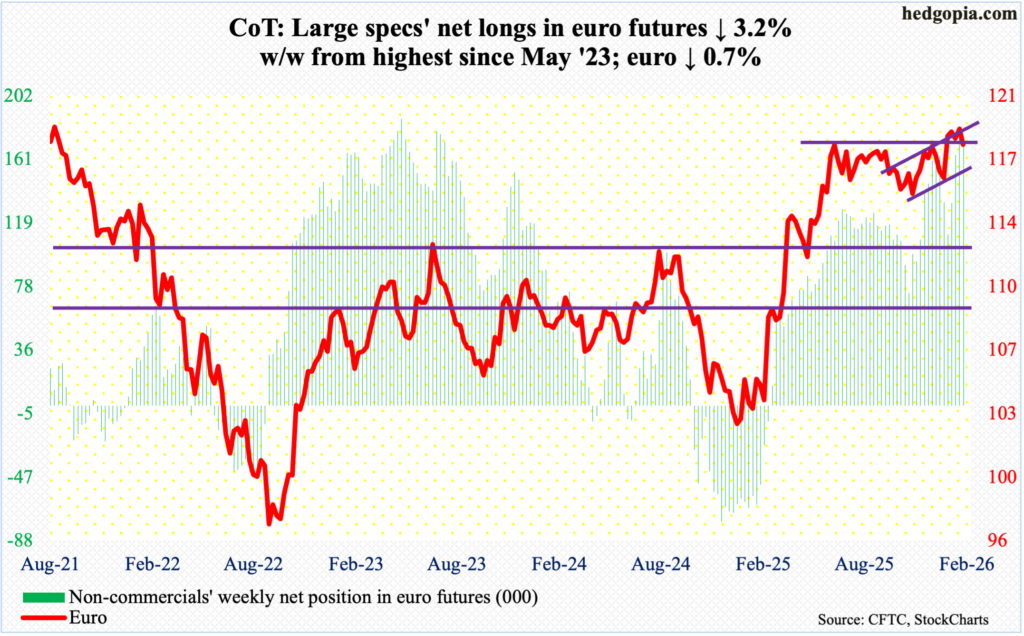
Euro bulls did their best to continue to stay above $1.18 but suffered a defeat this week, with the currency giving back 0.7 percent to $1.178. Resistance just north of $1.18 goes back to at least last June.
In January last year, the euro bottomed at $1.018. One year later – on 27 January, to be precise – it ticked $1.208, which the bulls were unable to hang on to, finishing the week at $1.185 and forming a weekly gravestone doji, which is a bearish pattern. Three weeks later, the euro has slid back under $1.18.
Non-commercials are still heavily net long and could be tempted to lock in their gains. In this scenario, there is straight-line support at $1.15s, not to mention the 200-day at $1.166.
Gold: Currently net long 159.9k, down 97.
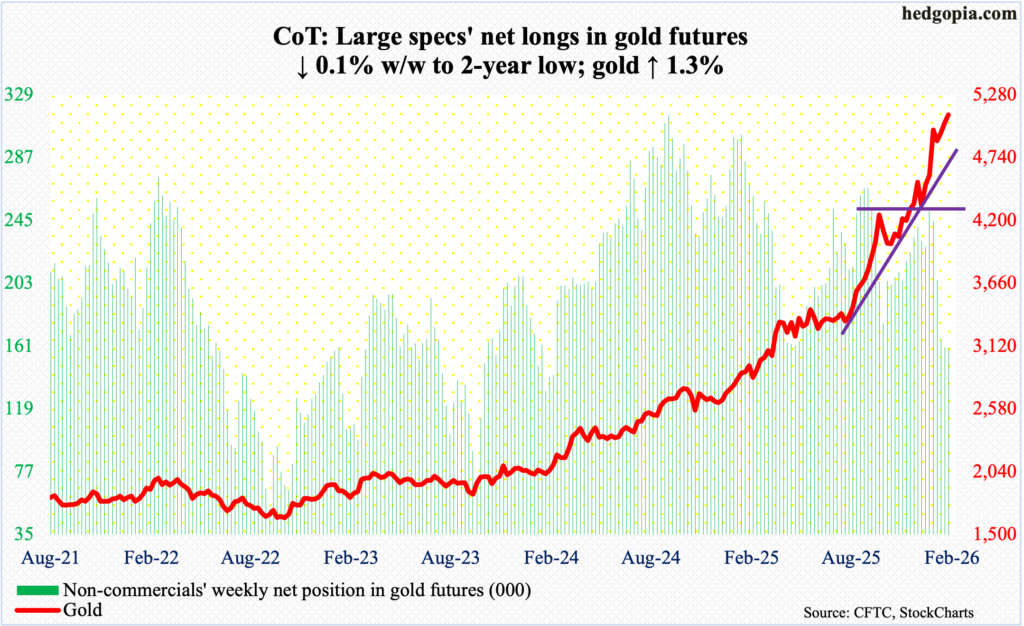
Defense of horizontal support at $4,370s three weeks ago has continued to bear fruits for gold bugs. The metal is up three weeks in a row, including this week’s rise of 1.3 percent to $5,108/ounce.
On 29 January, gold ticked $5,608 intraday but only to then quickly drop to $4,405 two trading sessions later on 2 February. It has since risen, but momentum is not as strong as before. Month-to-date, gold is up 4.5 percent, and the yellow metal is well on its way to rally for seven months in a row; in fact, over 27 months, there have only been five down months. In October 2023, gold bottomed at $1,810.
Amidst this came the potentially crucial reversal four weeks ago. Should gold bulls fail to save $4,370s, the next layer of support lies at $3,900 and then $3,440s.
Nasdaq (mini): Currently net long 24.4k, up 11.1k.
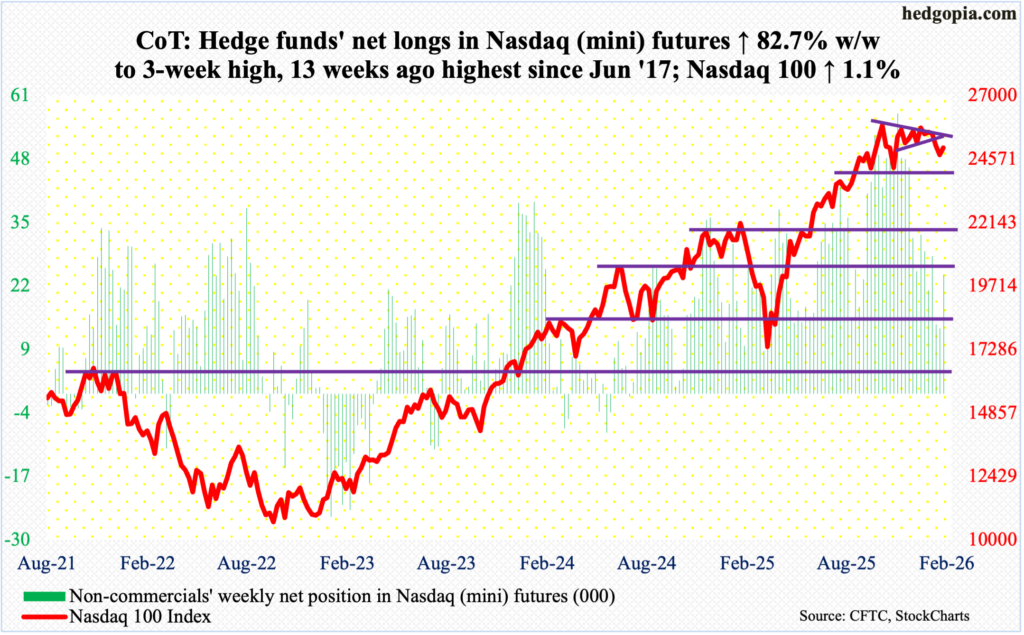
If Friday’s weakness in the opening minutes held, the Nasdaq 100 would have registered a fourth weekly loss this week, but a decidedly positive Friday turned the week into up 1.1 percent to 25013.
Earlier, the tech-heavy index shot up 58 percent between the intraday low of 16542 on 9 April (last year) and the all-time high of 26182 on 29 October. Four weeks ago, on 28 January, it came within 17 points of the October high before offers overwhelmed bids. A symmetrical triangle from the October high just broke to the downside three weeks ago.
For bulls’ consolation, they have managed to defend 24500 but are having to deal with monthly candles reeking of fatigue. Both January and December produced a monthly doji, which followed November’s hanging man. February is so far down 2.1 percent.
Russell 2000 mini-index: Currently net short 7.1k, up 14.1k.
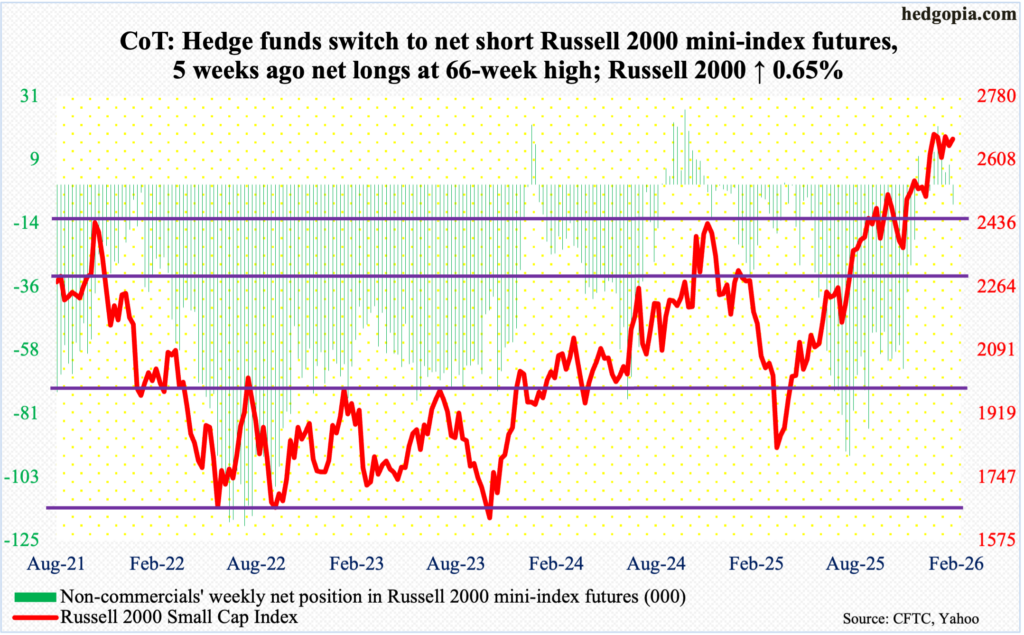
After five weeks of staying net long, including one with holdings at 66-week high, non-commercials switched to net short this week. They must be pretty frustrated by the way the cash has been treading water for several weeks now.
The Russell 2000 rallied 0.65 percent this week to 2664, with a high of 2687 on Wednesday. Last week’s high of 2706 came within less than 29 points of the all-time high of 2735 set on 22 January.
Seven weeks ago, the small cap index broke out of 2540s, followed by a breakout retest two weeks ago. Bulls deserve the benefit of the doubt if this level remains intact. After this lies another crucial retest at 2460s.
That said, post-2540s breakout, momentum has run out of steam, marked by a weekly shooting star and a couple of spinning tops. The current lethargy – or consolidation – follows the potentially bearish candles of November and December, which respectively produced a hanging man and a shooting star, with January leaving behind a long wick on the candle.
US Dollar Index: Currently net long 328, up 1.1k.
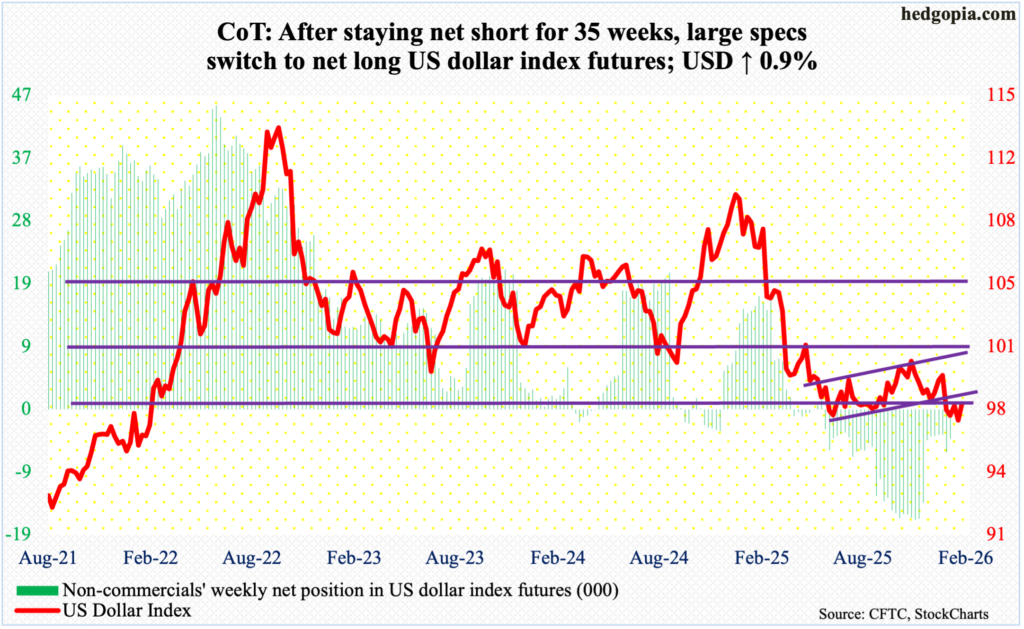
Once again, dollar bulls are having a tough time cracking 98, and once again, 96 has provided support. This week, the US dollar index rallied 0.9 percent to 97.80, with a high of 98.08 and a low of 96.80.
Four weeks ago, there was aggressive buying interest under 96.
In January last year, after a three-plus-month rally, the US dollar index reversed hard at 110.18, subsequently reaching 96.38 in June and successfully testing that low with a lower low 96.22 in September. Four weeks ago, on 27 January, another lower low 95.55 was ticked, and that was embraced by dollar bulls, ending the week with a weekly dragonfly doji.
Bulls need to recapture 98 before they can eye resistance just north of 100, which goes back more than a decade. At this point, bulls deserve the benefit of the doubt.
VIX: Currently net short 71.8k, up 6.7k.
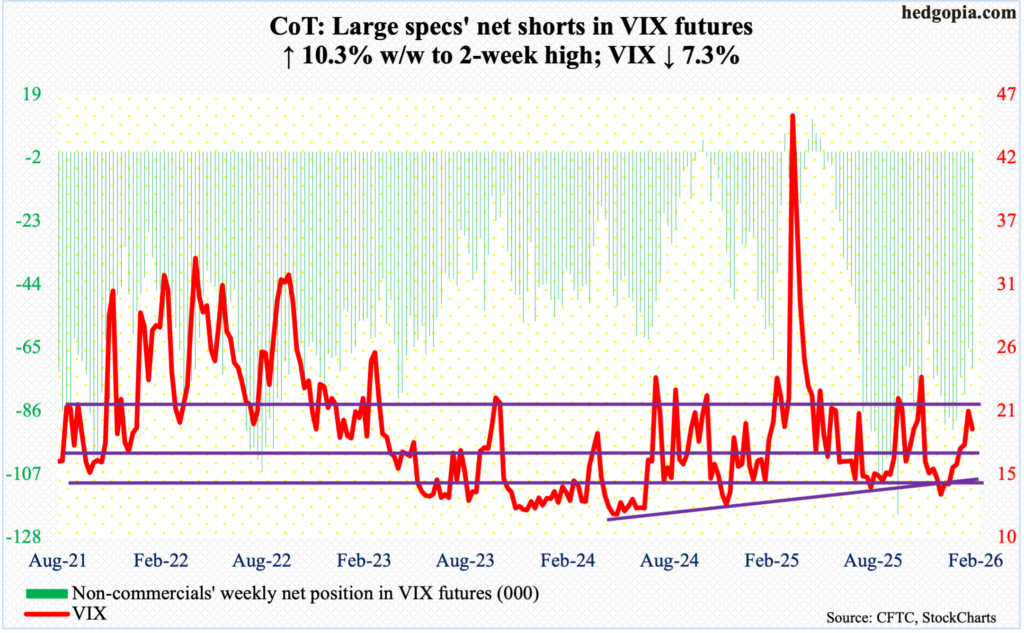
On Christmas Eve, VIX ticked 13.38 intraday and bottomed. In the subsequent sessions, a well-defined rising trendline has formed. This will be tested just under 18. This week, the volatility index dropped 1.51 points to 19.09.
Yet again, volatility bulls this week saw intraday strength frittered away, with VIX ticking 22.96 on Tuesday. A likely trendline breach ahead will open the door to the 200- and 50-day (17.34 and 16.62 respectively).
Thanks for reading!
