
Following futures positions of non-commercials are as of April 7, 2026.
10-year note: Currently net short 823.6k, up 39.6k.
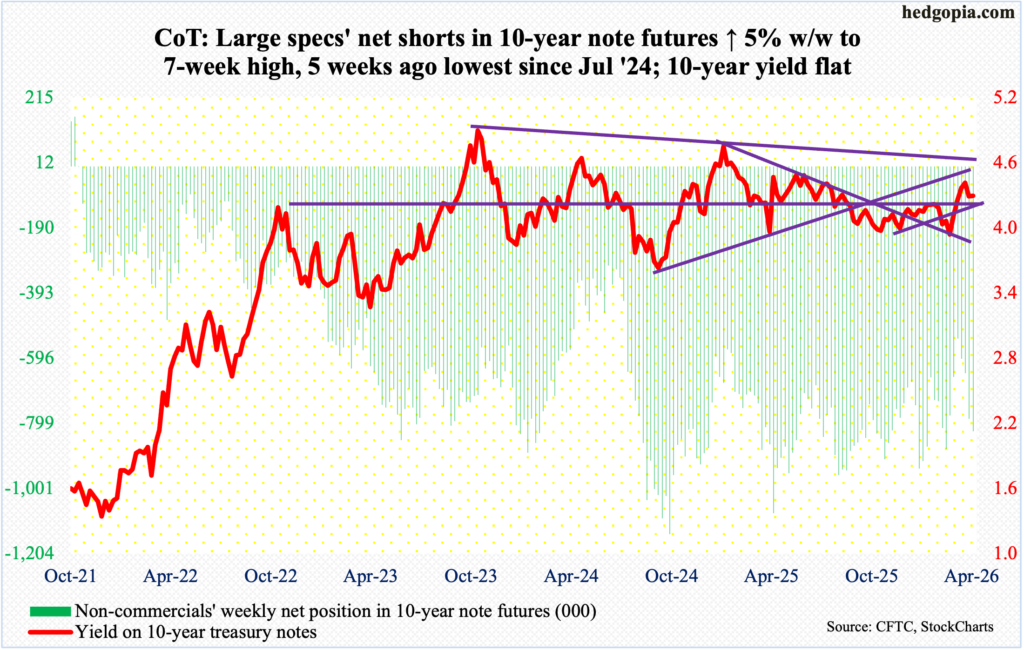
Non-commercials are once again aggressively adding to net shorts in 10-year futures, with the holdings up 58 percent from a 20-month low 534,883 contracts as of March 10. Since that low, rates did indeed rise, which is what these traders were betting for (price and yield move inverse to each other).
As a matter of fact, the 10-year yield bottomed at 3.96 percent on February 27 and went on to tag 4.48 percent on March 27, before coming under pressure to end this week flat at 4.32 percent; on Wednesday, yields touched 4.23 percent. There is important horizontal support at 4.20s, so bond bears (on price) did a good job of defending it. The question is if they would be able to continue to do so.
The March 27 high just about tested a falling trendline from October 2023 when the 10-year peaked at five percent. This hurdle is holding. Once 4.20s – also approximated by the 50- and 200-day moving averages (4.21 percent and 4.19 percent respectively) – give way, rates could very easily gravitate toward four percent. This is not what non-commercials are currently positioned for.
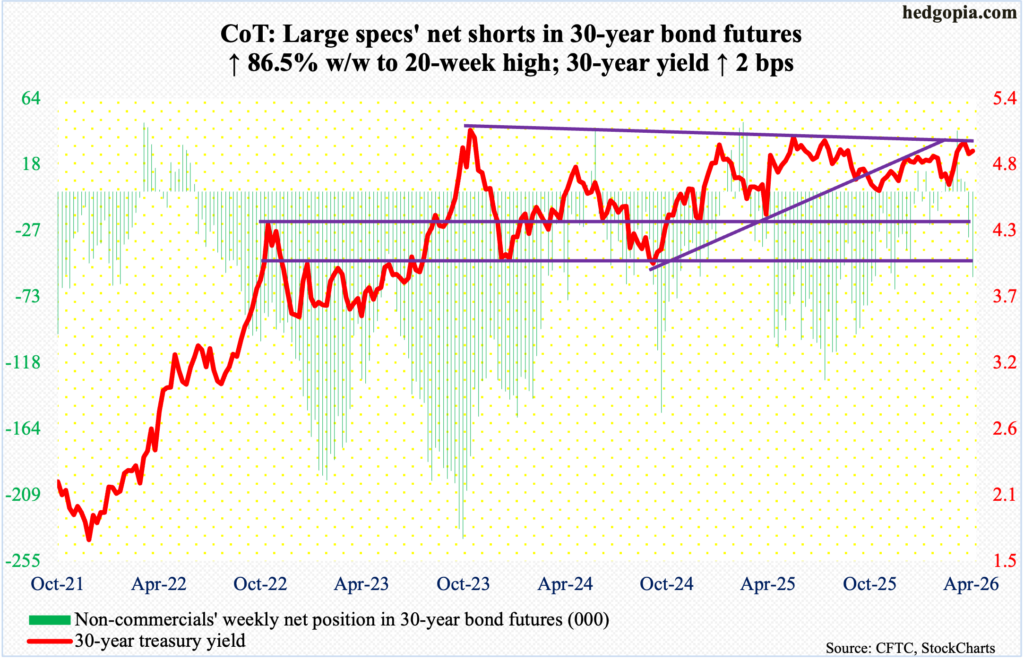
30-year bond: Currently net short 59k, up 27.4k.
Major US economic releases for next week are as follows.
Existing home sales (March) are due out Monday. Sales rose 1.7 percent month-over-month in February to a seasonally adjusted annual rate of 4.09 million units, matching last November’s reading.
The NFIB optimism index (March) and the producer price index (March) are scheduled for Tuesday.
In February, small-business optimism dropped five-tenths of a point m/m to 98.8, which set a four-month low.
In the 12 months to February, headline and core wholesale prices jumped 3.4 percent and 3.5 percent respectively.
Wednesday brings the NAHB housing market index (April). Homebuilder confidence edged up a point m/m in March to 38 – a three-month high.
Industrial production/capacity utilization (March) will be published Thursday. Capacity utilization edged up 0.05 percent m/m in February to 76.3 percent – a seven-month high.
WTI crude oil: Currently net long 168.3k, down 230.
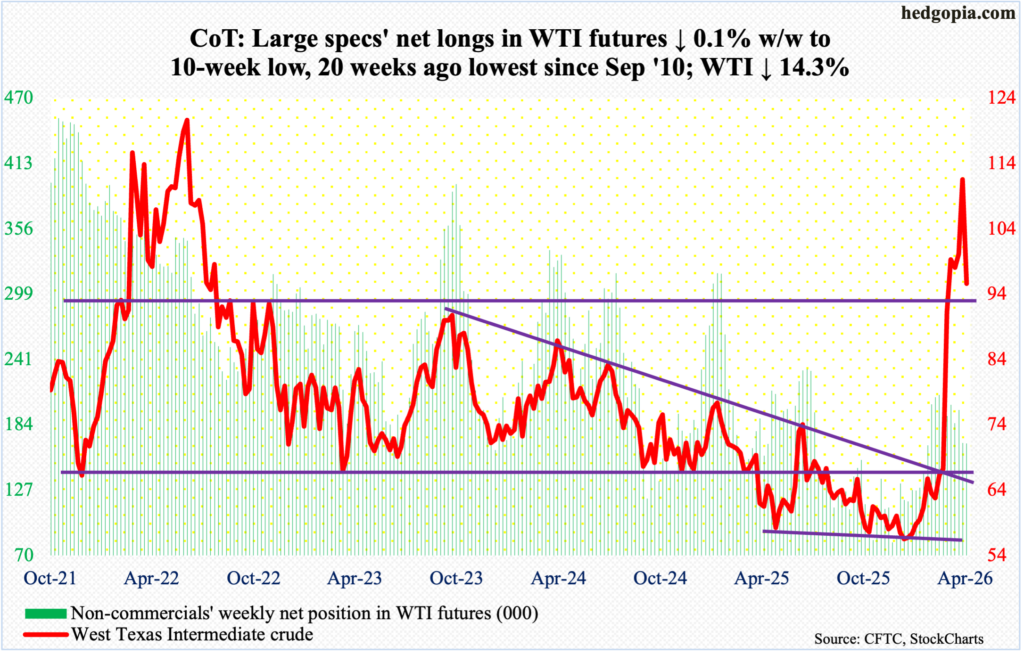
On March 9, West Texas Intermediate crude posted a four-year high $119.48 before finishing with a massive spinning top, touching $76.73 in the next session. This Tuesday, the crude came within $2 of that high but only to attract sellers, closing the session with a spinning top, which also showed up on Monday. By the end of the week, WTI was down 14.3 percent to $95.63/barrel.
The crude has had quite a move of late. As recently as February 26, it tagged $63.60; on the 28th, Israel and the US attacked Iran, and prices soared. In the process, $91-$92 has proven to generate trader interest; Wednesday’s session low $91.05 did attract some buying. After this lies the 50-day at $81.66 and the 200-day at $66.77.
That said, even if the war ends tomorrow, crude prices are likely to have a higher floor as demand for stockpiling goes up, not to mention a rise in insurance costs thanks to an upward pressure on geopolitical risk premium.
In the meantime, as per the EIA, US crude production in the week to April 3 dropped 61,000 barrels per day week-over-week to 13.596 million b/d; output registered a record 13.862 mb/d in the week to November 7 last year. Crude imports decreased 130,000 b/d to 6.3 mb/d. As did gasoline and distillate inventory, which respectively declined 1.6 million barrels and 3.1 million barrels to 239.3 million barrels and 114.7 million barrels. Stocks of crude increased 3.1 million barrels to 464.7 million barrels. Refinery utilization edged lower one-tenth of a percentage point to 92 percent.
E-mini S&P 500: Currently net short 45.7k, up 3.2k.
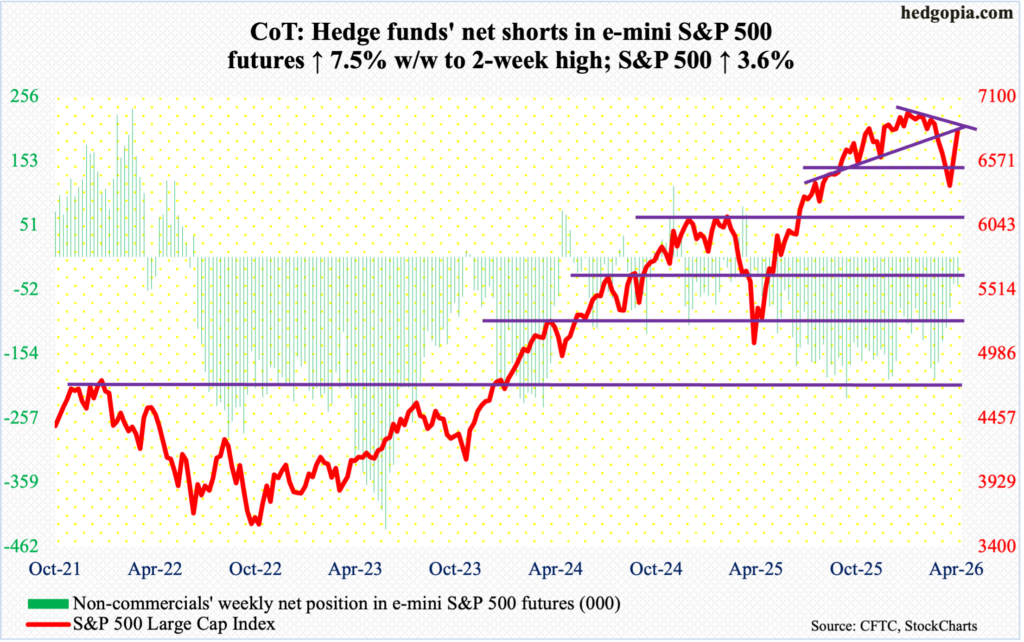
On the back of March 30 trough at 6317, equity bulls hurriedly accumulated more than 500 points on the S&P 500. After seven up sessions in a row, the large cap index ticked 6846 intraday Friday before reversing a tad to close at 6817, up 3.6 percent for the week. This follows last week’s gains of 3.4 percent.
Along the way, both the 200- and 50-day (6663 and 6762 respectively) have been reclaimed, but potentially bigger hurdles lie ahead. Friday’s high kissed the underside of a broken trendline from last August, while a falling trendline from January 28 when the index peaked at 7002 lies around 6860s. From that high through the March 30 low, the S&P 500 declined 9.9 percent, and three-fourths of that loss has already been recouped.
Arguably, the rally has come too far too fast, driving the daily conditions into overbought territory. New positions deserve caution.
Euro: Currently net short 7.5k, up 8k.
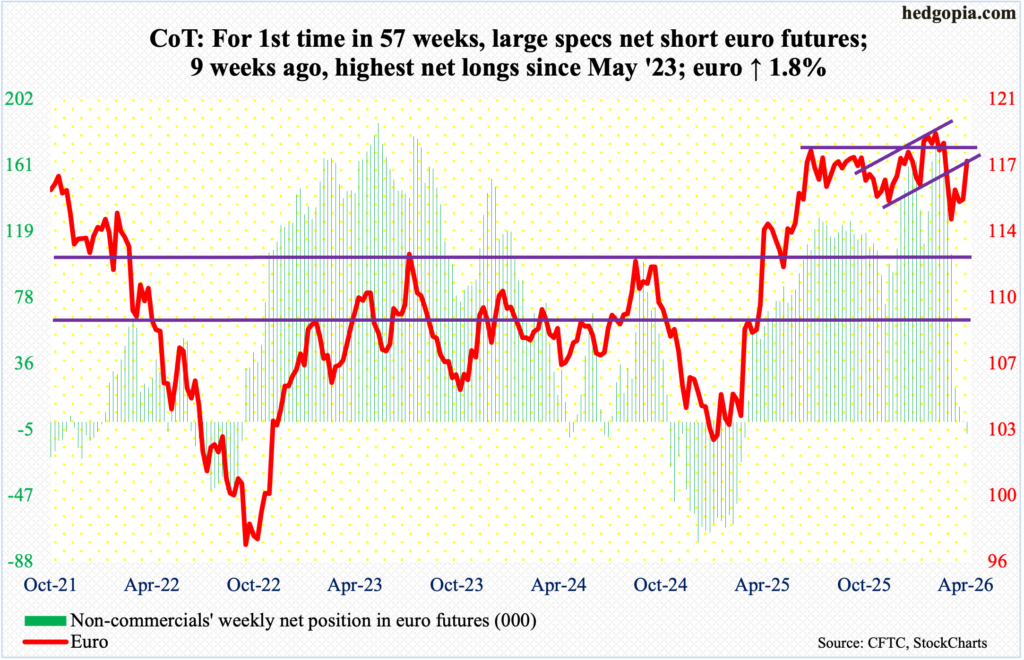
Just when non-commercials switched to net shorts, the euro rallied 1.8 percent this week to $1.172, reclaiming $1.15s. This was the first time in 13 months they have gone net short.
The currency otherwise had been under pressure since January 27 when it reversed lower after tagging a four-and-a-half-year high $1.208; in the week in which that reversal occurred, a weekly gravestone doji formed. In January last year, the currency bottomed at $1.018.
This week’s gains place the euro above both the 50- and 200-day ($1.168 and $1.167 respectively), with the averages on the verge of forming a death cross. Odds favor more strength in the sessions ahead.
There is decent horizontal resistance at $1.18s.
Gold: Currently net long 156.3k, down 6.9k.
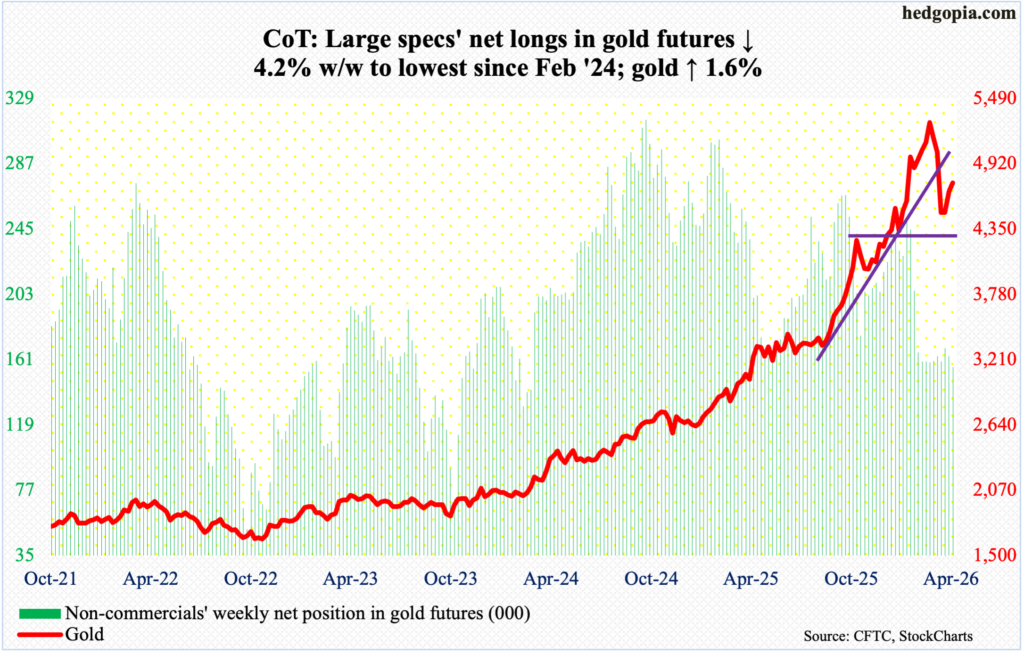
Up 1.6 percent for the week to $4,752/ounce, gold has now rallied for a third straight week. Earlier on March 23, it ticked $4,099 intraday to find support just above the 200-day (now $4,154). The metal has remained under the 50-day ($4,911) since March 18. On Wednesday, it rallied as high as $4,858 but gold bugs failed to hang on to it. The longer the yellow metal remains sandwiched between the averages, the higher the odds it will eventually gravitate toward the 200-day.
Horizontal support at $4,370s is key. Apart from March 23 when it was successfully tested, this support also drew buying interest on February 2; a couple of sessions before that on January 29, gold peaked at $5,608.
Before $4,370s gets tested, there is important straight-line support at $4,540s.
Nasdaq (mini): Currently net long 12.5k, down 8.1k.
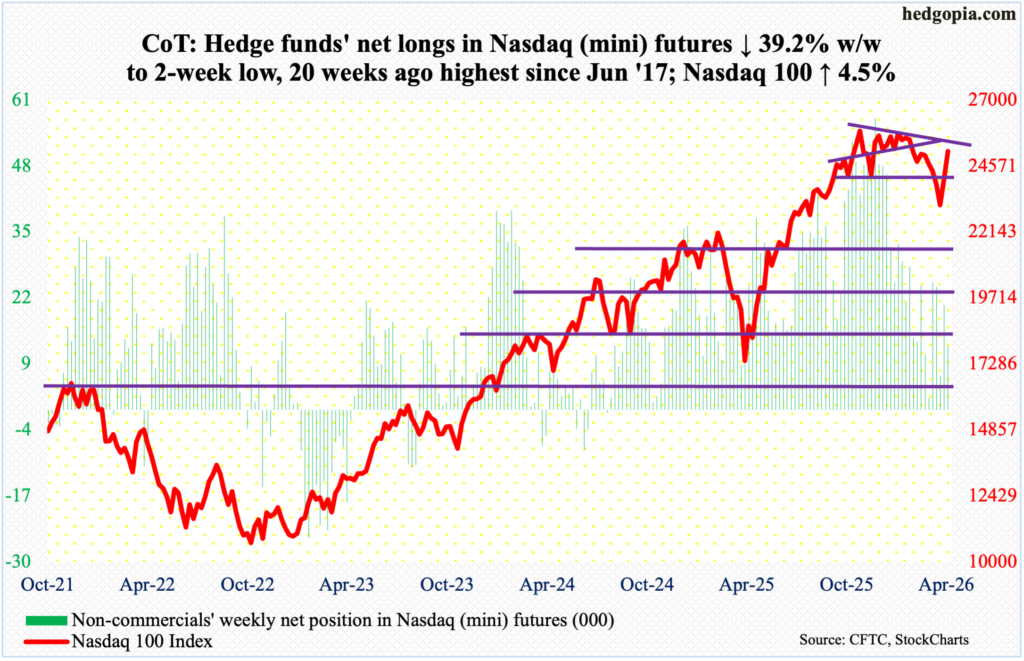
The Nasdaq 100 put up a strong performance for the second week running, up 4.5 percent this week and up four percent in the week before. This followed an intraday low of 22841 on March 30. Through that low, the tech-heavy index was down 12.8 percent from the all-time high 26182 recorded on October 29. This week, it closed at 25116, with a high of 25226 on Friday, finishing above both the 50- and 200-day (24684 and 24520 respectively).
Friday’s high just about kissed a falling trendline from the October peak. Earlier on January 28, bulls were rejected 17 points short of that high. As much as they would like to test those highs as soon as possible, the trendline resistance is likely to hold for now. Besides the above averages, decent straight-line support lies at 24400s.
Russell 2000 mini-index: Currently net short 14k, down 3.9k.
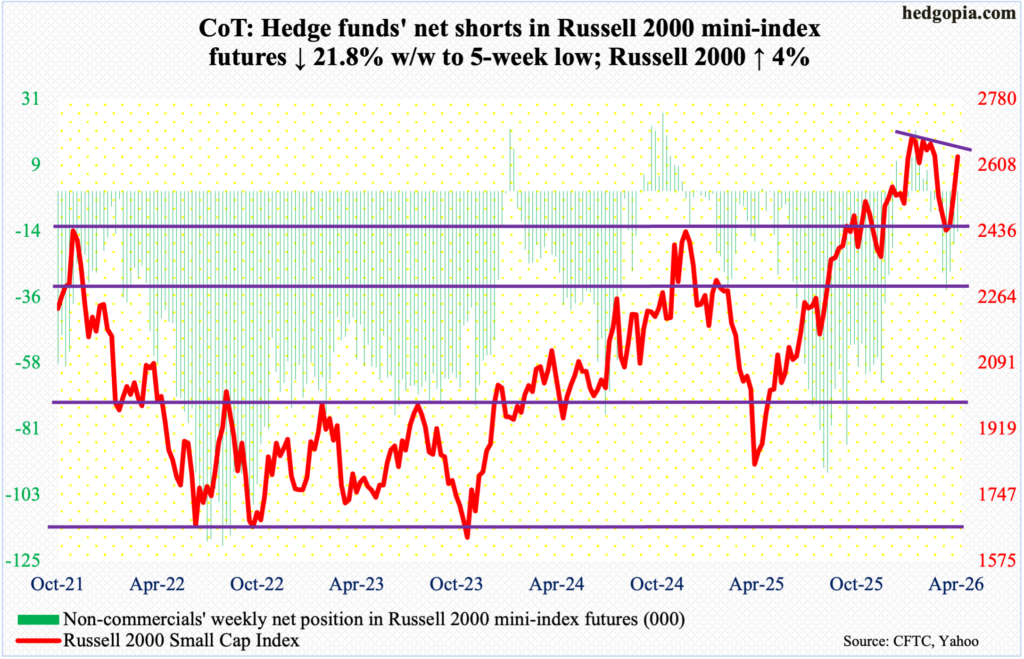
The Russell 2000 was not an exception in facing trendline resistance. Its four-percent rally this week follows gains of 3.3 percent last week. Crucially for small-cap bulls, horizontal resistance at 2540s, which had stood like a rock for four successive weeks, could no longer stop their advance, with the index closing at 2631.
The index peaked at 2735 on January 22, before making a series of lower highs. Thursday’s intraday high 2645 will constitute another lower high should the Russell 2000 retreat from here. There is decent change of this happening considering how extended daily conditions are. In this scenario, 2540s again will come into focus.
US Dollar Index: Currently net long 5.5k, up 1.8k.
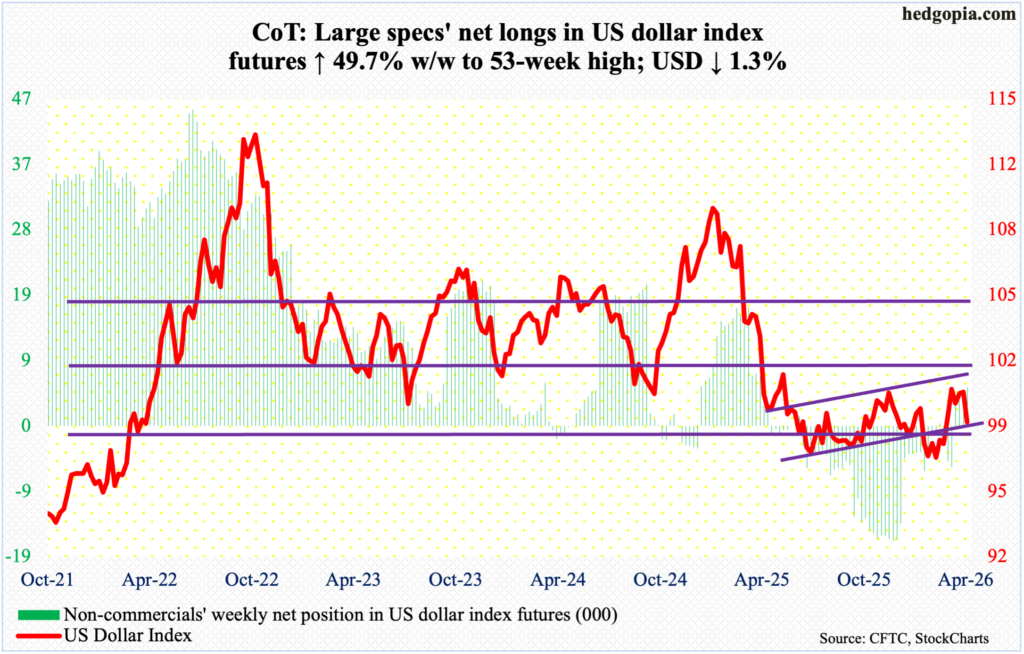
After several weeks of botched attempts to reclaim 100, dollar bulls gave up this week. The US dollar index gave back 1.3 percent to 98.70, with highs of 100.29 on Monday and 100.16 on Tuesday. This was the fifth week in a row the index straddled 100 or so, before coming under pressure. Resistance just north of 100 goes back more than a decade, and it was lost last April.
In January last year, after a three-plus-month rally, the US dollar index reversed hard at 110.18, subsequently reaching 96.38 in June and successfully testing that low with a lower low 96.22 in September. On January 27, another lower low 95.55 was ticked, and that drew bids, ending the week with a weekly dragonfly doji. The rally that followed has run out of steam, at least for now.
The index finished the week just above the 50- and 200-day (98.67 and 98.53 respectively). A breach of these averages opens the door to a test of 98, or just underneath.
VIX: Currently net short 20.4k, down 10.8k.
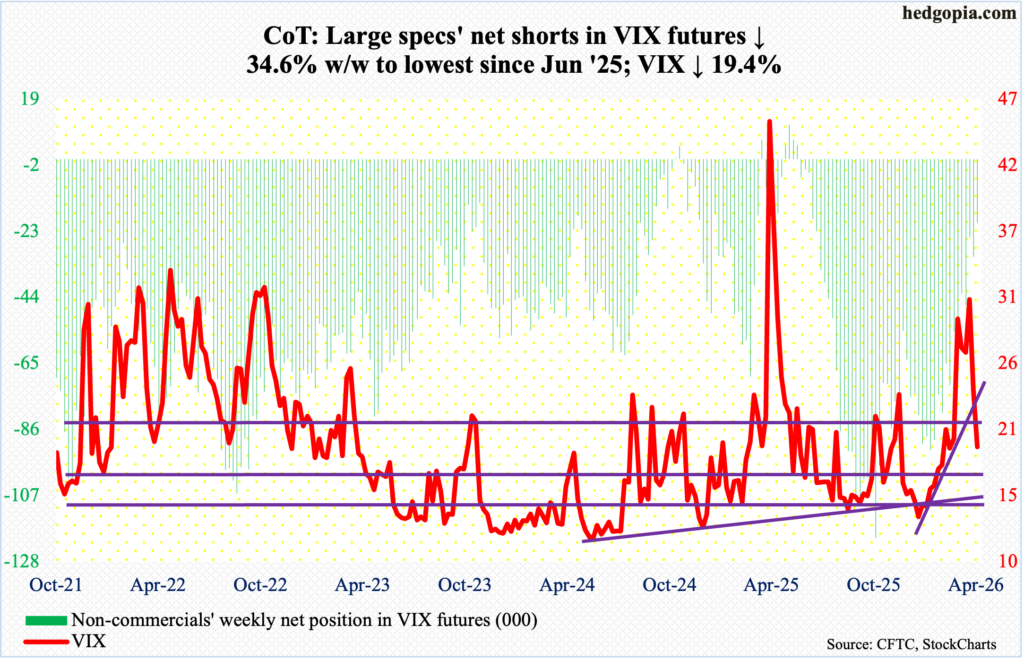
Non-commercials’ net shorts are now the lowest since last June. If past is prelude, VIX has shown a tendency to peak as these traders go net long or get close to doing that. It turns out the volatility index’s intraday high of 35.30 and close of 25.50 on March 9 was indeed a spike reversal. This week, it closed 4.64 points lower to 19.23.
Importantly for volatility bears – and equity bulls by extension – VIX this week breached a rising trendline from Christmas Eve when it ticked 13.38 intraday. It also dropped below the 50-day (22.37), but the 200-day (18.15) remains intact; a decisive loss of the latter will have significantly raised the odds for volatility bears.
Thanks for reading!
