
Following futures positions of non-commercials are as of April 14, 2026.
10-year note: Currently net short 800.4k, down 23.3k.
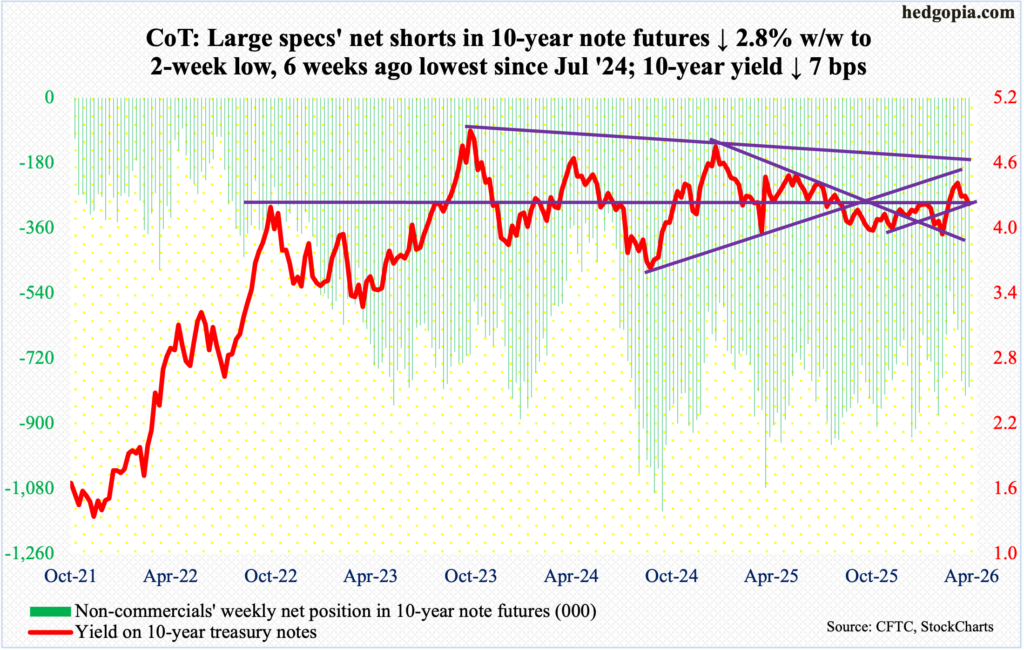
The 10-year treasury yield is back at testing crucial horizontal support at 4.20s. This week, it dropped seven basis points to 4.25 percent. Rates have been under pressure since March 27 when they tagged 4.48 percent. That high just about tested a falling trendline from October 2023 when the 10-year peaked at five percent. This hurdle is holding.
Earlier, the 10-year bottomed at 3.96 percent on February 27, with a similar bottom last October at 3.95 percent. The daily is itching to rally for now. But once 4.20s – also approximated by the 50- and 200-day moving averages (4.21 percent and 4.19 percent respectively) – give way, rates could very easily gravitate toward sub-four percent.
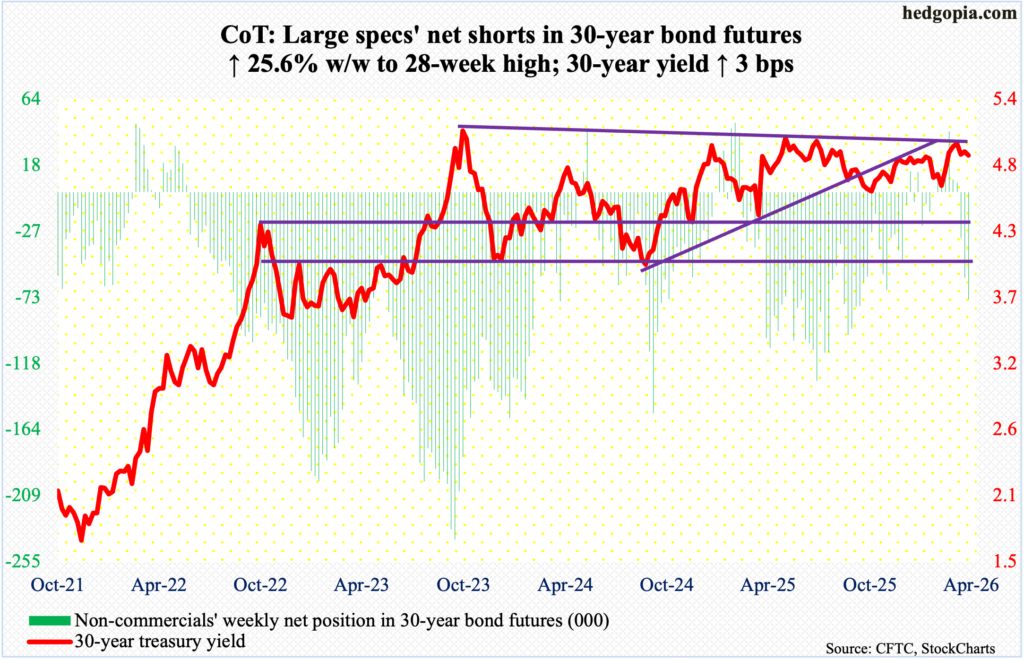
30-year bond: Currently net short 74.1k, up 15.1k.
Major US economic releases for next week are as follows.
Retail sales (March) are due out Tuesday. In February, sales increased 0.6 percent month over month to a seasonally adjusted annual rate of $738.4 billion, which set a record.
Friday brings University of Michigan’s consumer sentiment index (April, final). Preliminarily for the month, sentiment tumbled 5.7 points m/m to 47.6 – a record low.
WTI crude oil: Currently net long 177.5k, up 9.3k.
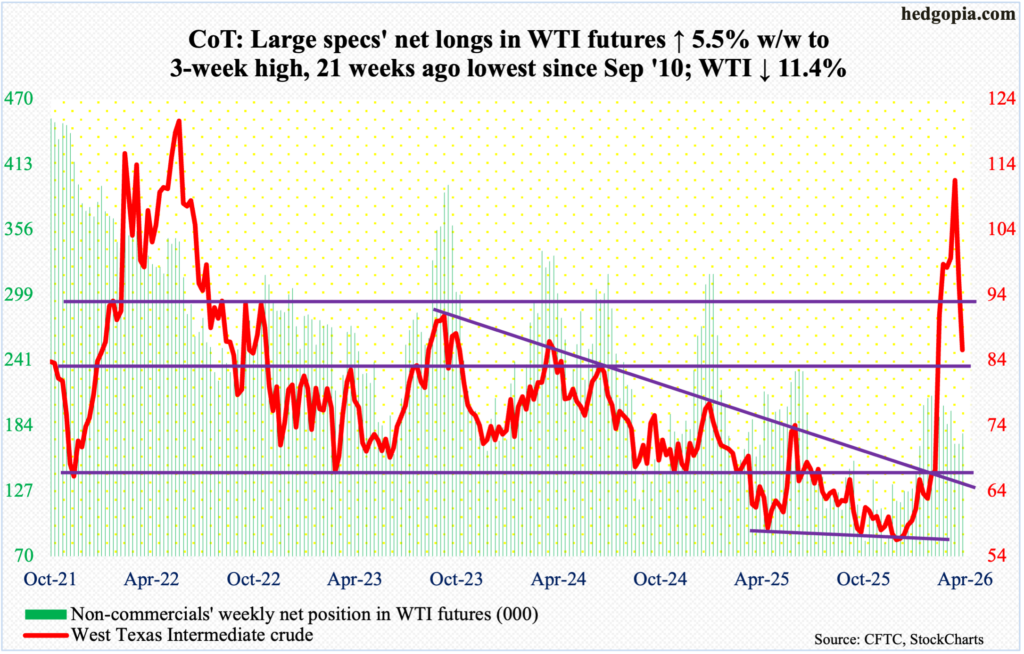
Amidst a flurry of news related to the closure/opening of the Strait of Hormuz – some favoring oil bulls, some others the bears – West Texas Intermediate crude continued to come under pressure this week, giving back 11.4 percent to $85.57/barrel, which is now substantially lower than the four-year high $119.48 ticked on March 9.
On February 27 – a day before Israel and the US attacked Iran – the crude tagged $64.85 intraday before exploding higher in the subsequent sessions. This week, longs were unable to defend $91-$92, essentially closing at horizontal support at $86-plus. The 50-day rests at $84.49. After this, there is straight-line support at $78.
With all that said, even if the war ends tomorrow, crude prices are likely to have a higher floor as demand for stockpiling goes up, not to mention a rise in insurance costs thanks to an upward pressure on geopolitical risk premium.
In the meantime, as per the EIA, US crude production in the week to April 10 was unchanged week over week at 13.596 million barrels per day; output registered a record 13.862 mb/d in the week to November 7 last year. Crude imports decreased one mb/d to 5.3 mb/d. As did stocks of crude, gasoline, and distillates, which respectively declined 913,000 barrels, 6.3 million barrels and 3.1 million barrels to 463.8 million barrels, 232.9 million barrels and 111.6 million barrels. Refinery utilization decreased 2.4 percentage points to 89.6 percent.
E-mini S&P 500: Currently net short 115.8k, up 70.1k.
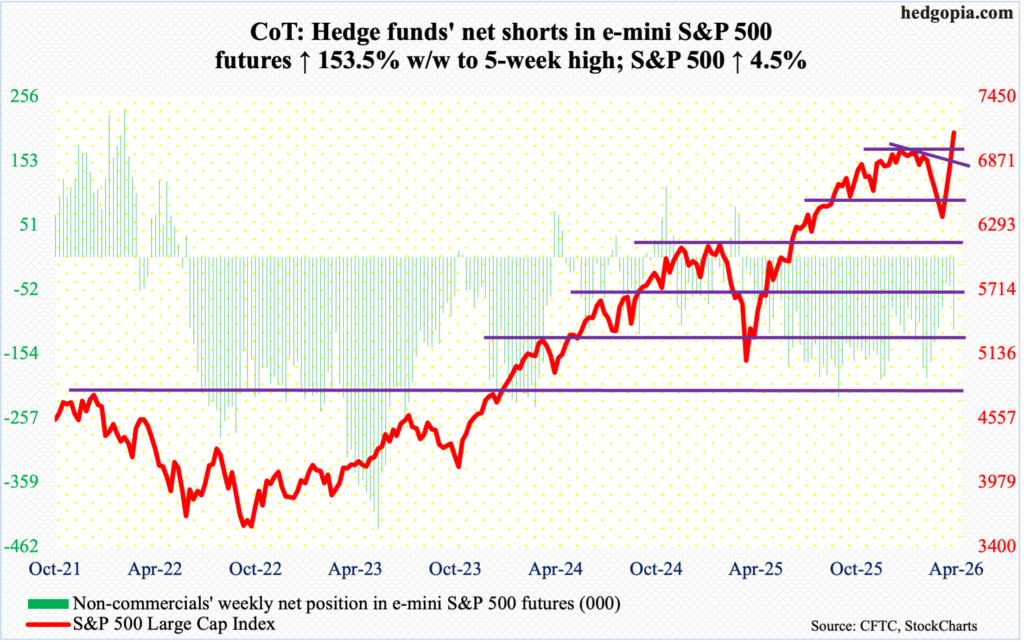
It took 43 trading sessions to drop 9.8 percent between the intraday high and low of 7002 and 6317 posted on January 29 and March 30 respectively. It then took merely 14 sessions from that low to not only erase that loss but also establish a new high, gaining 13.1 percent through Friday’s intraday high of 7148.
For the week, the S&P 500 increased 4.5 percent to a close of 7126, coming on the heels of gains of 3.6 percent last week and 3.4 percent in the week before; over the last 13 sessions, there has only been one down session. A combination of short squeeze, fear of missing out, rising hopes of imminent resolution to the Iran conflict, and the ongoing earnings season has contributed to a rally that even the most ardent of bulls must be wondering if this can be sustained.
Along the way, both the 200- and 50-day (6684 and 6769 respectively) have been reclaimed. Not surprisingly, the daily RSI has crossed 70, closing at 73.2; this is the first time since last October this metric has exceeded 70.
Bulls need a pause here. A successful breakout retest just north of 7000 bodes well for more strength.
Euro: Currently net long 26k, up 33.6k.
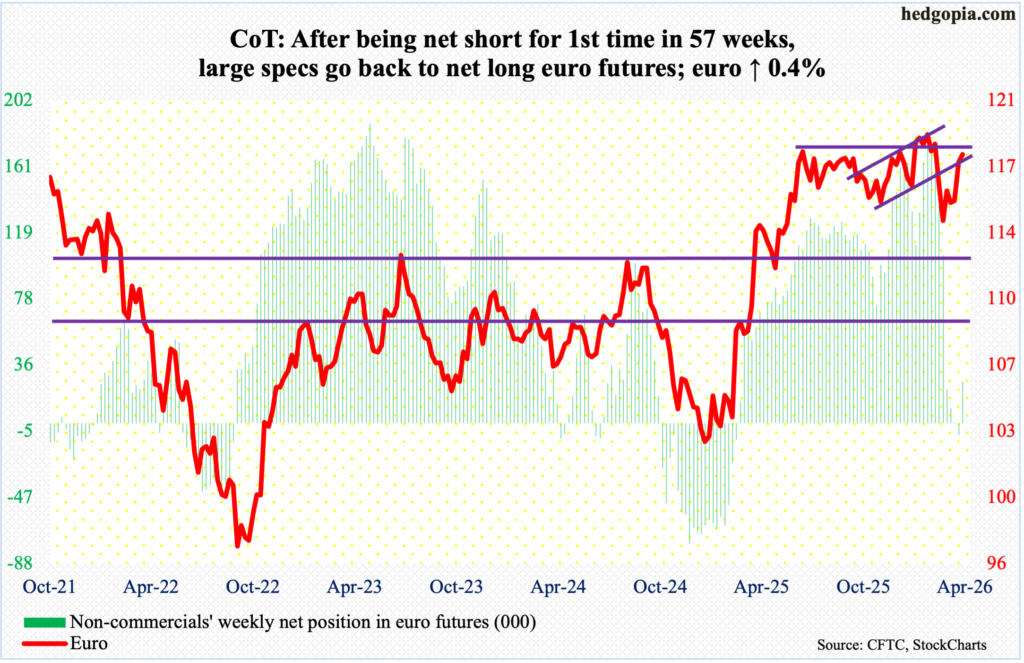
Euro bulls went after it but were unable to push through horizontal resistance at $1.18s. This week, the euro rose 0.35 percent to $1.176 but not before ticking $1.185 intraday Friday. This was the third straight week of gains, having rallied in four of the last five.
On March 13, the currency bottomed at $1.141. Before that, it had been under pressure since January 27 when it reversed lower after tagging a four-and-a-half-year high $1.208; in the week that reversal occurred, a weekly gravestone doji formed. In January last year, the euro bottomed at $1.018.
As things stand, the path of least resistance is a downward move toward the 50- and 200-day, which at $1.167 and $1.168 have converged.
Gold: Currently net long 162.5k, up 6.2k.
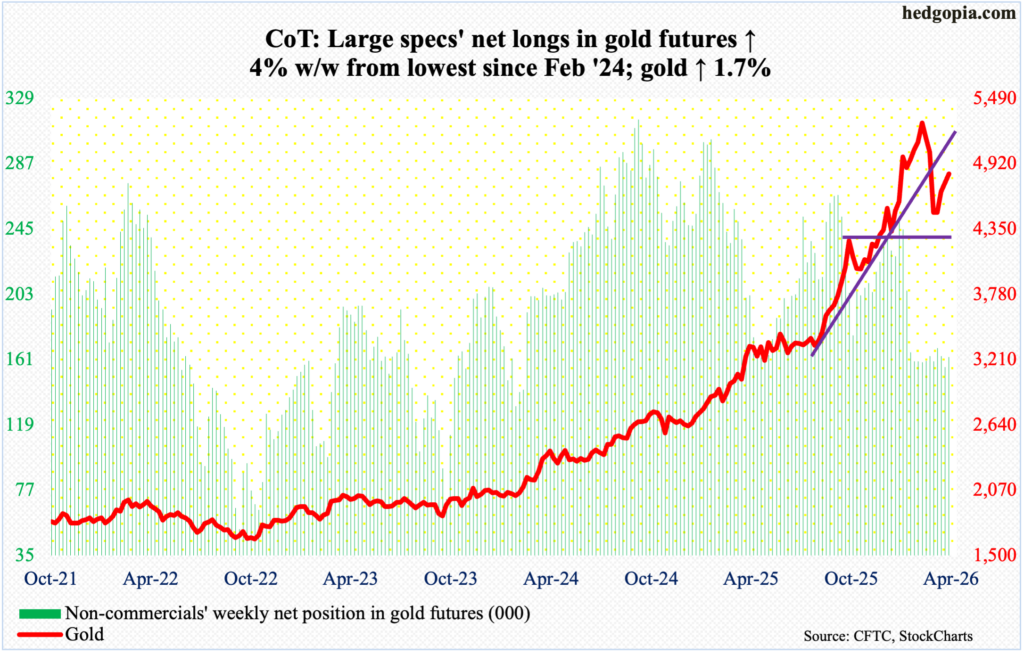
Gold continues its upward journey, although it remains significantly below the all-time high $5,608 reached on January 29. This week, it rose 1.7 percent to $4,834/ounce. This was the fourth weekly advance in a row.
Earlier on March 23, the metal bottomed at $4,099 intraday to find support just above the 200-day (now $4,191); this essentially was a test of horizontal support at $4,370s.
Throughout this week, the yellow metal hung out just underneath the 50-day ($4,895), with Friday having ticked $4,892 intraday. Gold has not closed above the average since March 18, and this is unlikely to change in the sessions ahead.
Before $4,370s get tested, there is important straight-line support at $4,540s.
Nasdaq (mini): Currently net long 10.8k, down 1.7k.
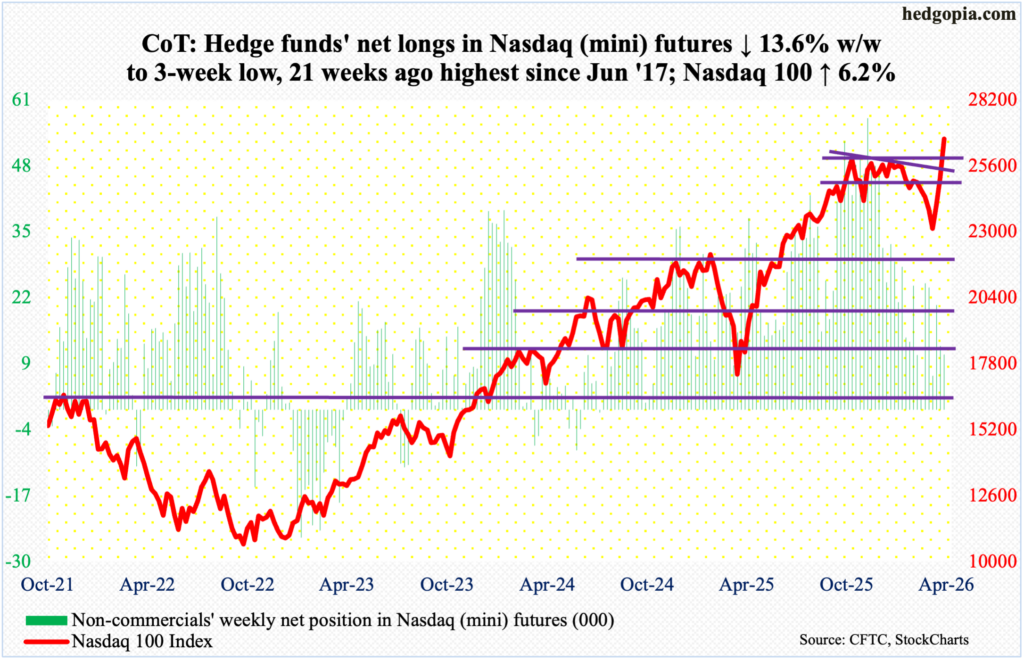
Tech bulls enjoyed a breakout this week, firmly denying the bears of a chance of a double top. On October 29, the Nasdaq 100 ticked 26182 before reversing lower. Then on January 28, bulls were rejected 17 points short of that high, following which the tech-heavy index proceeded to tumble 12.8 percent through the intraday low of 22841 posted on March 30. From that low through Friday’s intraday high of 26720, it has shot up 17 percent, rallying for 13 consecutive sessions – its longest winning streak since 2013. This week, it shot up 6.2 percent to 26672.
The index, which is weighted by market cap, has gone from oversold to overbought in no time. Of the Magnificent 7, which has had its share of gains in recent sessions, Tesla (TSLA) reports its March quarter next Wednesday, even as Microsoft (MSFT), Google parent Alphabet (GOOG), Apple (AAPL), Amazon (AMZN) and Facebook parent Meta (META) all report the week after, while Nvidia (NVDA) does not report its April quarter until May. Next week could very well attract sellers ahead of results from the five majors. Breakout retest at 26100s is key.
Russell 2000 mini-index: Currently net short 9.3k, down 4.6k.
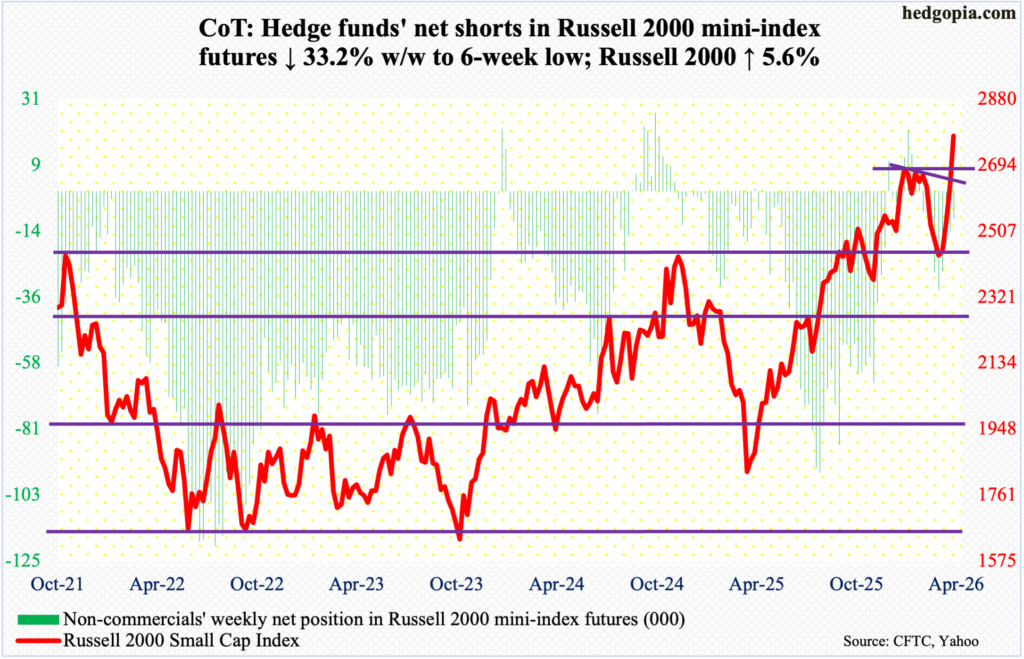
Last week, the Russell 2000 closed right at a falling trendline from January 22 when it peaked at 2735. This week, the resistance is no more, with the index breaking cleanly out of it to set a new intraday high of 2793 on Friday.
For the week, the small cap index jumped 5.6 percent to 2777. Last week, the index decisively took care of horizontal resistance at 2540s, which had stood like a rock for four successive weeks.
Small-cap bulls will need to step up and defend breakout retest at 2730s. The test likely occurs soon.
US Dollar Index: Currently net long 5.2k, down 341.
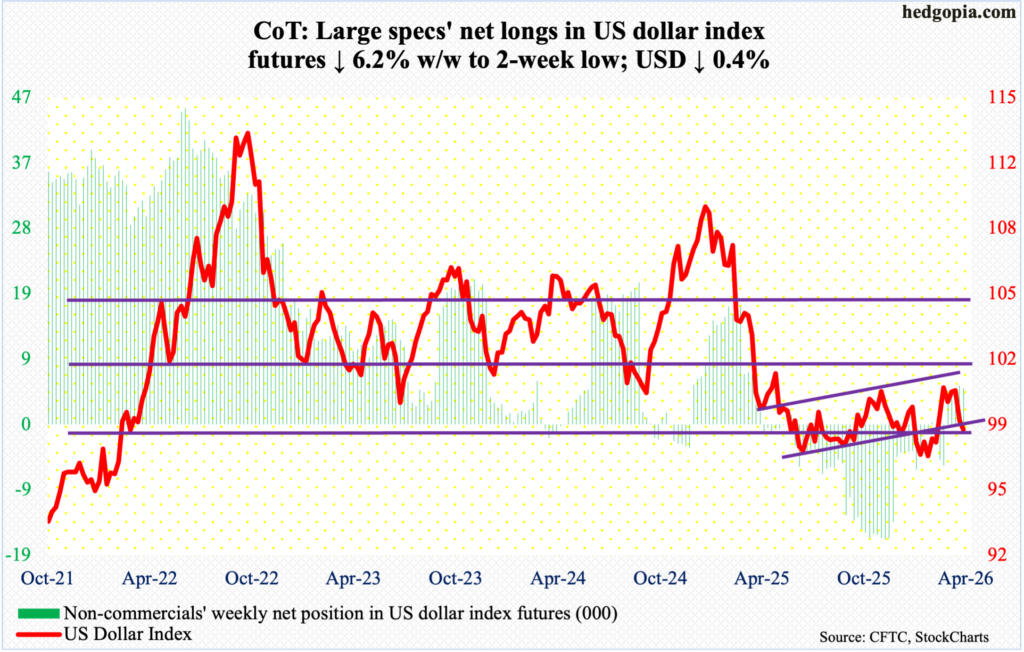
The US dollar index opened the week with Monday’s breach of both the 50- and 200-day (98.72 and 98.54 respectively); it had been above the averages since March 2. When it was all said and done, it fell 0.4 percent for the week to 98.42 – its third weekly decline in a row and fourth in five.
This week’s action followed last week when dollar bulls gave up trying to reclaim 100, which they kept attacking for five weeks, including March 30 when an intraday high of 100.64 was hit intraday. Resistance just north of 100 goes back more than a decade, and it was lost last April.
Earlier, in January last year, after a three-plus-month rally, the US dollar index reversed hard at 110.18, subsequently reaching 96.38 in June and successfully testing that low with a lower low 96.22 in September. On 27 January this year, another lower low 95.55 was ticked, and that drew bids, ending the week with a weekly dragonfly doji.
For now, dollar bulls should like the fact that lateral support at 97.70s drew bids on Friday. Near-term, they are likely to go after the 50- and 200-day, and even 99.20s in the best of circumstances.
VIX: Currently net short 24.3k, up 3.9k.
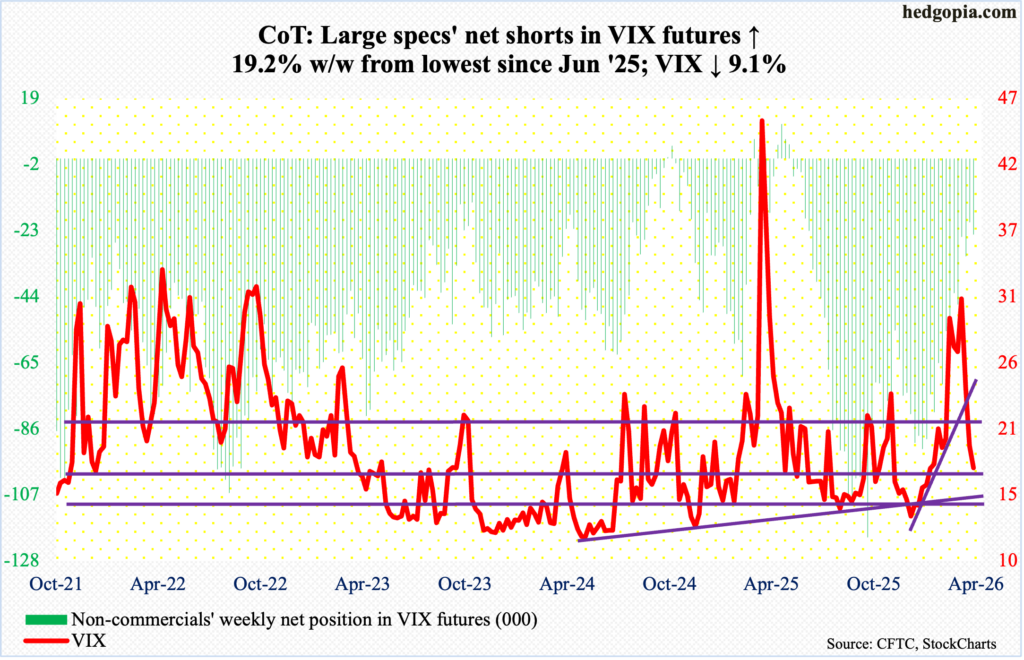
Last week’s breach of trendline support from Christmas Eve when VIX ticked 13.38 intraday proved costly as it went on to lose 1.75 points this week to 17.48. This was the third weekly drop in succession – and fourth in five.
On March 9, VIX experienced a spike reversal as it hit an intraday high of 35.30 but only to close at 25.50. last week, the 50-day (22.45) was compromised, and this week the 200-day (18.18). The daily is extremely oversold. If volatility does not stabilize soon, risk remains of an eventual test around 16 of trendline support from May 2024.
Thanks for reading!
