
Following futures positions of non-commercials are as of May 12, 2026.
10-year note: Currently net short 781.2k, down 34.1k.
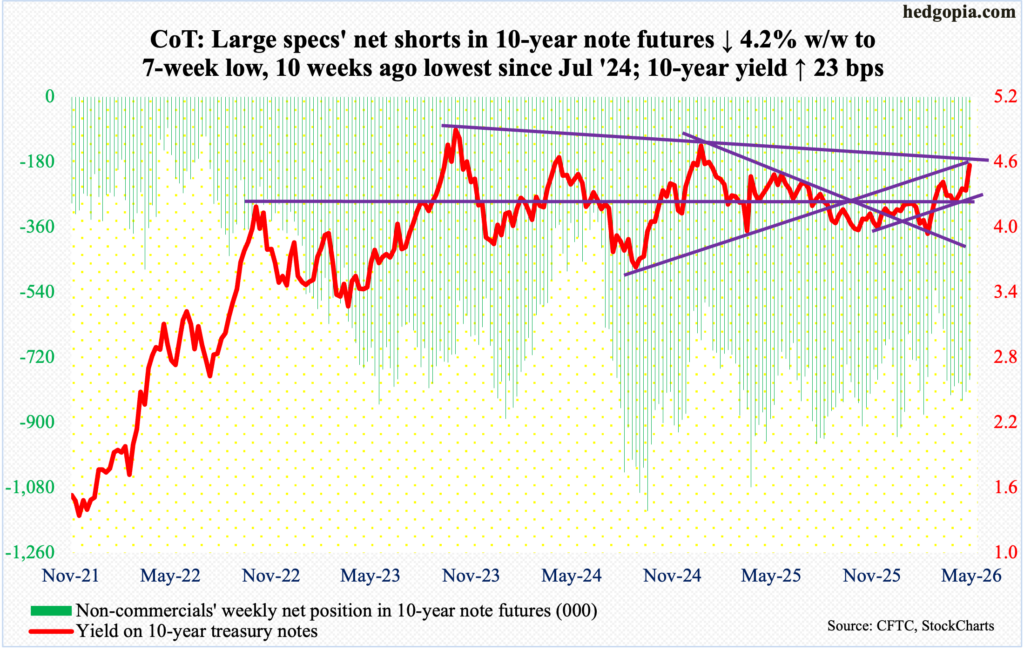
Minutes for the April 28-29 FOMC meeting will be out next Wednesday. The policy-setting body left the fed funds rate unchanged at a target of 350 basis points to 375 basis points. The last time the benchmark rates were changed was last December when they were reduced by 25 basis points; this preceded a cut of similar magnitude in both September and October. Earlier, the fed funds rate reached a cycle high 525 basis points-550 basis points in July 2023, followed by cumulative cuts of 100 basis points over three meetings in 2024.
There was a time when markets were convinced the easing cycle would resume this year, expecting a minimum of two cuts, followed by more next year. Fast forward to now, the CME’s FedWatch tool is not pricing in a cut this year or at least until July next year. As a matter of fact, these traders are betting with more than 50 percent probability that there would be a hike by this December’s meeting. The war with Iran, and the resultant jump in energy prices, has thrown a curve ball into the rates outlook.
At the April FOMC press conference, Jerome Powell, the erstwhile Federal Reserve chair, said that “in the near term, higher energy prices will push up overall inflation.” This week, both consumer and wholesale prices in April surprised on the upside. On a headline and core basis, the CPI (consumer price index) in particular rose 3.8 percent and 2.8 percent in the 12 months to April, with the former at a 35-month high and the latter the highest since last September. Kevin Warsh, who took over the central bank on Friday, has a tough nut to crack.
It is no surprise that President Donald Trump wants lower rates. If Warsh leans dovish, he is likely to face stiff opposition. At the April meeting, there were four dissents, which has not happened since October 1992. Stephen Miran, who joined the seven-member Board last September and resigned this week to clear the way for Warsh, wanted a 25-basis-point reduction. The other three dissenters were all regional bank presidents – Neel Kashkari (Minneapolis Fed), Beth Hammack (Cleveland) and Lorie Logan (Dallas) – agreed with the decision to keep the rates steady but dissented over the inclusion of an easing bias in the FOMC statement.
Next week’s FOMC statement can throw more light on this.
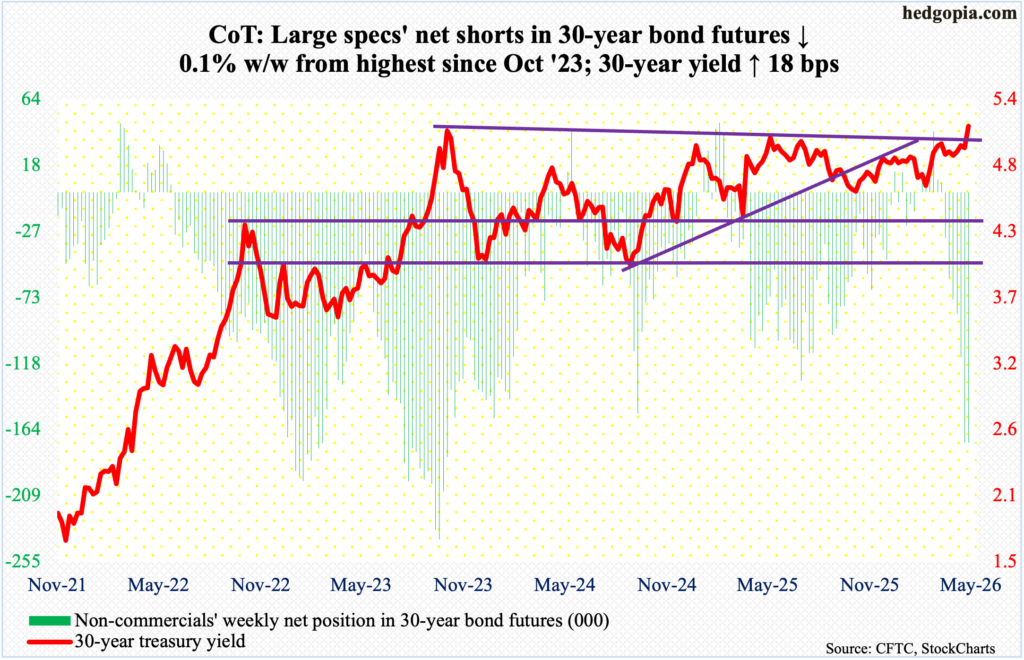
30-year bond: Currently net short 172.9k, down 88.
Major US economic releases for next week are as follows.
Housing starts (April) will be published Thursday. March starts jumped 10.8 percent month over month to a seasonally adjusted annual rate of 1.5 million units – a 15-month high.
Friday brings University of Michigan’s consumer sentiment index (May, final). This month’s preliminary count showed sentiment dropped 1.6 points m/m to a new low 48.2.
WTI crude oil: Currently net long 128.4k, down 16.3k.
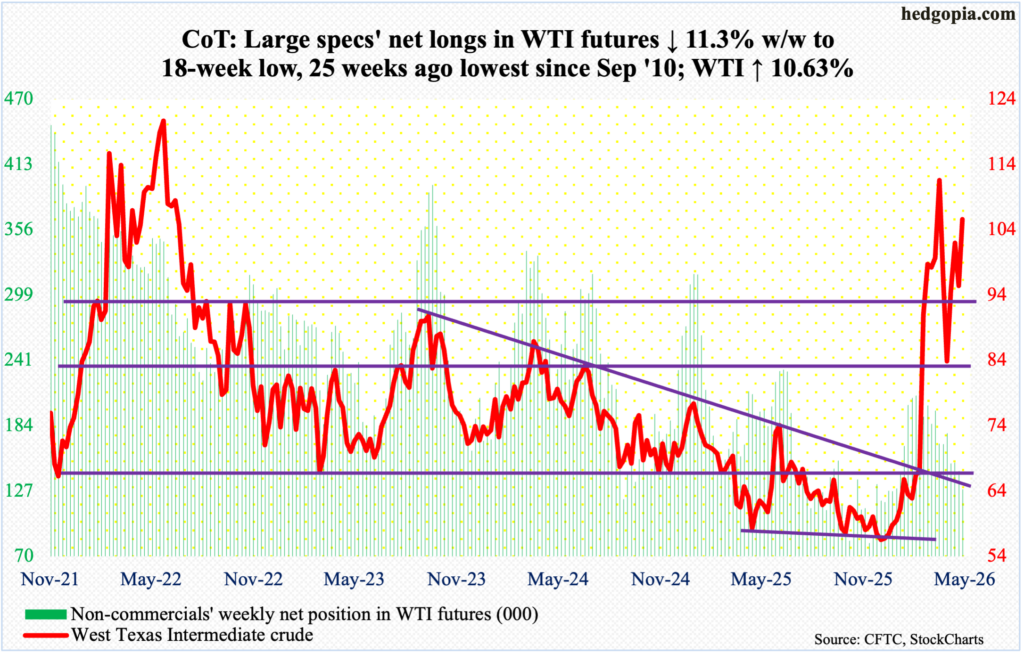
West Texas Intermediate crude has remained above the 50-day since early January. On an intraday basis, oil bears pushed it under the average in the latter three sessions last week but were unable to close it there. This week, the crude rallied all along the rising average, adding 10.6 percent to $105.56/barrel. This was the third up week in four.
Earlier, WTI tagged a four-year high $119.48 on March 9, before setting a lower high $117.63 on April 7, followed by $110.93 on the 30th. This week’s high of $106 was set on Friday. The trendline in question gets tested at $108, which likely happens next week. A breakout has the potential to add a new lease of life to the recent momentum.
On February 27 – a day before Israel and the US attacked Iran – WTI tagged $64.85 intraday before exploding higher in the subsequent sessions. There is important horizontal support at $91-$92.
In the meantime, as per the EIA, US crude production in the week to May 8 increased 137,000 barrels per day week over week to 13.710 million b/d; output registered a record 13.862 mb/d in the week to November 7 last year. Crude imports, too, rose, up 424,000 b/d to 5.9 mb/d. As did stocks of distillates, which grew 190,000 barrels to 102.5 million barrels. Crude and gasoline inventory went the other way – down 4.3 million barrels and 4.1 million barrels respectively to 452.9 million barrels and 215.7 million barrels. Refinery utilization rose 1.6 percentage points to 91.7 percent.
E-mini S&P 500: Currently net short 143.8k, up 40k.
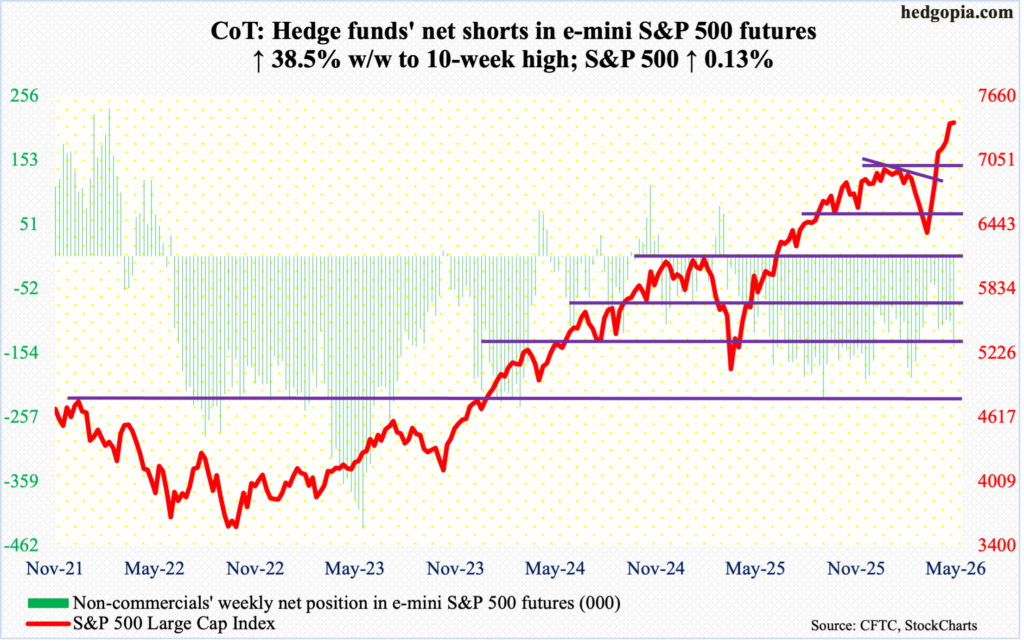
After six consecutive up weeks, the week picked up where it left off. Tuesday’s intraday drop to 7339 was feverishly bought, forming what looked like a hanging man candle. By Thursday’s intraday high 7517, the S&P 500 was up 1.6 percent for the week. Come Friday, and the 1.2-percent decline the session suffered, bulls were clearly on the defensive. For the week, the large cap index managed to eke out a gain of 0.1 percent to 7409.
The S&P 500 earlier bottomed at 6317 on March 30. Through Thursday’s high, it was up 19 percent from that low. More selling likely follows in the sessions ahead. The daily RSI, which peaked just south of 80 on Thursday, just fell below 70 and has a long way to go on the downside before the overbought condition it was in is unwound.
The levels to watch include 7270s, which would also have filled the gap from the 6th, and then 7140s, followed by the all-important breakout retest just north of 7000.
Euro: Currently net long 40.2k, up 8k.
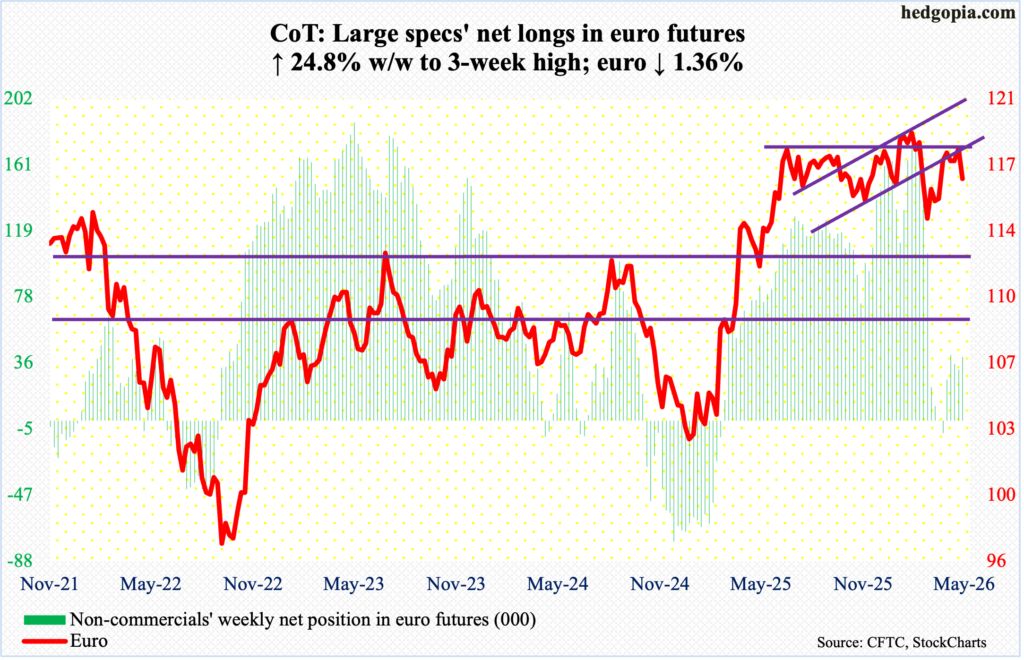
At long last, euro bulls failed to penetrate horizontal resistance at $1.18. For a year now, the euro has played ping pong between $1.14 and $1.18, with a four-and-a-half-year high $1.2083 posted on January 27. On March 13, it bottomed at $1.141.
This week’s high of $1.179 was set on Monday. Before this, $1.18 had denied the bulls for four straight weeks. When it was all said and done, the week ended down 1.4 percent to $1.163, slicing through both the 200- and 50-day (respectively $1.168 and $1.165).
In due course, $1.14 likely acts as a magnet.
Gold: Currently net long 171.6k, up 8.3k.
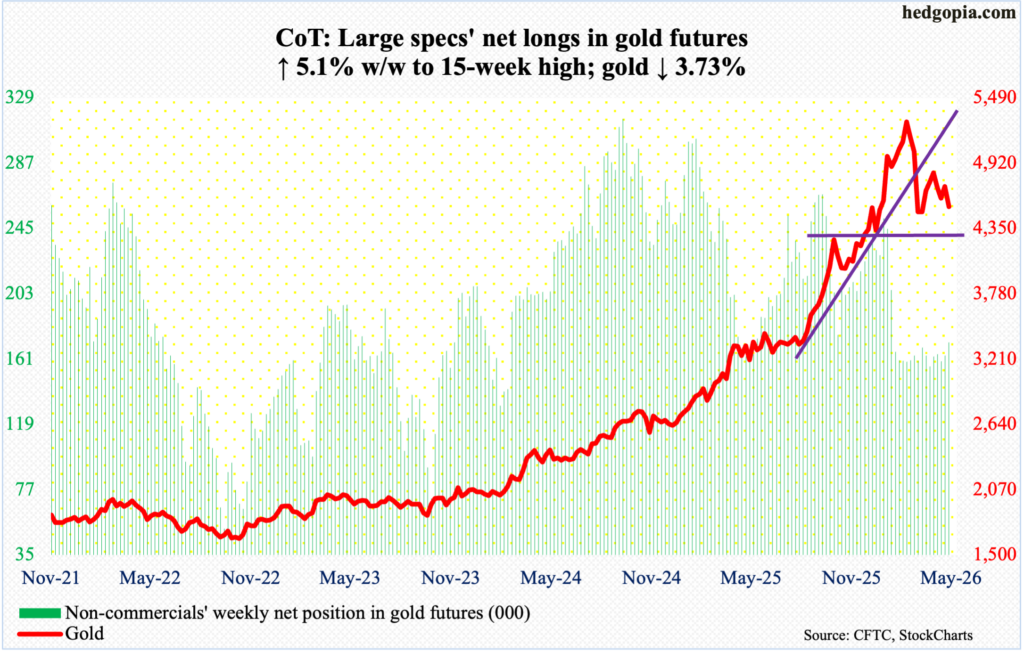
Gold has remained sandwiched between the 50- and 200-day ($4,730 and $4,323 respectively) since dropping out of the former on March 18; three sessions after that on the 23rd, it bottomed at $4,099 just above the latter.
For four consecutive sessions through Tuesday this week, the metal was rejected at the 50-day, and this was followed by selling in the remaining three sessions, ending the week lower 3.7 percent to $4,540/ounce.
Earlier, gold’s all-time high was registered on January 29 at $5,608, before making lower highs, including $5,419 on March 2 and $4,892 on April 17. Tuesday’s intraday high of $4,774 can be viewed as another lower high.
As things stand, the 200-day is the path of least resistance.
Nasdaq (mini): Currently net short 16k, up 17.2k.
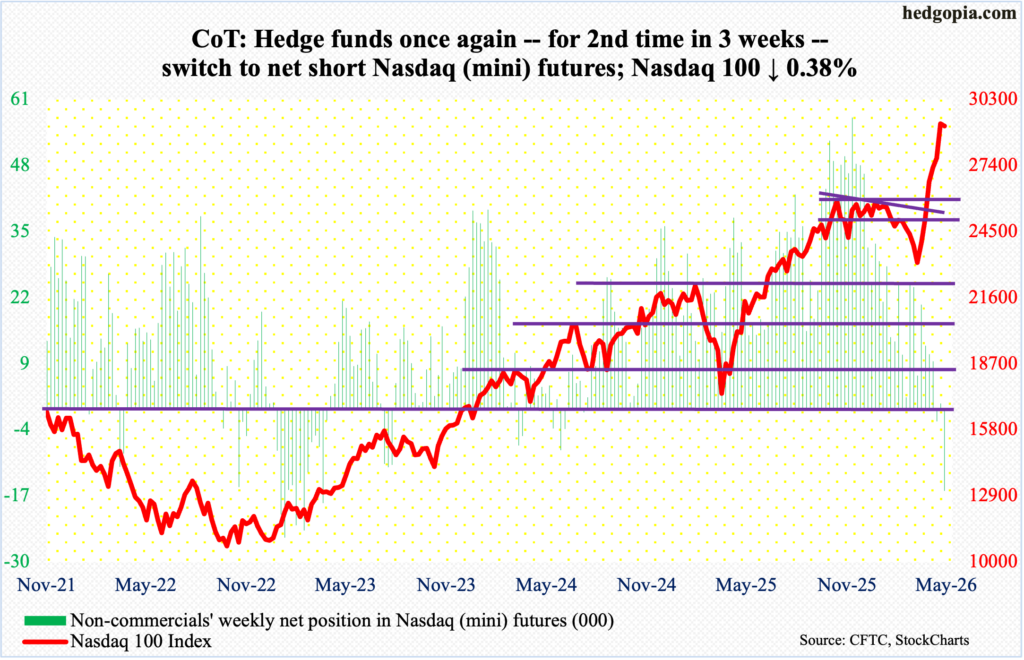
Tech bears finally halted a streak of six up weeks. The Nasdaq 100 gave back 0.4 percent this week to 29125, although bulls were sitting pretty for another up week until the last session. Through Thursday’s fresh intraday high of 29679, the tech-heavy index was up 1.5 percent, before reversing lower on Friday, ending with a weekly spinning top.
This was the first down week since March 30 when the Nasdaq 100 bottomed at 22841, proceeding to rally 29.9 percent through Thursday’s high.
Before this week’s minor selling, the weekly RSI (73.21) had just entered the 70s; in the recent past, anytime this happened, digestion followed. We are probably in the midst of one. There is major breakout retest at 26100s.
Russell 2000 mini-index: Currently net short 13.1k, up 4k.
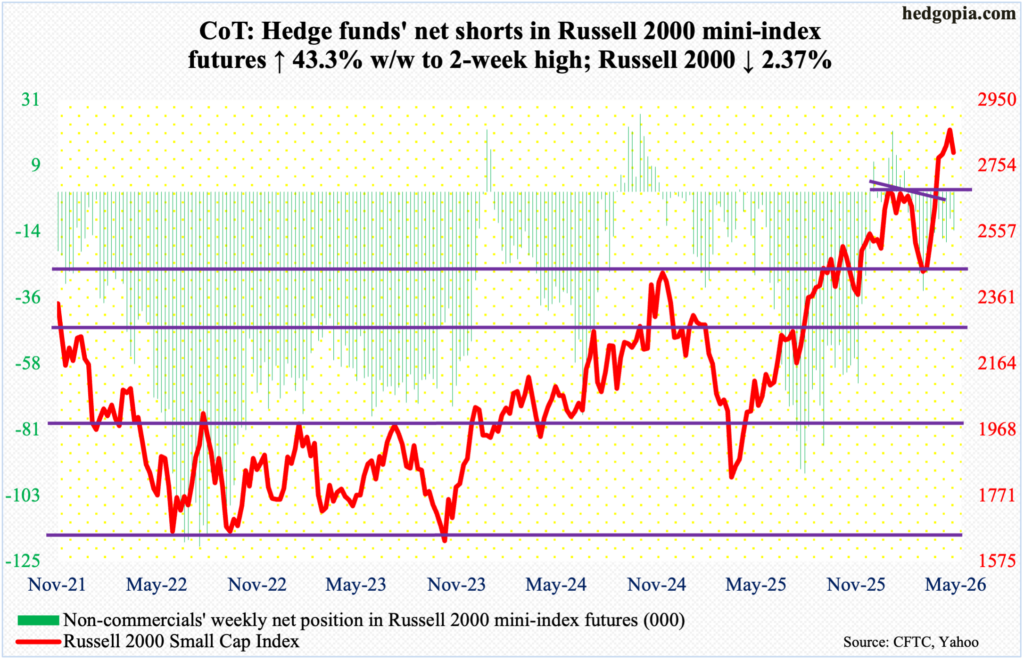
As was the case with the Nasdaq 100, small-caps, too, experienced the first down week in seven. The Russell 2000 this week declined 2.4 percent to 2793. The week, however, began with continued positive momentum, with Monday ticking 2888, just a point short of the all-time high of 2889 from three trading sessions prior.
Interestingly, bears last week had failed to cash in on a couple of potentially bearish weekly candles – a hanging man three weeks ago and a spinning top before that. Last week’s candle on the surface looked to have invalidated those two candles. This week’s action has only muddied the waters more, with the bears deserving the benefit of the doubt.
On January 27, the Russell 2000 peaked at 2735 – a level that was reclaimed five weeks ago, followed by a successful retest three weeks ago. This level is a make-or-break for both bulls and bears, and a test is imminent.
US Dollar Index: Currently net long 3.2k, up 2.5k.
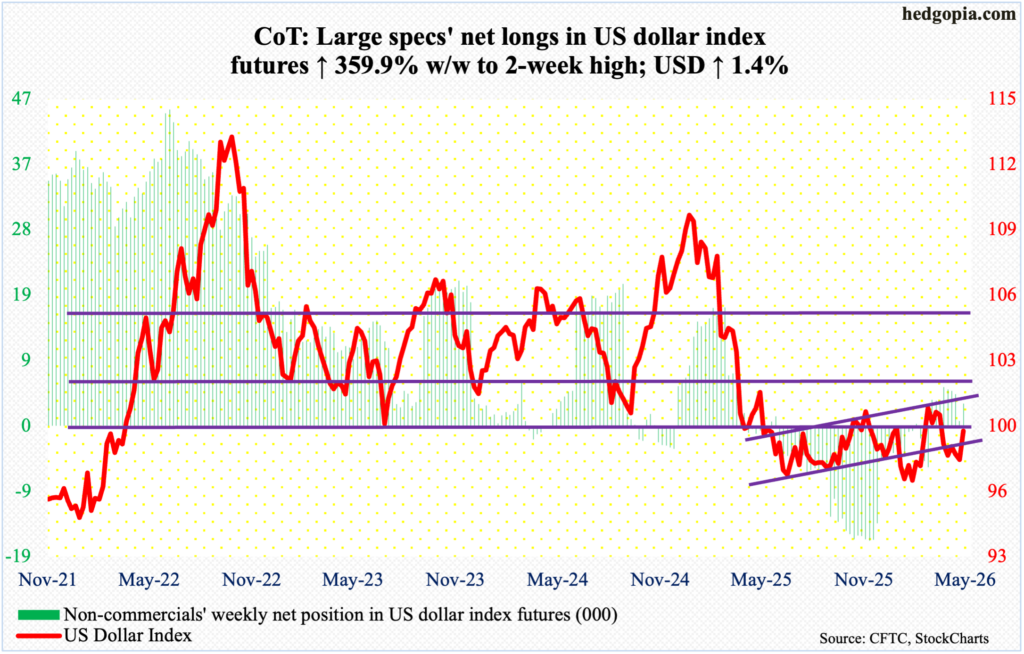
Having come perilously close to breaking support at 97.70s, dollar bulls got their act together this week, rallying the US dollar index 1.4 percent to 99.27, with an intraday high of 99.32 on Friday. With this, both the 50- and 200-day (98.99 and 98.54 respectively) have been reclaimed.
Bulls at this point will naturally go after 100, the significance of which goes back more than a decade, and which was lost in April last year. More recently, after unsuccessfully trying for five weeks to reclaim 100, including March 31 when an intraday high of 100.64 was hit intraday, dollar bulls gave up trying five weeks ago. They will have another crack at it in the sessions ahead.
VIX: Currently net short 49k, up 24.3k.
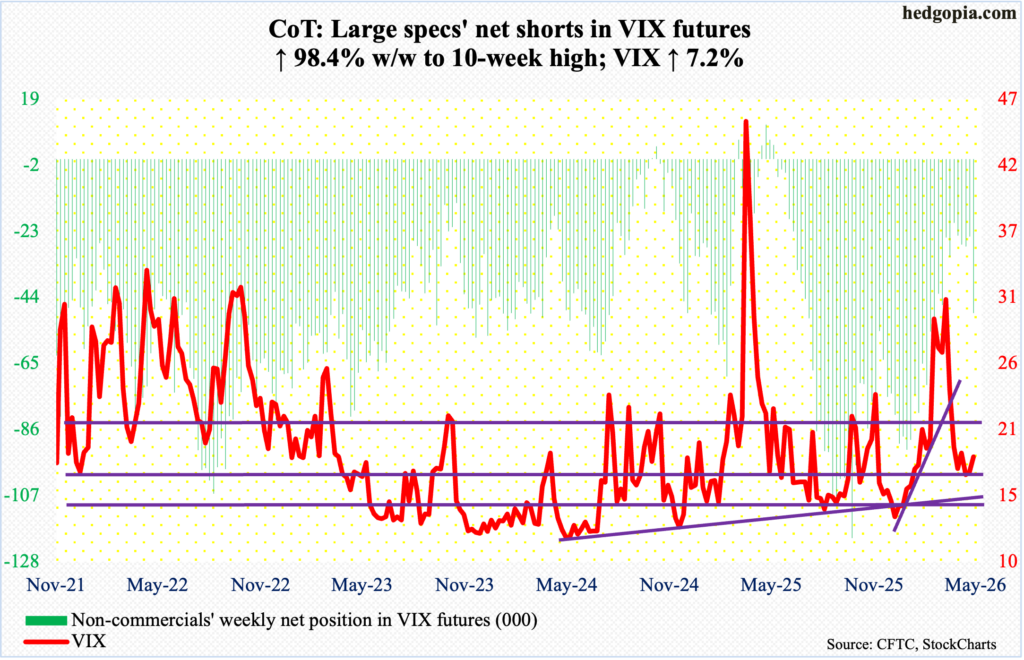
This was the second week in a row in which both volatility and the S&P 500 went hand in hand. This is rare, as VIX and the S&P 500 tend to go the opposite directions. This week, the volatility index added 1.24 points to 18.43, for a weekly spinning top back-to-back. This follows evidence of maximum complacency elsewhere in the options market.
Going into the week, the CBOE equity-only put-to-call ratio had produced readings of 0.50s or lower, nine of them in the 0.40s, for 23 consecutive sessions. This has now extended to 28, with 12 of them in the 0.40s. The 21-day average of the ratio ended Friday at 0.506, even as the prior four readings finished just under 0.5. This has priced in a lot of optimism on the part of longs and needs unwinding.
Thanks for reading!
