
Following futures positions of non-commercials are as of June 2, 2026.
10-year note: Currently net short 829.6k, up 41.6k.
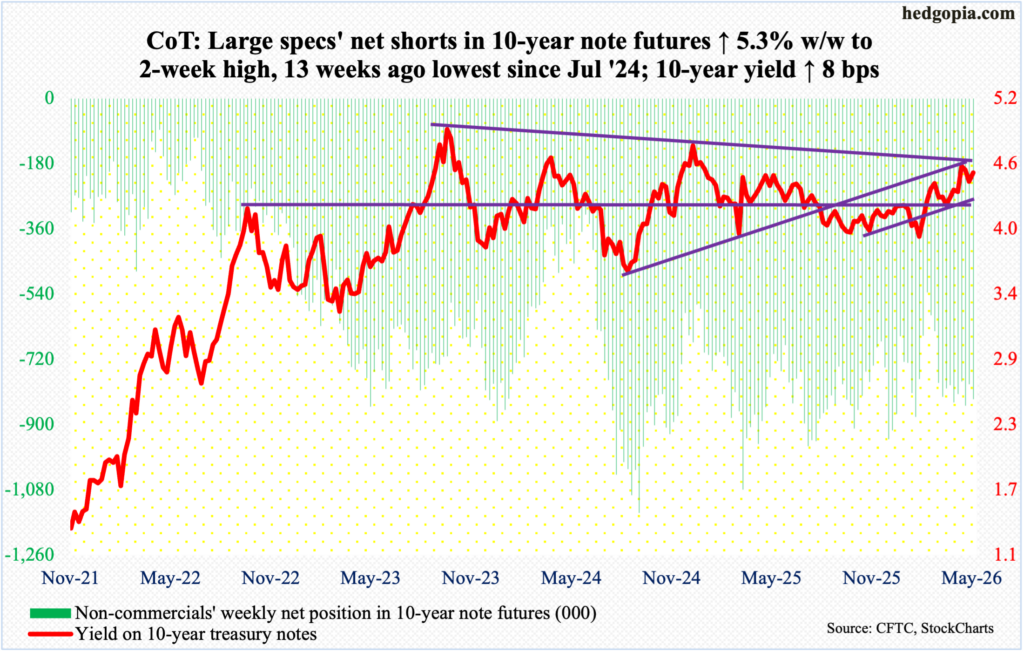
The June 16-17 FOMC meeting will be the first one chaired by Kevin Warsh, the new Federal Reserve chief. Although it is hard to say for sure, but he is billed as someone wanting to lean dovish. President Donald Trump, who appointed Warsh, makes no bones about wanting lower rates.
The fed funds rate currently stands at a target of 350 basis points to 375 basis points. The benchmark rates have been left unchanged since last December when they were reduced by 25 basis points; this preceded a cut of similar magnitude in September and October. Earlier, rates reached a cycle high 525 basis points to 550 basis points in July 2023, followed by cumulative cuts of 100 basis points over three meetings in 2024.
The moment Warsh gives out an impression that he has a soft corner for lower rates on the short end of the yield curve, it is increasingly likely that the bond vigilantes will rally the 10-year treasury yield toward five percent, which was last hit in October 2023; these notes ended the week yielding 4.54 percent, up eight basis points. The 10-year yield jumped Friday reacting to May’s jobs report showing an addition of 172,000 non-farm jobs, for a monthly average in the first five months this year of 114,000, versus a puny 10,000 last year.
The macro data is not cooperating with those arguing for lower rates.
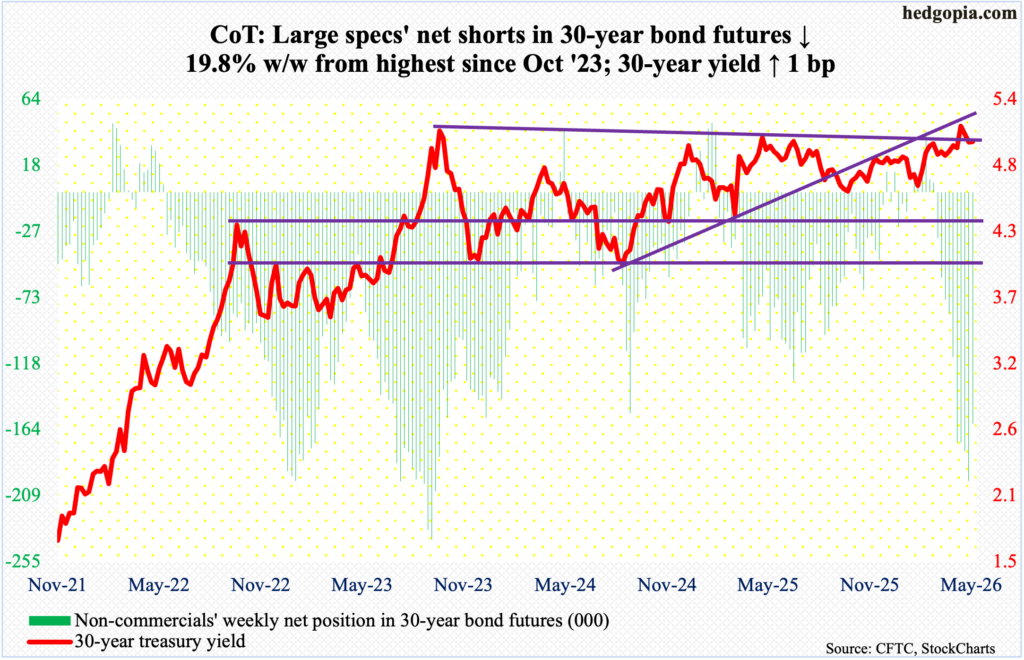
30-year bond: Currently net short 159.9k, down 39.4k.
Major US economic releases for next week are as follows.
The NFIB optimism index (May) and existing home sales (May) are on schedule for Tuesday.
Small-business optimism edged up one-tenth of a point month over month in April to 95.9. March’s 95.8 matched the low of April last year.
April sales of existing homes slightly rose 0.2 percent m/m to a seasonally adjusted annual rate of 4.02 million units – a two-month high.
The consumer price index (May) will be reported on Wednesday. In the 12 months to April, headline and core CPI respectively increased 3.8 percent and 2.8 percent – a 35- and six-month high, in that order.
Thursday brings the producer price index (May). Headline and core wholesale prices in April jumped six percent and 4.4 percent respectively from a year ago.
The University of Michigan’s consumer sentiment index (June, preliminary) is due out Friday. Sentiment tumbled five points m/m in May to 44.8 – a record. As recently as February, sentiment was 56.6.
WTI crude oil: Currently net long 148k, up 14.3k.
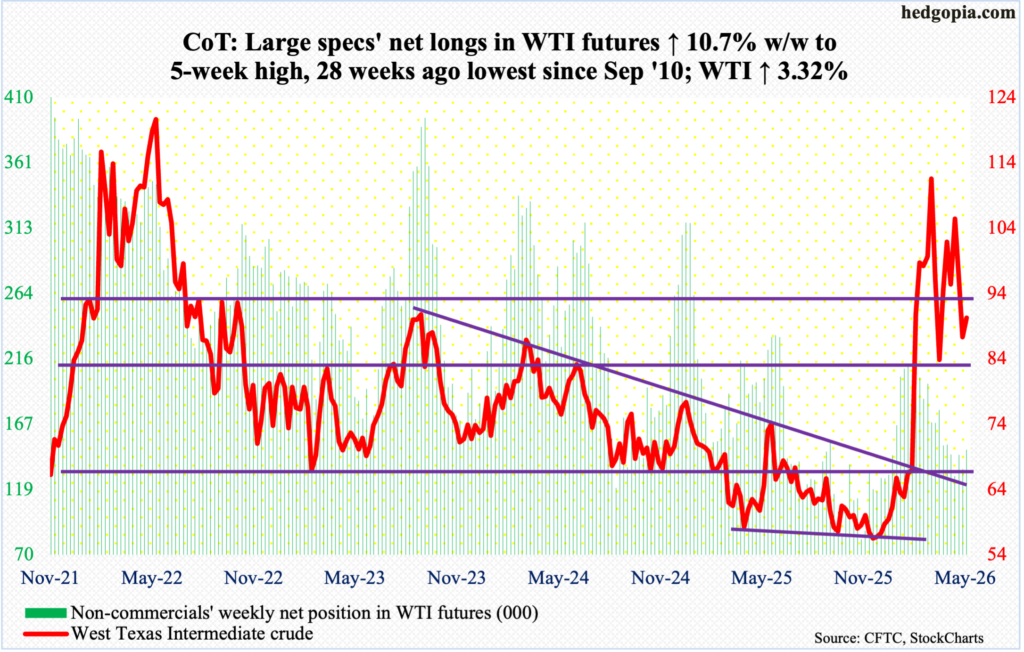
Last week, West Texas Intermediate crude fell out of a pennant formed by a series of lower highs and higher lows in the wake of the February 28 US-Israeli attack on Iran. This week, oil bulls’ attempts to reclaim the formation were rejected, although they were able to rally the crude 3.3 percent to $90.26/barrel, yet finishing substantially below Wednesday’s session high $97, thereby helping form a weekly shooting star.
Bears showed up in droves on Wednesday at the 50-day moving average ($97.61). They also succeeded in pushing the candle below horizontal support at $91-$92. To bulls’ credit, they were able to defend lateral support at $86-$87, a breach of which can open the doors to a test of the 200-day ($72.71) eventually.
WTI has come a long way. On February 27, it tagged $64.85 intraday before exploding higher in the subsequent sessions, reaching a four-year high $119.48 on March 9.
In the meantime, as per the EIA, US crude production in the week to May 29 decreased 8,000 barrels per day week over week to 13.707 million b/d; output registered a record 13.862 mb/d in the week to November 7 last year. Crude imports increased 1.2 mb/d to 6.4 mb/d. As did stocks of gasoline and distillates, which respectively grew 3.4 million barrels and 1.5 million barrels to 215 million barrels and 102.3 million barrels. Crude inventory declined eight million barrels to 433.7 million barrels. Refinery utilization rose two-tenths of a percentage point to 94.7 percent.
E-mini S&P 500: Currently net short 220.8k, up 54.9k.
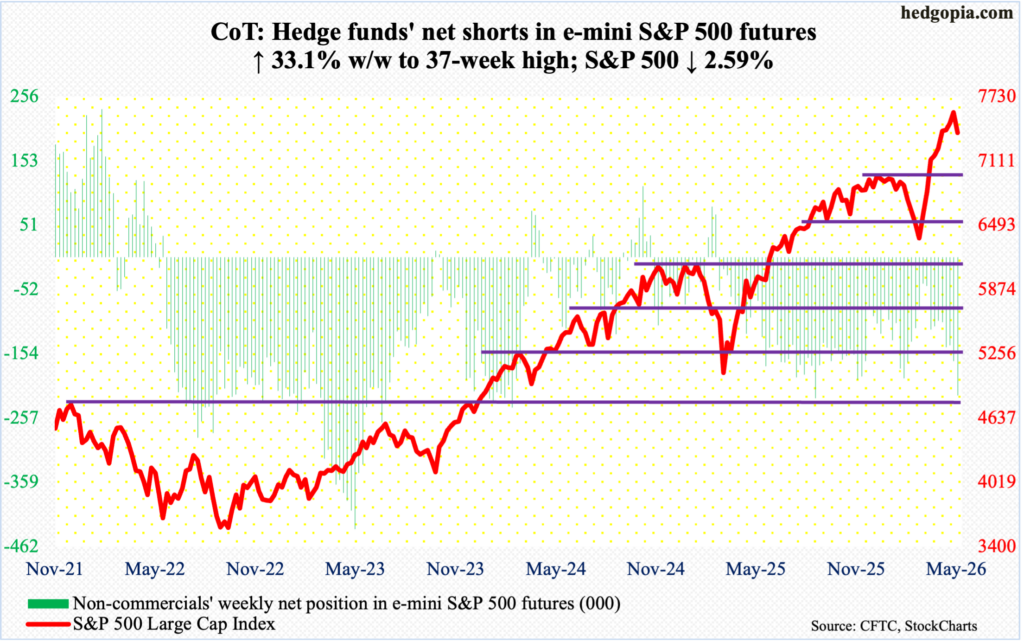
Non-commercials perfectly timed to raise net shorts to a 37-week high. The cash (7384) declined 2.6 percent this week. Intraday Tuesday, the S&P 500 peaked at a fresh all-time high of 7621. This was followed by Tuesday’s defense of short-term horizontal support just north of 7500; once it gave way in the first hour Friday, selling accelerated and persisted throughout the session.
This week’s drop denied the bulls of a record 10th weekly gain. The large cap index earlier bottomed at 6317 on March 30, jumping 20.6 percent through Tuesday’s record.
Prior to this week’s drop, the index stubbornly remained overbought for a while. Unwinding therefore is going to last. A major breakout retest will take place at 7000, or just underneath. Prior to that, the 50-day rests at 7156, which approximates straight-line support at 7140s. Immediately ahead, there is minor support at 7330s, and then 7270s.
Euro: Currently net long 48.9k, up 19.4k.
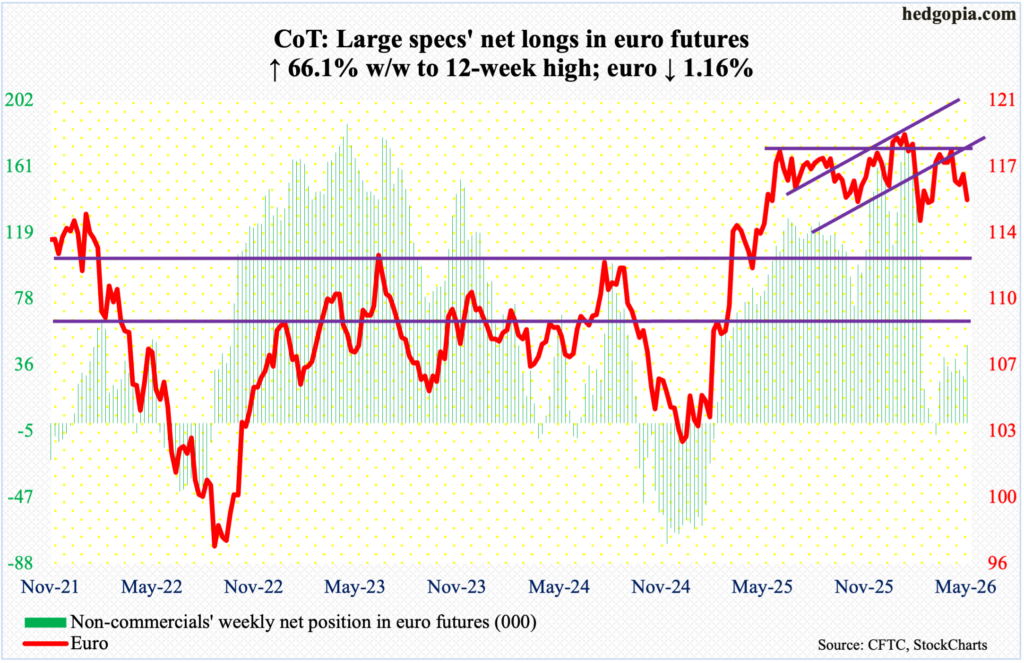
On Friday last week, euro bears successfully stopped the bulls at the 200- and 50-day (now $1.168 and $1.167 respectively). This week, pumped-up sellers were in full control, as they pushed the currency lower 1.2 percent to $1.152; this raises the possibility that the euro gravitates toward the low end of a one-year range of $1.14-$1.18.
Earlier, after trying for five successive weeks to penetrate horizontal resistance at $1.18, longs gave up four weeks ago. This was preceded by a four-and-a-half-year high $1.2083 posted on January 27. On March 13, the euro bottomed at $1.141.
Gold: Currently net long 176k, up 21.8k.
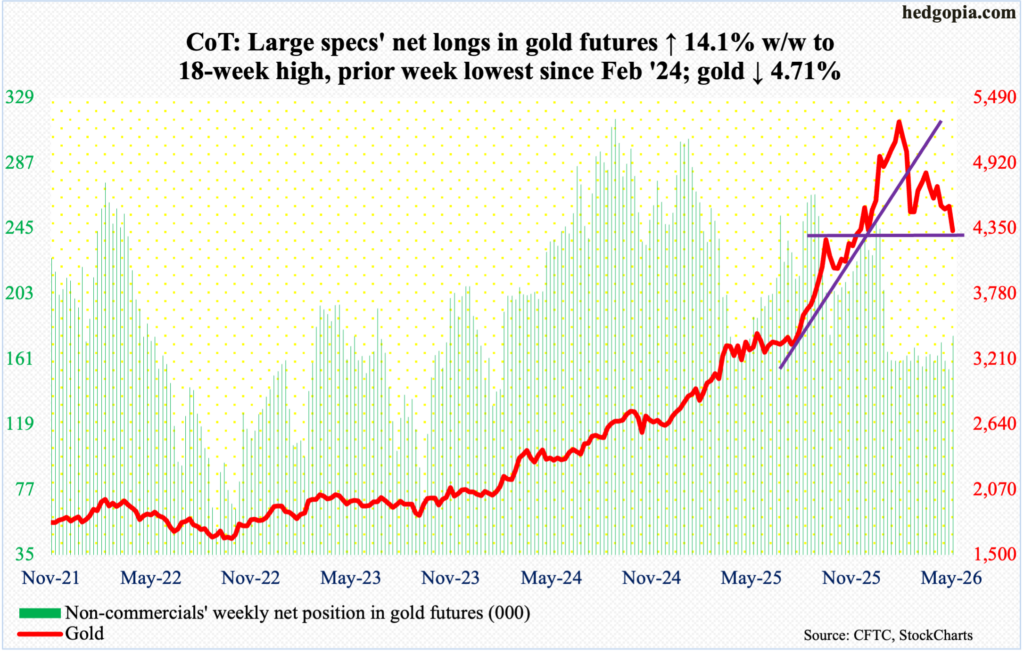
At long last, the 200-day has been breached. Gold, down 4.7 percent this week to $4,328/ounce, has remained above the average ($4,403) since October 2023. On March 23 this year, the metal had bottomed just above the average at $4,099. Gold, sandwiched between the 50- and 200-day starting March 18, tagged $5,608 on January 29 and peaked, before making a series of lower highs.
With this week’s loss, gold also compromised horizontal support at $4,370s, albeit not by a whole lot. The risk going forward is that the yellow metal continues lower from hereon. The March 23 low has now taken on significance.
Nasdaq (mini): Currently net short 14.9k, up 8.9k.
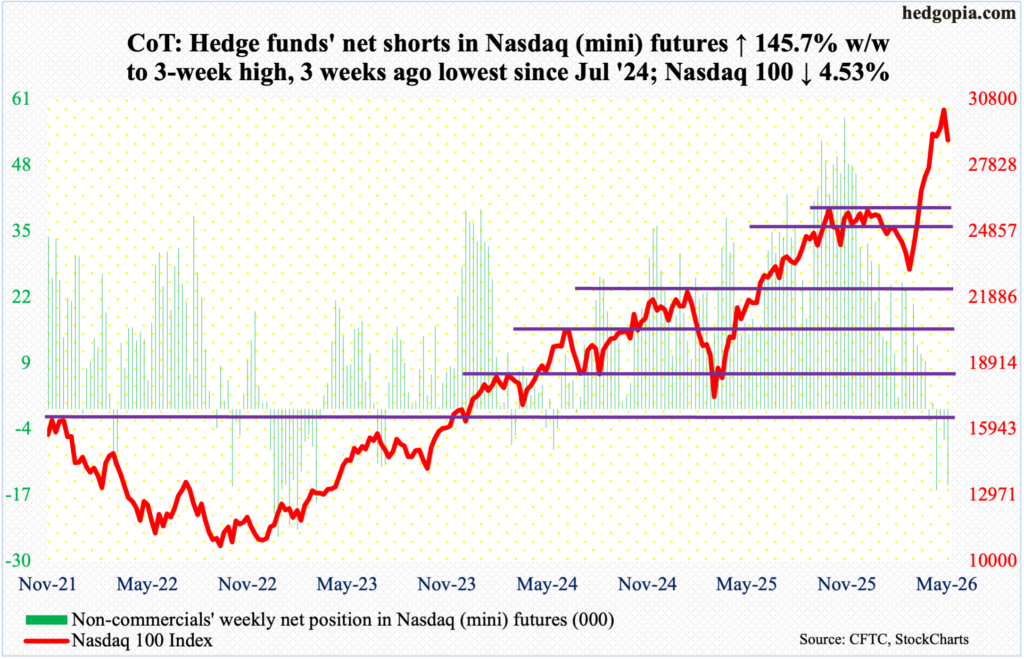
Hindsight is 20/20, but it now seems the potentially bearish weekly candles of three and four weeks ago – a weekly hanging man and a spinning top before that – came home to roost this week. On track to rise 1.4 percent for the week until Wednesday’s fresh intraday high of 30762, the Nasdaq 100 fell apart Friday to end the week down 4.5 percent to 28958. From March 30 when the tech-heavy index bottomed at 22841 through Wednesday’s high, it shot up 34.7 percent. That is a lot of paper profit for two months’ work, and it is hard not to be tempted to lock in, particularly considering the upcoming IPO window.
Elon Musk’s SpaceX plans to go public with a valuation of $1.77 trillion next week. Anthropic has confidentially filed for an IPO, and OpenAI is expected to do so soon. Both are going to be monster IPOs. Money managers cannot be blamed for locking in tech gains to make room for new listings. Concurrently, Google parent Alphabet (GOOG), which a month ago briefly surpassed Nvidia (NVDA) by market cap, is raising $85 billion in share sales to fund AI buildout; this follows a raise of more than $55 billion in the debt market since last November. GOOG, Microsoft (MSFT), Facebook parent Meta (META) and Amazon (AMZN) combined are expected to spend more than $700 billion in capex this year; this follows last year’s $500 billion and next year’s maybe $1 trillion. These funds will have to come from somewhere.
This raises the risk of continued profit-taking in tech shares that have gone vertical in recent weeks/months.
A major breakout retest takes place at 26100s on the Nasdaq 100.
Russell 2000 mini-index: Currently net short 14.9k, down 1k.
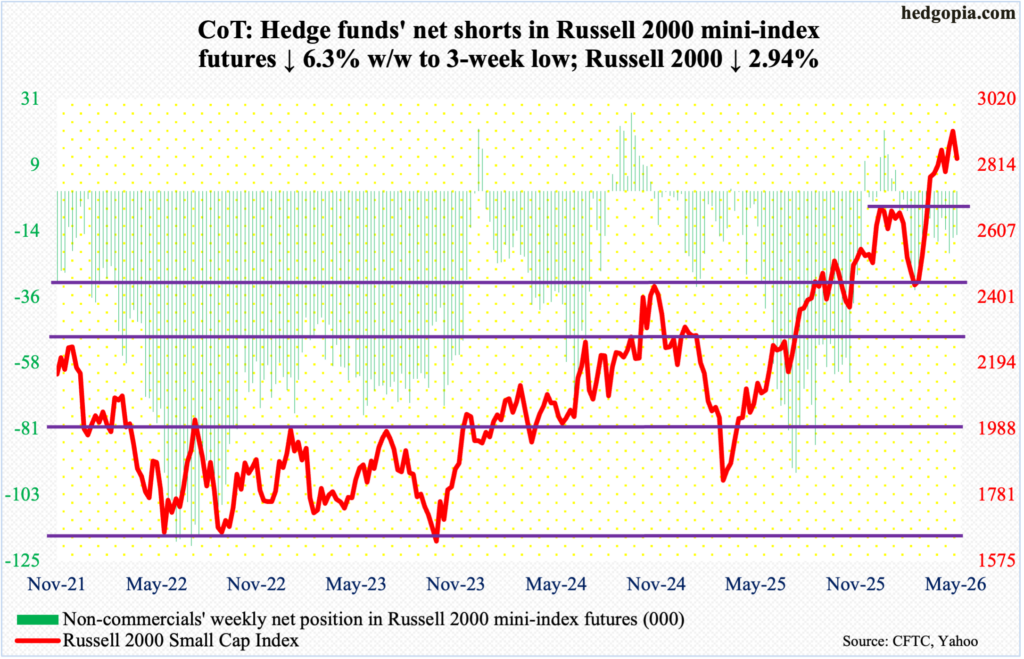
No sooner did small-cap bulls enjoyed a breakout than it was rendered false. Last week, the Russell 2000 staged a mini breakout at 2880s, which the bulls were unable to clear for three weeks, respectively peaking at 2879, 2888 and 2889. This week, the index ticked 2944 intraday Thursday – barely past the prior high of 2943 posted on May 28 – but only to get vehemently rejected on Friday, losing 2.9 percent for the week to 2834, which also means the index is back below 2880s.
The next level of interest lies at 2730s. On January 27, the Russell 2000 peaked at 2735 – a level that was reclaimed eight weeks ago, followed by a successful retest six weeks ago. Then, three weeks ago, on May 19, there were bids waiting as the dip to 2723 was bought.
US Dollar Index: Currently net long 3.8k, up 2.9k.
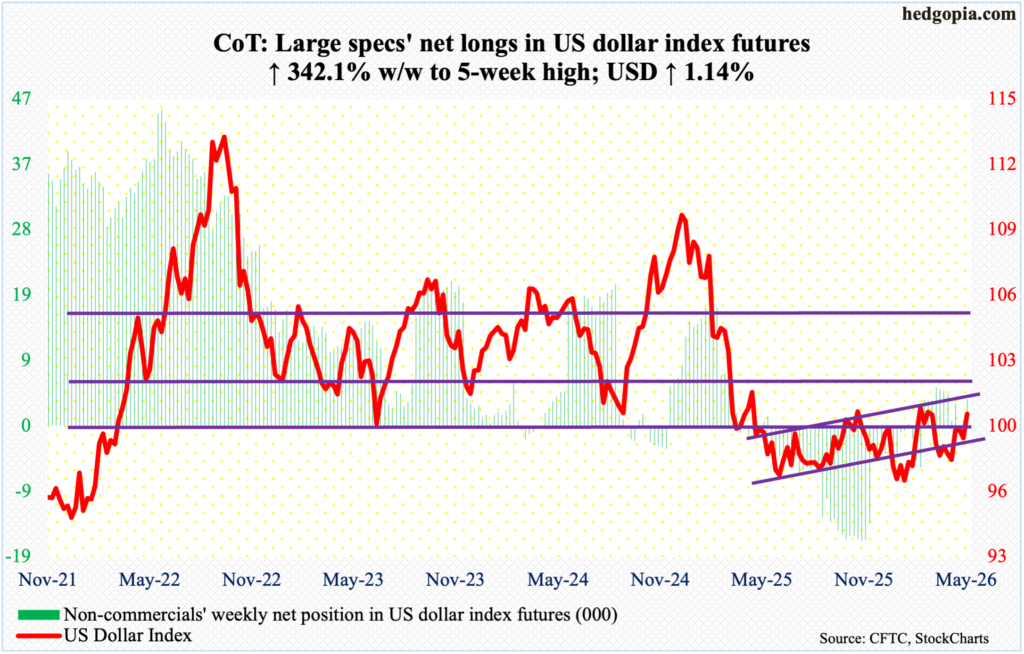
Dollar bulls rallied the US dollar index 1.1 percent to 100.07 this week, once again testing a crucial level. The significance of 100 goes back more than a decade, and the level was lost in April last year. More recently, after unsuccessfully trying for five weeks to reclaim 100, including March 31 when an intraday high of 100.64 was hit intraday, bulls gave up trying nine weeks ago. Should the March high be conquered in the sessions ahead, it will be a major victory for the bulls.
In January last year, after a three-plus-month rally, the US dollar index reversed hard at 110.18, subsequently reaching 96.38 in June and successfully testing that low with a lower low 96.22 in September. On January 27 this year, another lower low 95.55 was ticked, and that drew bids. The positive momentum that followed will have gained steam should the March high gets recaptured.
VIX: Currently net short 70k, up 15.5k.
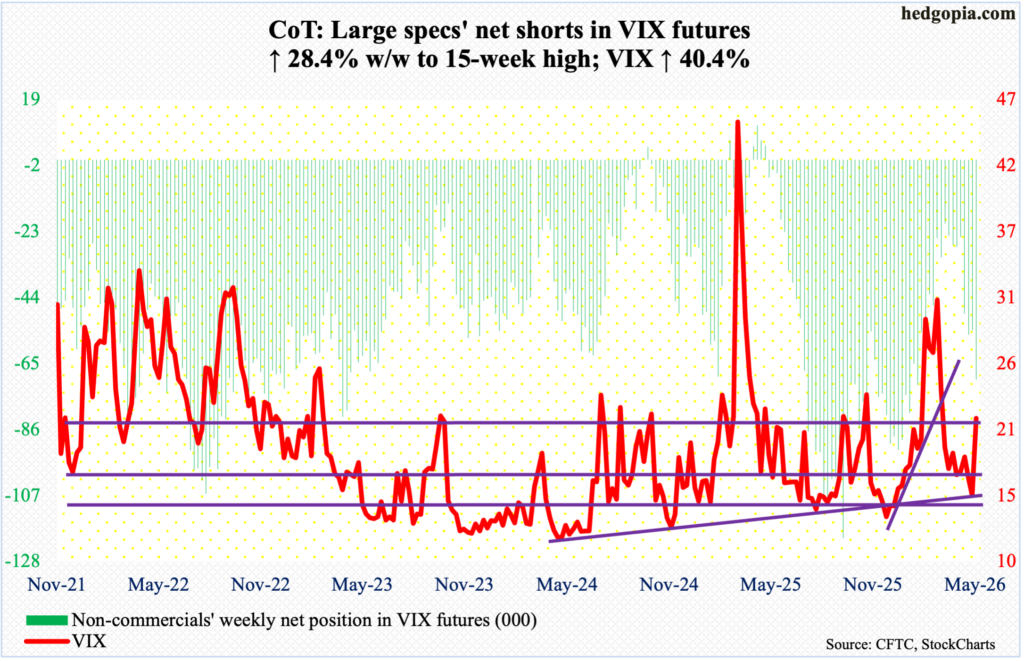
Last week, a two-year rising trendline was breached on an intraday basis but was intact on a closing basis. This week, that support was tested again as VIX ticked 15.18 intraday Thursday but only to then explode higher come Friday, ending the week up 6.19 points to 21.51.
There is a ton of room for volatility to continue higher. In April last year, VIX experienced a spike reversal after touching 60.13 intraday; a falling trendline thereof extends to just north of 30. Volatility bulls will be eyeing that level once they reclaim 22, which represents a similar trendline from March this year when VIX peaked at 35.30.
The jump in volatility this week comes in the wake of persistent signs of complacency for weeks. Friday’s 0.67 reading in the CBOE equity-only put-to-call ratio was the first time in 42 trading sessions that it did not produce readings of 0.50s or lower, 21 of them in the 0.40s and one in the 0.30s. The 21-day average of the ratio dropped to 0.482 on Thursday, which is the lowest since December 2021. Sentiment leans dangerously bullish.
Thanks for reading!
