
With more than three-fifths of S&P 500 companies having reported June-quarter results, investor attention is likely to gradually shift elsewhere looking for catalysts. This void likely gets filled by the Fed and the rejuvenated debate around inflation in the weeks and months ahead.
Six of the Magnificent 7 have reported June-quarter results over the last two weeks, with Nvidia’s (NVDA) July quarter due out on the 26th later this month. Regarding the six that reported – Google parent Alphabet (GOOG), Tesla (TSLA), Microsoft (MSFT), Facebook parent Meta Platforms (META), Apple (AAPL) and Amazon (AMZN) – capital-spending plans were front and center. GOOG and META were punished as they continued to forecast elevated spending, while MSFT and AMZN were rewarded on signs their spending is yielding positive results.
In the sessions and weeks ahead, the tech-heavy Nasdaq 100 is likely to be moved less by earnings news, as the big ones with the most weight in the market cap-weighted index are done reporting.
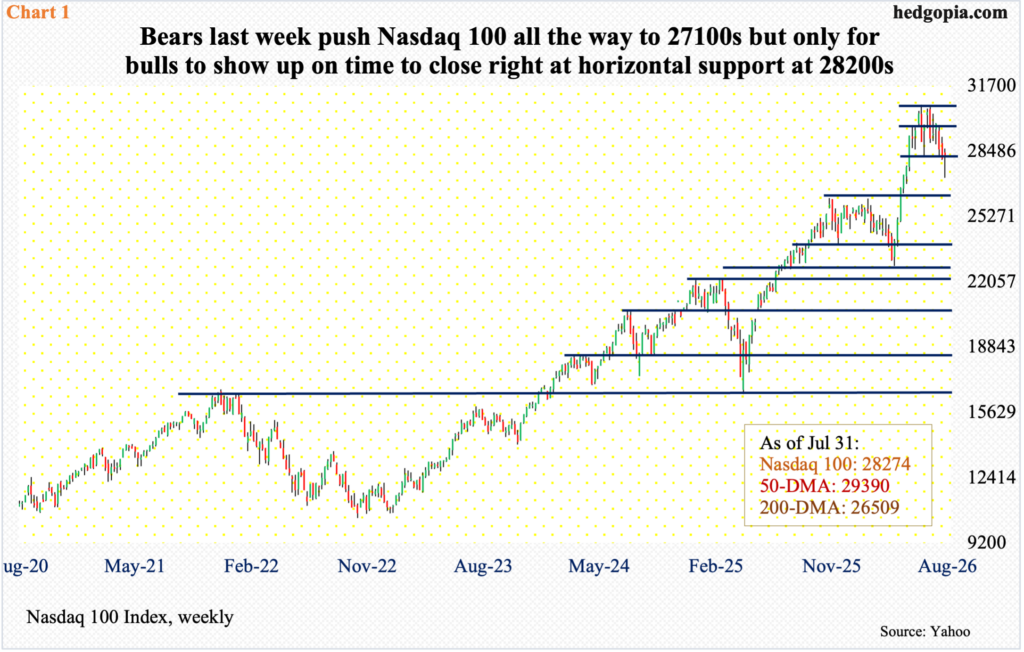
As things stand, bears have had success as the index (28274) is down 8.1 percent from the June 3 peak of 30762, although the fact remains that they were unable to hang on to the low of 27176 of last Wednesday; through that low, the Nasdaq 100 was down 11.7 percent from the June high. Kudos to the bulls for defending short-term horizontal support at 28200s last Wednesday, rallying the index 0.6 percent for the week; this was the first up week in three. Since the June 3 peak, the Nasdaq 100 has drifted lower in a series of lower highs (Chart 1). In the event the index continues to rally, there is horizontal resistance at 28500s, followed by the 50-day at 29390.
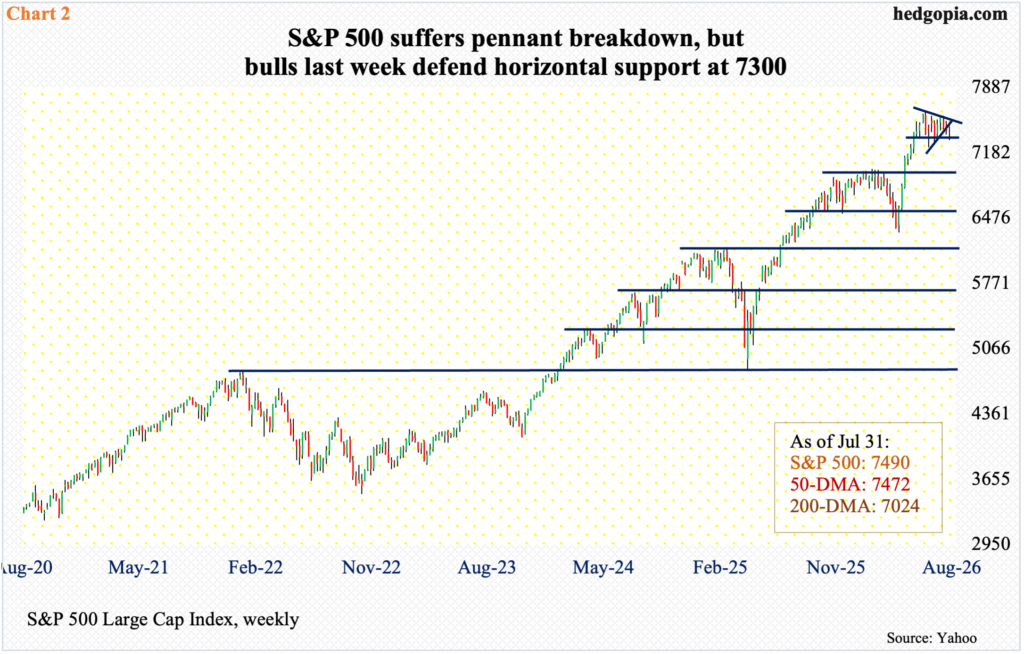
The S&P 500, too, rallied last week after two consecutive down weeks. Bears early in the week successfully maintained pressure, pushing the large cap index down 1.3 percent through Wednesday’s low; thanks to bulls’ defense of horizontal support at 7300s, the index reversed to end the week up 1.1 percent to 7490.
Bulls also reclaimed the 50-day after the index remained under the average for six sessions in a row; bulls’ bigger test lies at 7550 should they keep up the upward pressure in the sessions ahead. In the prior week, the S&P 500 breached a pennant originating on June 2 when the index peaked at 7621 (Chart 2). Last week, Friday’s high 7512 kissed the lower-line resistance of the pattern, with the upper-line resistance at 7550.
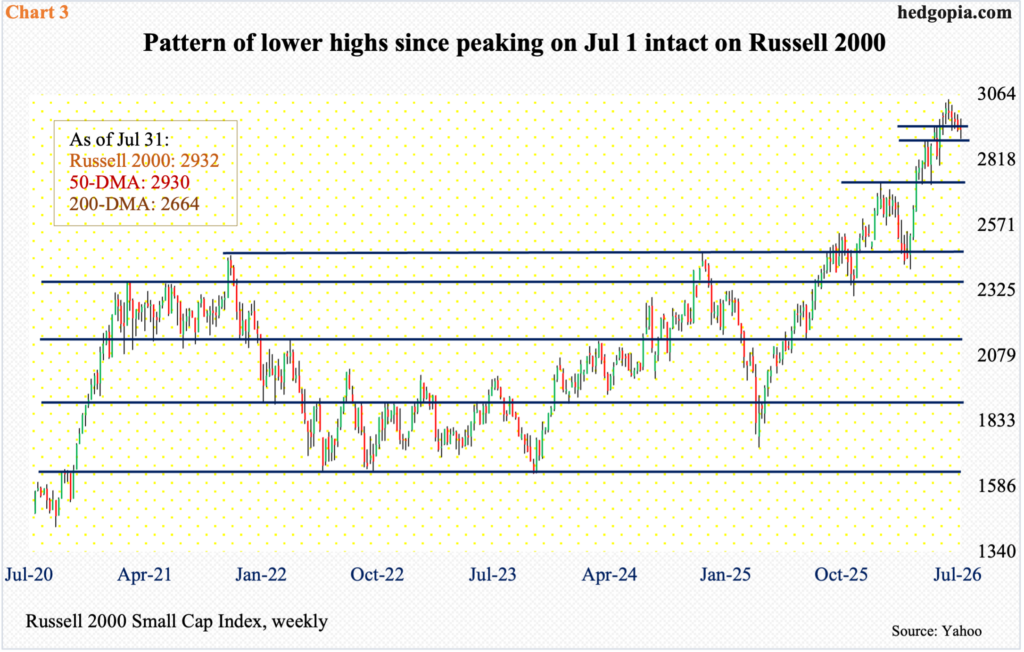
The pattern of continued weakness early on and then bulls stepping up at/near support was also evident in the Russell 2000, which edged up 0.06 percent to 2932. By Friday’s low 2897, the small cap index was well on its way to breaching straight-line support at 2940s, but only for bulls to show up just north of horizontal support at 2880s (Chart 3).
The problem for the bulls is that the 50-day (2944), which coincides with the 2940s horizontal support, has been breached, although not by a whole lot. The Russell 2000 nonetheless has been consistently making lower highs since it peaked at 3047 on July 1. Concurrently, the daily RSI is facing strong resistance at the median; bulls are struggling to gather positive momentum.
The way interest rates are behaving of late is not helping the small-caps. An increase in rates will impact companies big and small, but the small ones are more vulnerable not only because they rely more on floating-rate loans but also because borrowing costs are higher versus their large-cap cousins, not to mention these companies rely more on debt financing.
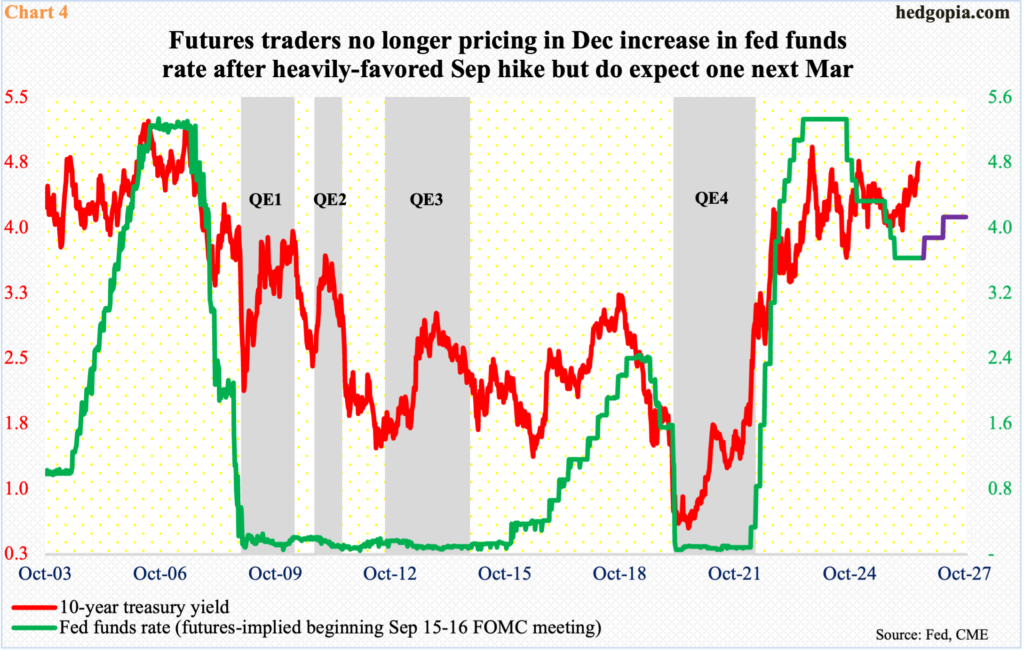
The 10-year treasury yield bottomed at 4.36 percent on June 25 and closed last Friday at 4.75 percent, which is the highest since January last year; rates were 3.96 percent on February 27 this year. On the short end, the fed funds rate has been left unchanged at a target range of 3.5 percent to 3.75 percent since last December, but the outlook has been turned on its head.
Until just a few months ago, markets were betting with high conviction that the Federal Reserve would reduce the benchmark rates at least twice this year (in 25-basis-point increments); now, futures traders have their money on a hike come September (15-16) with two-thirds probability. As a matter of fact, until just a few weeks ago, they were pricing in another hike in December, the odds of which have now dropped to 43 percent; they do expect another hike by next March (16-17) to a range of four percent to 4.25 percent (Chart 4).
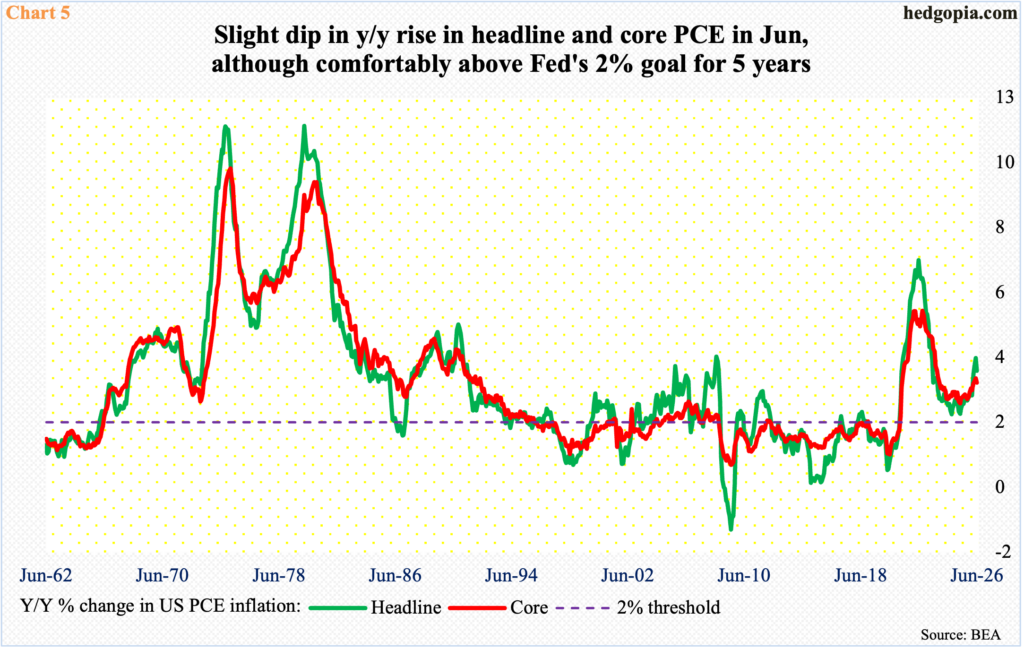
Inflation has remained above the Fed’s stated goal of two percent for over five years now. In the 12 months to June, headline and core CPI (consumer price index) grew 3.5 percent and 2.6 percent, in that order. Over the same timeframe, headline and core PCE (personal consumption expenditures), which is the Fed’s preferred metric, respectively increased 3.7 percent and 3.3 percent, with May’s 4.1 percent and 3.4 percent highest in 37- and 31-months respectively (Chart 5).
Market participants thus are used to inflation persisting well ahead of the Fed’s target. Willingly or unwillingly, newly appointed Chairman Kevin Warsh changed this dynamic. During his first FOMC meeting in June, the “this committee will deliver price stability” statement seemed to have come from a die-hard inflation hawk. In fact, a decent number of futures traders expected a hike in last week’s meeting, which saw three dissents in a 9-3 vote to keep the rates steady. More importantly, Warsh during the post-meeting press conference was non-committal to a hike in September even though markets already expect one. This is creating confusion. Warsh is not for giving forward guidance, and market participants wish the central bank’s handholding would not go away. This is a recipe for volatility, and traders will probably be watching any inflation data like a hawk in the months to come.
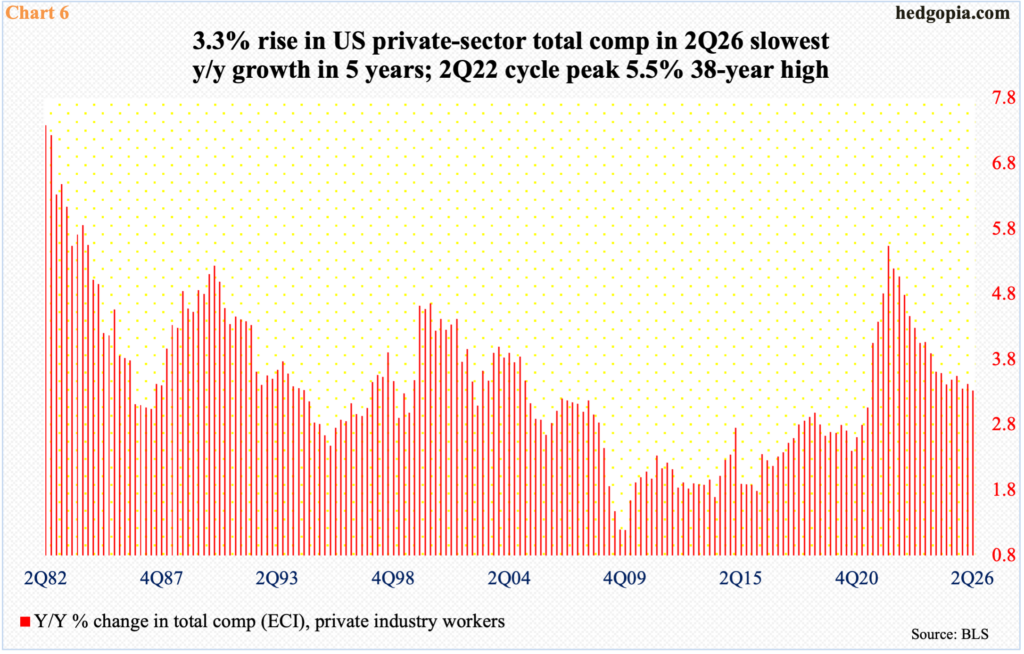
From FOMC doves’ perspective, the good thing is that, yes, inflation has persisted above the Fed’s target, but it is not translating to persistent upward pressure on wages.
Last week, labor productivity for the June quarter was released, and we learned that private-sector output per hour rose 3.33 percent from a year ago. This was the slowest year-over-year increase in five years (Chart 6). The metric has been persistently declining since reaching a 38-year high 5.5 percent in 2Q22.
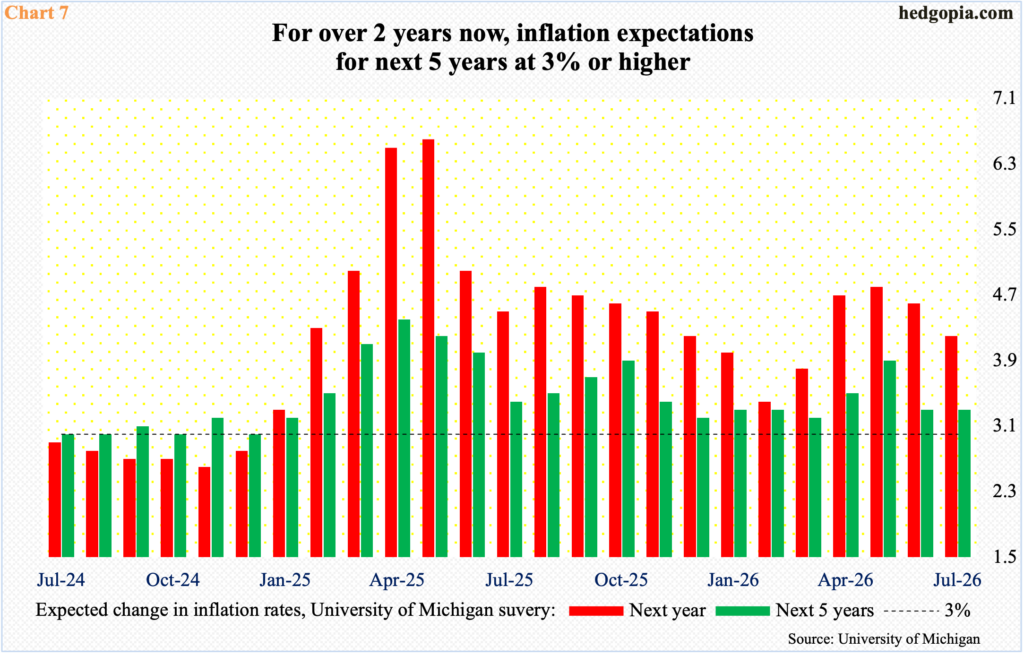
With that said, consumer sentiment toward inflation outlook is yet to reach a comfort zone.
In July, the University of Michigan’s survey showed that the expected change in inflation rates for next year and the next five years respectively stood at 4.2 percent and 3.3 percent. Inflation expectations for the next five years have stubbornly remained at three percent or higher for two years now (Chart 7). The longer this persists, the higher the risk that this eventually gets reflected in wage inflation, which is not what the Warsh-led Fed would want to happen.
In the meantime, the arrival of Warsh and his desire to get things done differently could end up acting as a mecca for volatility loving traders, particularly when there is an earnings vacuum.
Thanks for reading!
