
Following futures positions of non-commercials are as of August 18, 2026.
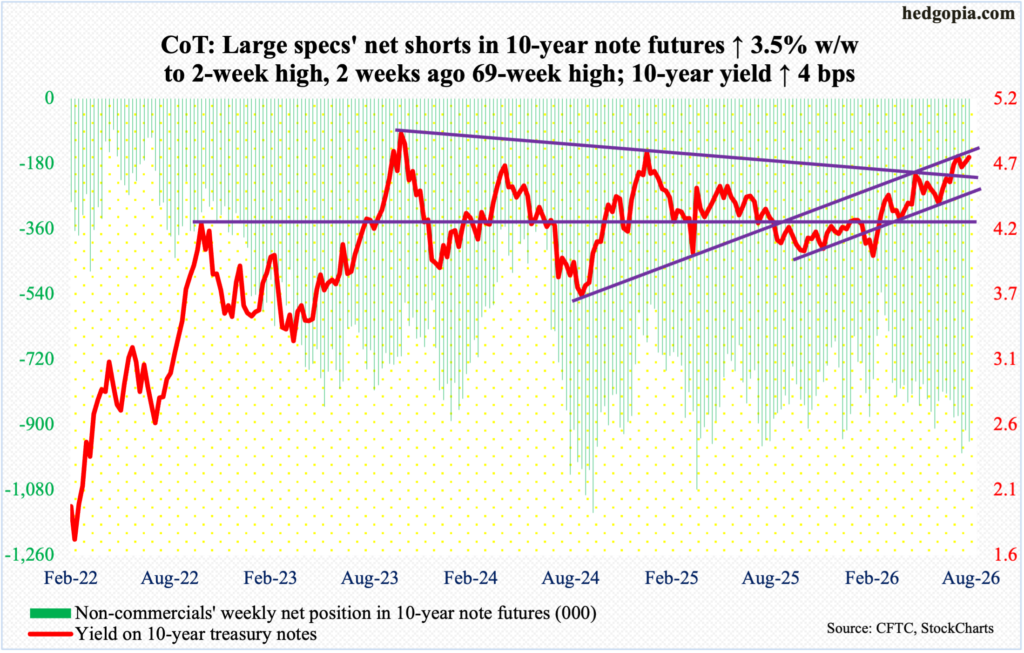
10-year note: Currently net short 947k, up 31.9k.
Treasury Secretary Scott Bessent is taking on the bond market and could very well be on a collision course with the Kevin Warsh-led Federal Reserve.
In an effort to rein in rising bond yields, the Treasury Department on Wednesday announced that it would double its repurchases of longer-dated debt from $2 billion to $4 billion during September 9-November 4; this was followed by Bessent saying on Thursday that he may increase the buybacks further.
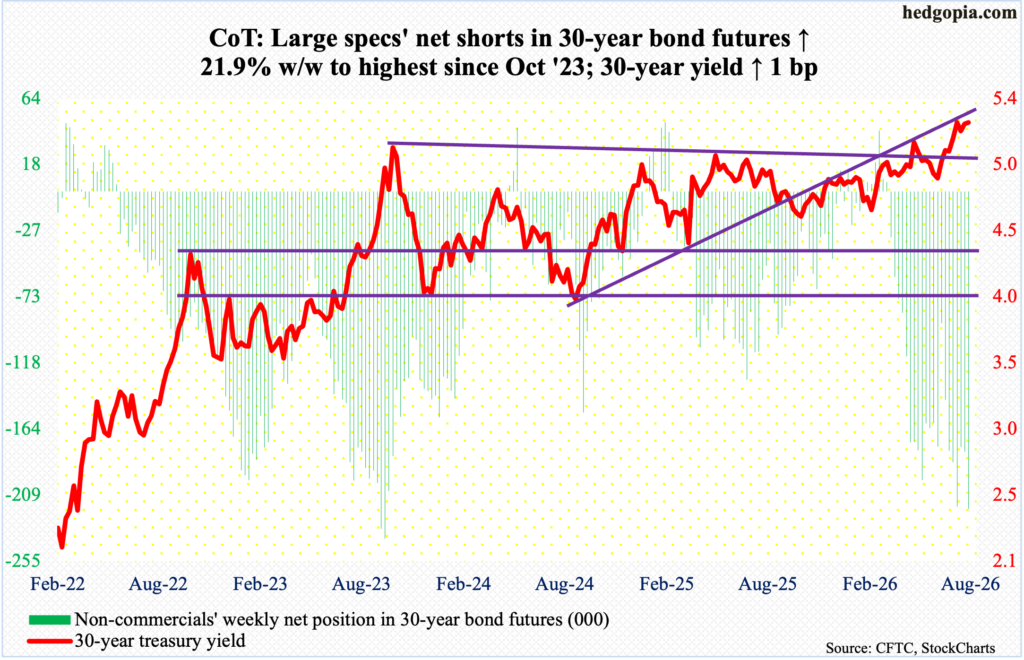
The 30-year treasury yield, which on Tuesday reversed lower after ticking 5.33 percent – the highest since June 2007 – had a bad Wednesday but recovered to go up a basis point for the week to 5.28 percent. The 10-year T-yield similarly rose four basis points to end the week at 4.74 percent. The 30-year bonds and 10-year notes were yielding 3.91 percent and 3.60 percent in September 2024, in that order.
Bond vigilantes increasingly are demanding higher yields as inflation continues to remain well north of the Fed’s stated goal of two percent and as fiscal indiscipline persists. This week, the national debt crossed $40 trillion. Any government with this kind of debt load would yearn for lower rates. In the March quarter, federal interest payments were $1.22 trillion annually, which has doubled in four years.
The bond market not surprisingly is beginning to complain that this is not sustainable. In the 12 months to July, the U.S. government ran a deficit of $1.95 trillion. So, when Bessent intervenes in the market to lower the yield but does little to reduce the red ink – if not outright stop it – it is likely to fall on the deaf ears of bond vigilantes.
Bessent is trying to tinker the same long end of the yield curve that newly appointed Fed Chair Warsh not too long ago was heaping great praise on for rallying. Warsh, who comes across as a diehard inflation hawk, has attended two FOMC meetings since his May appointment, and the fed funds rate was left unchanged at a range of 3.50 percent to 3.75 percent in both; he is for giving more say to the bond market to lead the central bank, and this is precisely where Bessent is striking. It is too soon to even venture a guess – let alone predict – how all this ends but suffice to say that interesting times lie ahead.
It is highly unlikely Warsh will try to dwell on the topic in his keynote address at the August 27-29 Jackson Hole Symposium but the sooner he makes his views public the better it is for bond traders just so the latter know if they are only up against a Treasury that has a limited capability to spend but also a Fed that has unlimited buying power.
30-year bond: Currently net short 219k, up 39.4k.
Major US economic releases for next week are as follows.
The S&P Cotality Case-Shiller home price index (June) and new home sales (July) are on schedule for Tuesday.
Nationally in May, home prices rose 1.1 percent from a year ago. This was the fastest monthly increase in five months. March’s 0.75-percent year-over-year appreciation was the smallest in 33 months.
Sales of new homes in June were up 1.6 percent month over month to a seasonally adjusted annual rate of 628,000 units. January’s 576,000 registered a 40-month low.
Wednesday brings durable goods (July), GDP (2Q26, 2nd estimate), corporate profits (2Q26) and personal income/spending (July).
June orders for non-defense capital goods ex-aircraft – proxy for business capital spending plans – firmed up 1.2 percent m/m to $85.4 billion – a record; from a year ago, orders surged 12.9 percent, which was the highest y/y pace since November 2021.
The advance estimate showed that real GDP grew 1.5 percent in the June quarter.
In the March quarter, corporate profits adjusted for inventory valuation and capital consumption jumped 12.8 percent y/y to $4.43 trillion – a record.
In the 12 months to June, headline and core PCE (personal consumption expenditures) rose 3.7 percent and 3.3 percent respectively, with both setting three-month lows. May’s 4.1 percent and 3.4 percent were at 37- and 31-month highs, in that order.
The University of Michigan’s consumer sentiment index (August, final) will be out Friday. August’s preliminary reading showed consumer sentiment dropped 4.2 points m/m to 51. May’s 44.8 was a record low.
WTI crude oil: Currently net long 104.6k, up 11.8k.
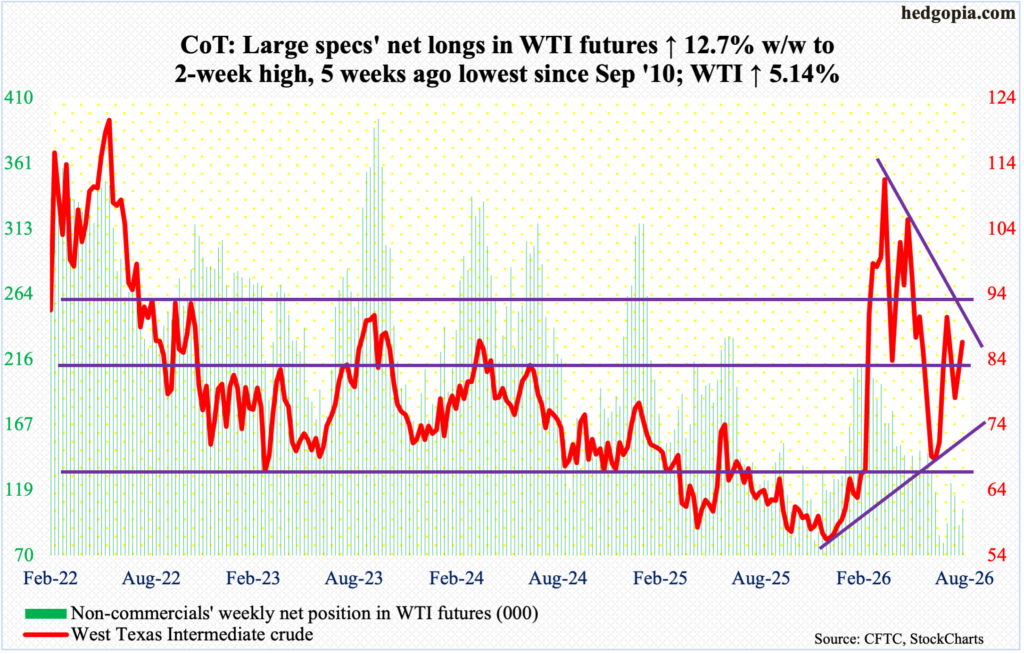
West Texas Intermediate crude this week enjoyed a back-to-back weekly jump of five-plus percent to $86.64/barrel. This followed an intraday trough at $74.24 on the 5th this month. Earlier on March 9 it peaked at $119.48. The crude had a massive six-session surge starting March 2 when it gapped up in response to the February 28 launch of a military attack by the U.S. and Israel on Iran. On February 27, WTI closed at $67.02, with a session high of $67.83 and a low of $64.85.
Since that peak, WTI has traded within a pattern of lower highs and higher lows. Momentum likely follows in whichever direction the crude breaks. For now, the daily is getting overbought. Should weakness develop in the sessions ahead, bulls should be able to defend using moving-average support, with the 50- and 200-day at $79.01 and $77.38 respectively.
In the meantime, as per the EIA, US crude production in the week to August 14 increased 25,000 barrels per day week over week to 13.830 million b/d; in the week to July 10, production of 13.861 mb/d was only 1,000 short of the record 13.862 mb/d posted in the week to November 7 last year. Crude imports decreased 746,000 b/d to 6.6 mb/d. As did distillates inventory which declined 1.5 million barrels to 105.6 million barrels; stocks of crude and gasoline were up 4.4 million barrels and 688,000 barrels respectively to 428.8 million barrels and 209.4 million barrels. Refinery utilization rose a percentage point to 97.2 percent.
E-mini S&P 500: Currently net short 10.6k, up 21.8k.
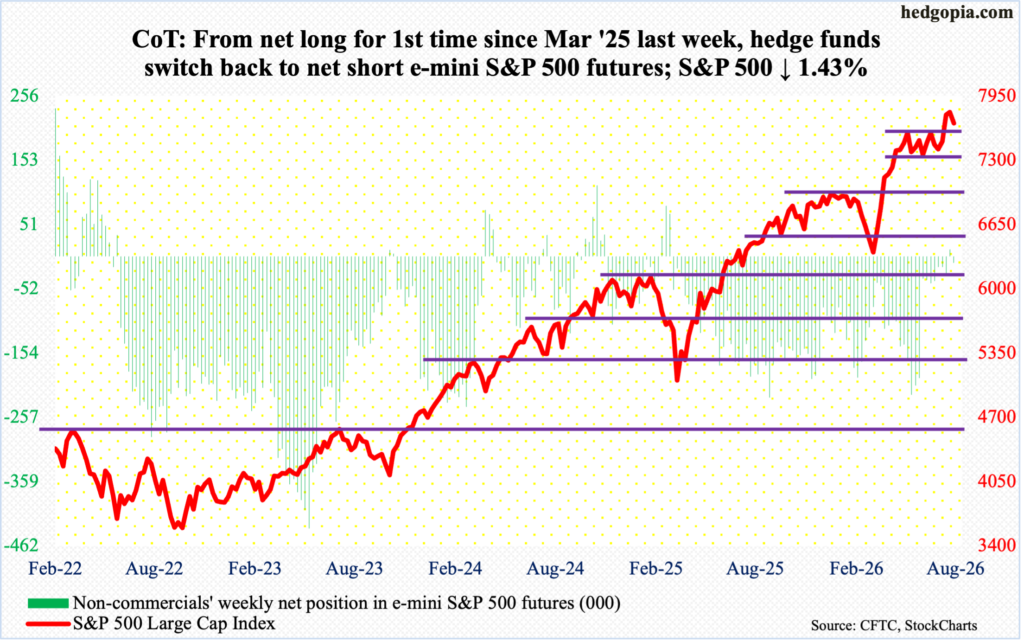
The S&P 500 fell for the first time in four weeks, giving back 1.4 percent this week to 7674. Last week, for the first time since March last year and after 14 weeks of staying net short, non-commercials had switched to net long e-mini S&P 500 futures. This week, they went back to being net short.
Bears succeeded in gaining control over 7760s as soon as the week began. They would have scored a major win if 7600-plus similarly gave way, but bulls denied that. On Thursday, the large cap index tagged 7639 intraday, followed by decent strength on Friday.
Breakout retest at 7600-plus is crucial. The S&P 500 consolidated for a couple of months after peaking at 7621 on June 2, which was eclipsed on the 4th this month, followed by a new high 7817 on the 13th. Through that high, the index jumped 23.7 percent from the March low of 6317.
Bulls obviously are sitting on tons of gains and are therefore probably keenly watching crucial levels to begin to lock in gains. Saving 7600-plus is very important.
Euro: Currently net short 59.1k, down 922.
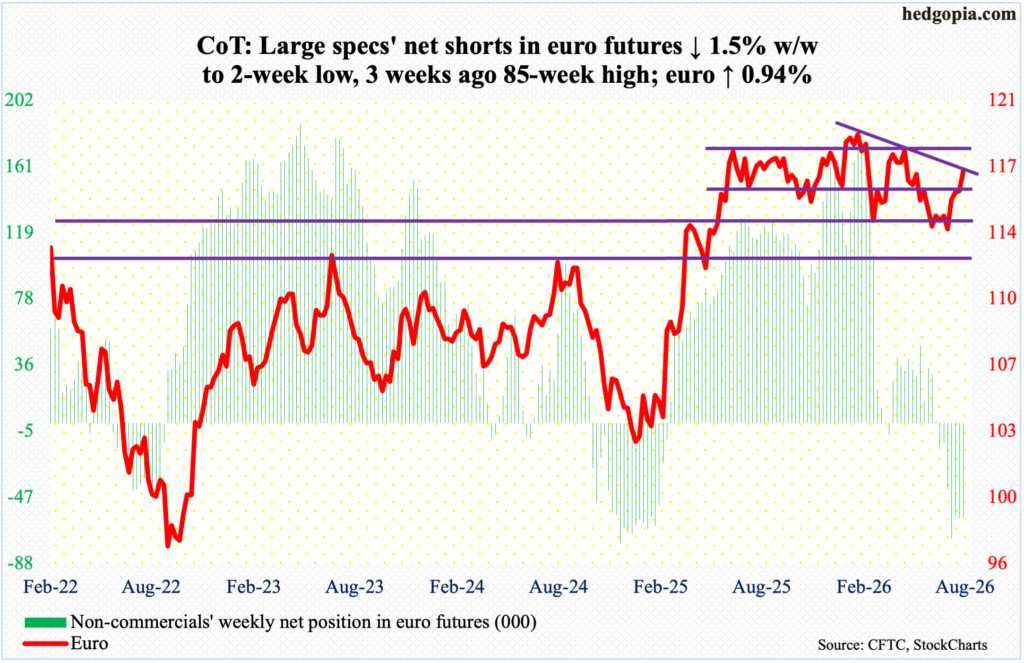
For more than a year, the euro went back and forth between $1.14 and $1.18, marked by a four-and-a-half-year high of $1.208 posted on January 27, followed by a low of $1.141 on March 13. A declining trendline from the January high was broken two weeks ago.
This week, the currency rallied 0.9 percent to $1.168, with both Thursday and Friday tagging $1.171 intraday; the move was aided by Wednesday’s strength past the 200-day at $1.163. The 50-day was reclaimed in late July.
Momentum is with the euro bulls currently, with the daily way overbought. The upper end of the $1.14-$1.18 range has not been tested since early May. If the euro manages to test the range top, it is unlikely this hurdle falls at the very first go.
Gold: Currently net long 222.2k, up 4.2k.
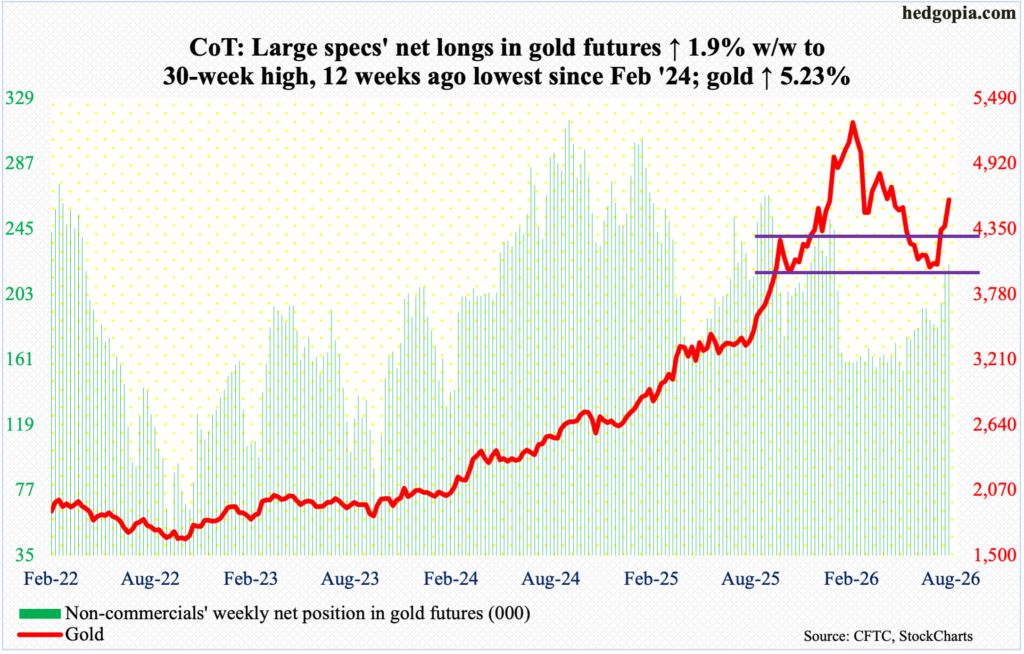
Gold went from $3,312 in August last year – and $1,810 in October 2023 – to a peak of $5,608 on January 29 this year. The drop since that record found support at $3,900-$4,000 for six consecutive weeks in June-July before it broke out two weeks ago. This week, gold bugs added to that breakout by rallying the metal 5.2 percent to $4,604/ounce – past the 200-day ($4,502).
Non-commercials are convinced the current momentum has staying power, accumulating net longs that are the highest in 30 weeks.
Immediately ahead, there is horizontal resistance at $4,640s and support at $4,450s.
Nasdaq (mini): Currently net short 10.4k, down 28.9k.
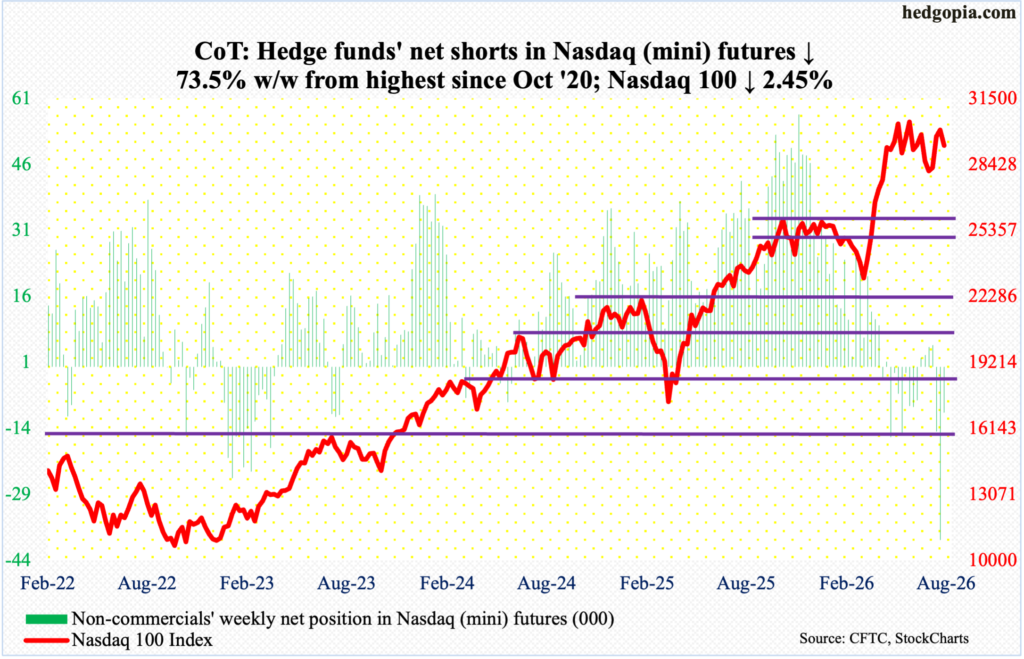
In the uptrend since bottoming at 27176 on July 29, the Nasdaq 100 failed to surpass the June 3 intraday peak of 30762, with a tag of 30196 this Monday. Other major indices like the S&P 500 and Russell 2000 posted fresh highs this month.
This week, the tech-heavy index declined 2.5 percent to 29309 – essentially right on the 50-day (29325). Odds favor a break of the average ahead. Before the index gravitates toward the July low – or the 200-day (26827), for that matter – there is horizontal support at 28200s.
On Wednesday, Nvidia (NVDA), the largest publicly traded company with a market cap of $5.3 trillion, reports its July quarter, and a lot is riding on these results – or on how they are perceived in the markets.
Russell 2000 mini-index: Currently net short 42.2k, down 89.
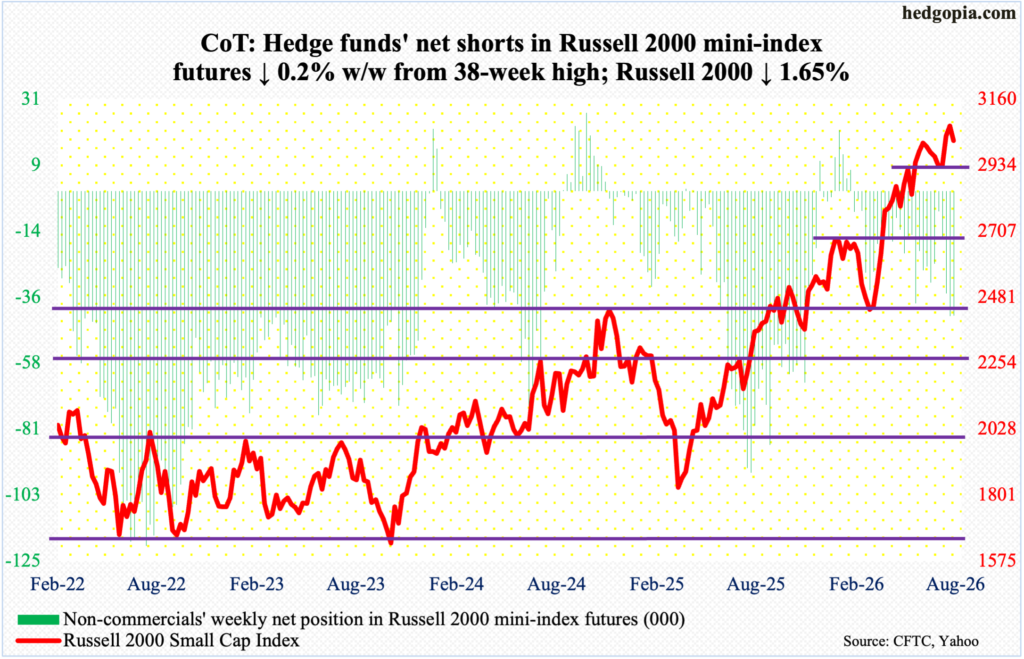
Small-cap bulls failed to hang on to last week’s feeble breakout at 3040s. This week, the Russell 2000 dropped 1.7 percent to 3018.
Last week, the small cap index squeaked past 3040s by rallying 1.1 percent to 3068, with an intraday high of 3070 tagged on the 14th. This was barely enough to surpass the prior high of 3049 set on the 5th this month as well as horizontal resistance at 3040s going back to early last month. Since hitting 3047 on July 1, the index had been caught in a pattern of lower highs for four weeks before the downward trend was broken two weeks ago.
With this week’s move, bears are probably once again eyeing 2940s, and then 2880s, which both acted as decent resistance in the recent past.
US Dollar Index: Currently net long 19.1k, down 2.3k.
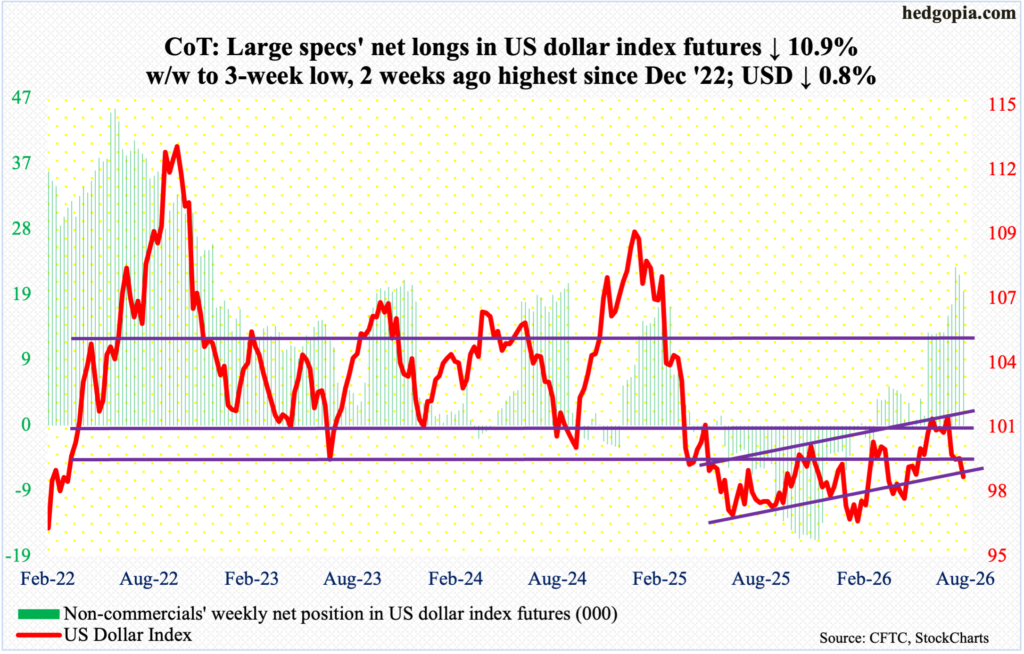
Last week’s subtle breach of a rising trendline from January 27 when the US dollar index troughed at 95.55 cost the bulls more this week as the index shed 0.8 percent to 98.84.
The index has been under pressure since getting rejected at 101-102 for six weeks in a row in June-July. The significance of 100 – or just north of it – goes back to March 2015.
Even earlier, in January last year, after a three-plus-month rally, the US dollar index reversed hard at 110.18, subsequently reaching 96.38 in June and successfully testing that low with a lower low 96.22 in September, followed by the January low.
This week’s decline cost the index the 200-day (99.17). There is decent horizontal support at 97.60s.
VIX: Currently net short 89.4k, up 14.5k.
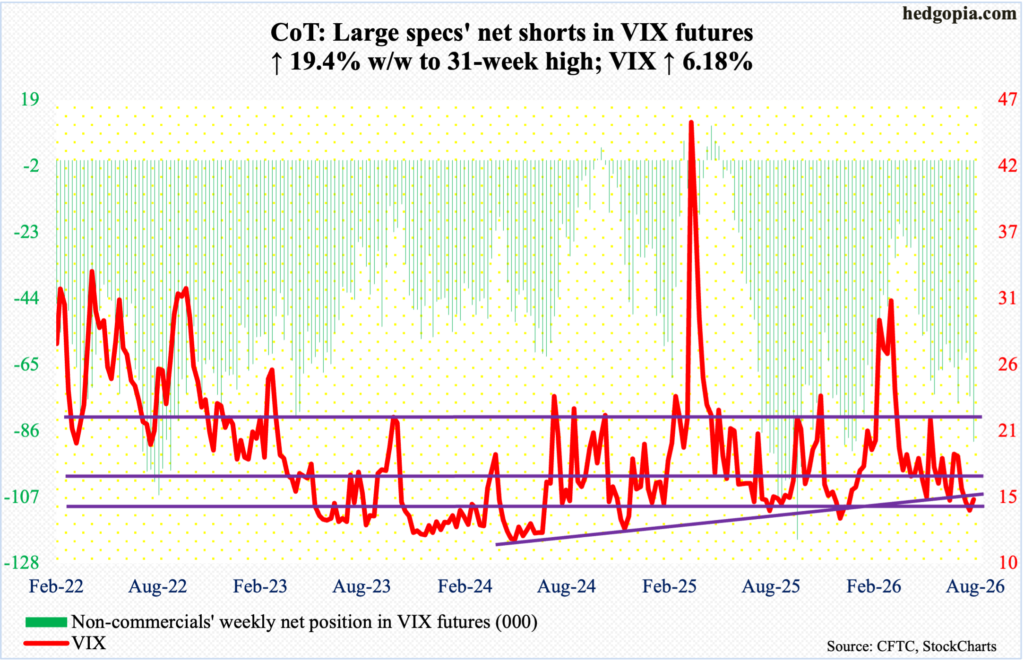
After four down weeks, VIX was up 0.88 points this week to 15.13 but finished significantly below Thursday’s weekly high of 16.14.
Last week, the volatility index came close to breaking 14, with a weekly low of 14.18 reached on the 14th. The last time VIX went sub-14 was last December.
As well, 43, or thereabouts, on weekly RSI has not been broken for nearly three years now. This was again the case as the metric finished the week at 45.18. But for sustained momentum to evolve for volatility, VIX needs to decisively take out the median.
Thanks for reading!
