
Following futures positions of non-commercials are as of August 25, 2026.
10-year note: Currently net short 839k, down 108k.
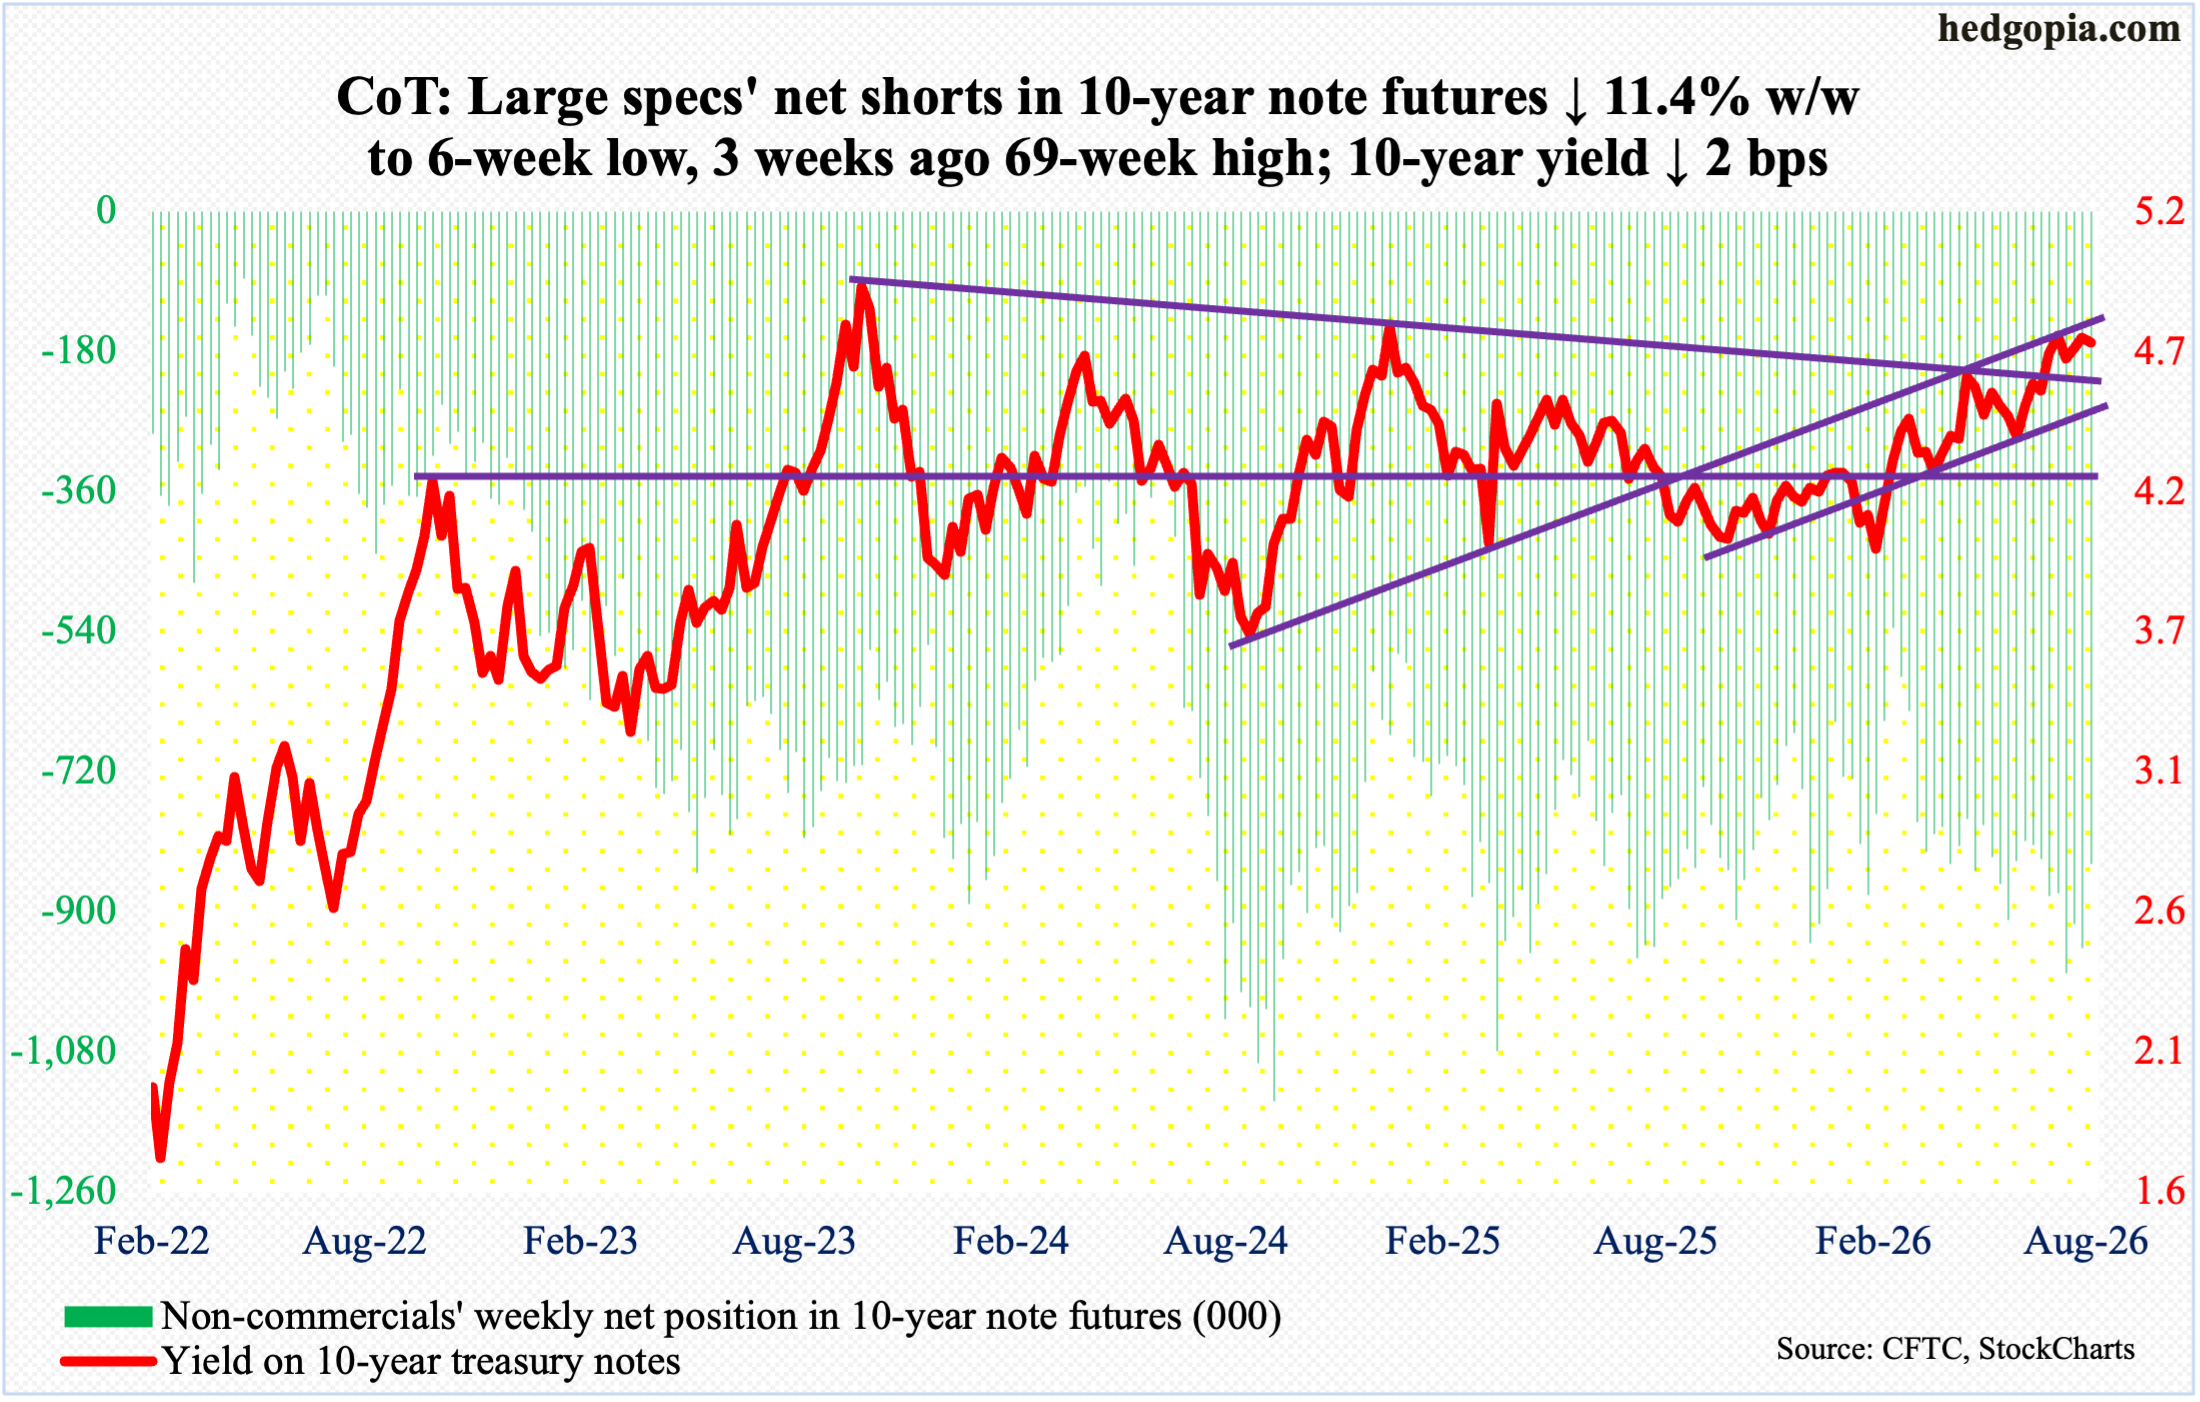
Once again, futures traders have brought rate-hike expectations forward to September (15-16) from December (8-9), with the probabilities for a quarter-point hike in two weeks’ time going up to 57 percent, up from 35 percent on Thursday. The fed funds rate has been left unchanged at a range of 3.5 percent to 3.75 percent since last December.
Traders’ outlook changed after newly appointed Federal Reserve Chairman Kevin Warsh delivered his 10AM Friday keynote speech at the Jackson Hole Symposium. Warsh painted a very positive picture of the U.S. economy and was adamant that inflation remains too high. Consumer inflation has persisted over the central bank’s stated goal of two percent for over five years now.
Warsh sounded like a man itching to raise rates. “While this summer’s readings were better than expected, they do not tell me that underlying trends have meaningfully improved,” he spoke of inflation.
The door to a hike next month has been opened, and it will probably take a significantly softer reading in August’s CPI (consumer price index), due out on the 11th, for the FOMC (Federal Open Market Committee) not to move. In the 12 months to July, headline and core CPI respectively increased 3.4 percent and 2.5 percent, with each setting four-month lows.
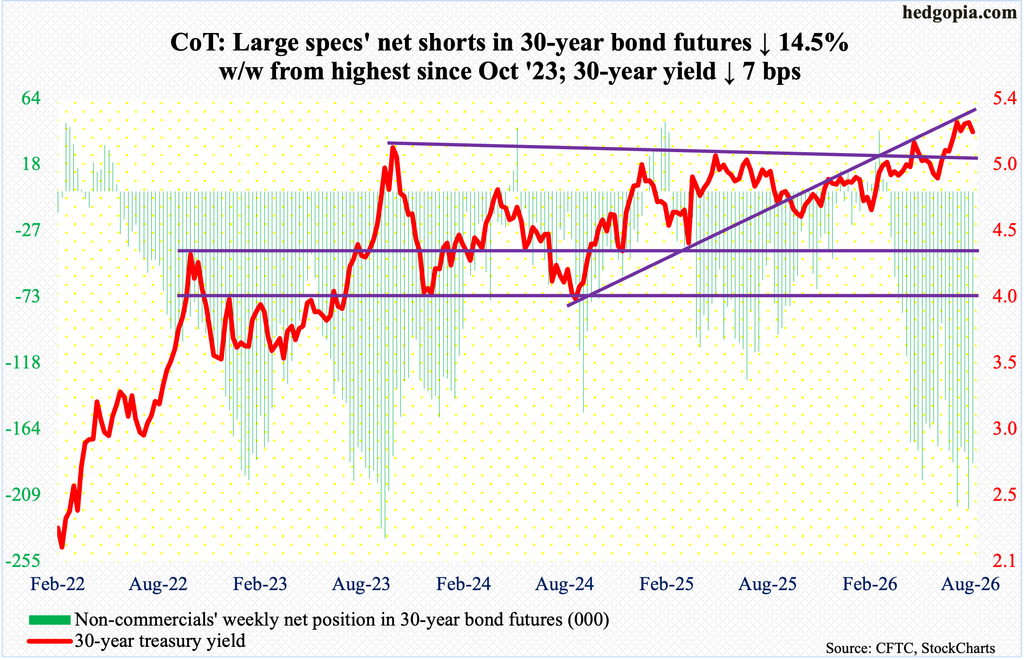
30-year bond: Currently net short 187.2k, down 31.8k.
Major U.S. economic releases for next week are as follows.
The ISM manufacturing PMI (August) and job openings (JOLTs, July) are due out Tuesday.
In July, manufacturing activity increased 2.3 percentage points month over month to 55.6 percent, which was the highest reading since May 2022. This also represented the seventh straight monthly expansion following a 10-month contraction.
June non-farm job openings shrank by 178,000 m/m to 7.36 million – a three-month low. Last December’s 6.55 million set a 63-month low, with a record 12.3 million openings posted in March 2022.
Factory orders (July) are scheduled for Wednesday. Preliminarily, orders for non-defense capital goods ex-aircraft – proxy for business capital spending plans – rose 0.2 percent m/m in July to a seasonally adjusted annual rate of $85.9 billion, which set a record; orders jumped 12.9 percent year over year.
Thursday brings the ISM services PMI (August) and labor productivity (2Q26, revised).
Services activity in July inched up one-tenth of a percentage point m/m to 54.1 percent. This was the 74th straight month of expansion.
The first print showed non-farm output per hour grew 2.2 percent in the June quarter from a year ago. This was the slowest pace of y/y growth in four quarters.
Payroll (August) will be published on Friday. The economy lost 23,000 non-farm jobs in July. The labor market has been in deceleration since creating 214,000 jobs in March.
WTI crude oil: Currently net long 108.3k, up 3.7k.
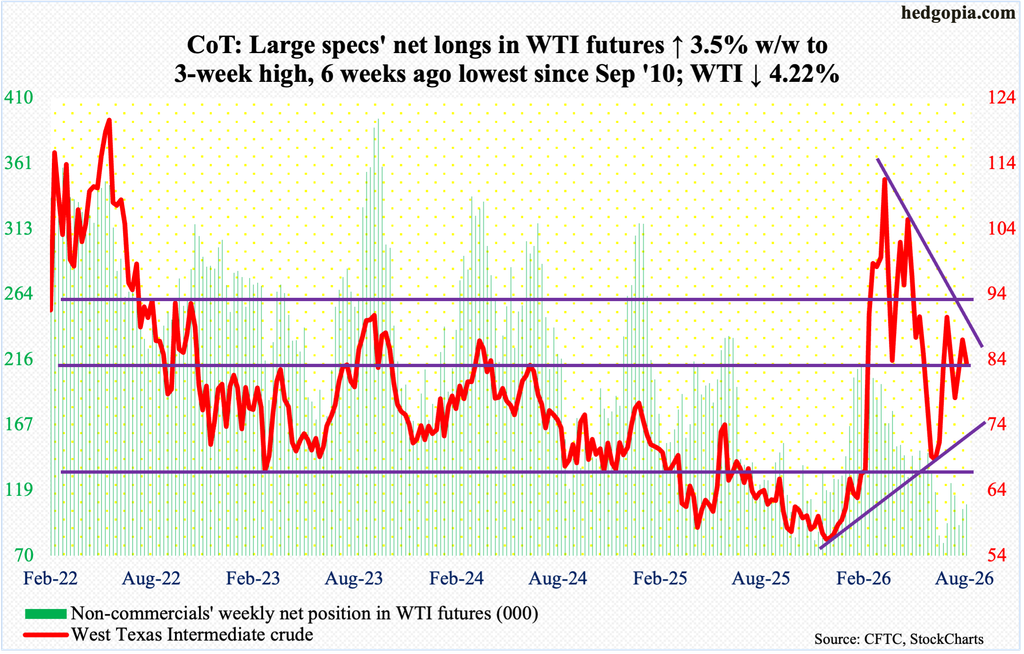
Oil bulls are doing their best to stay above both the 50- and 200-day moving averages ($79.23 and $77.97 respectively) but doing so on the defensive. The 50-day was just about tested this week with Wednesday’s intraday low of $79.62. That low was bought, but that was not enough for West Texas Intermediate crude not to give back 4.2 percent this week to $83.39/barrel.
The crude remains trapped in a pattern of lower highs since peaking on March 9 at $119.48. This followed a six-session surge starting March 2 when it gapped up in response to the February 28 U.S. and Israeli military attack on Iran. On February 27, WTI closed at $67.02, with a session high of $67.83 and a low of $64.85. Since the March peak, the crude has also been trading with higher lows. This support gets tested around $80, even as resistance from the lower highs sits at $86. Momentum likely follows whichever way it breaks.
In the meantime, as per the EIA, U.S. crude production in the week to August 21 increased 13,000 barrels per day week over week to 13.843 million b/d; in the week to July 10, production of 13.861 mb/d was only 1,000 short of the record 13.862 mb/d posted in the week to November 7 last year. Crude imports decreased 435,000 b/d to 6.2 mb/d. As did gasoline and distillate inventory, which declined 2.5 million barrels and 2.2 million barrels to 206.8 million barrels and 103.4 million barrels; crude stocks were up 95,000 barrels to 428.9 million barrels. Refinery utilization rose two-tenths of a percentage point to 97.4 percent.
E-mini S&P 500: Currently net short 68k, up 57.4k.
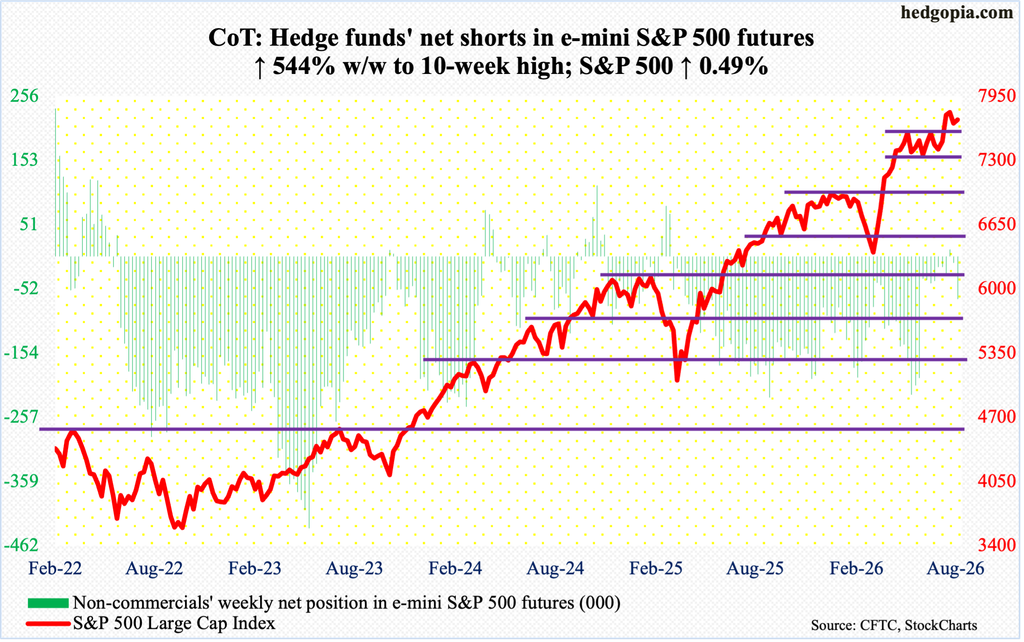
Non-commercials aggressively added to net shorts; just a couple of weeks ago, they had switched to net long.
The cash rose 0.5 percent this week to 7712 but closed substantially lower from Friday’s intraday high of 7771, with the bulls unable to hang on to the session’s gains of the first two hours.
For consolation, longs once again stepped up to buy just above crucial breakout retest at 7600-plus; Monday’s intraday low of 7638 matched the low of 7639 two sessions before that.
The S&P 500 consolidated for a couple of months after peaking at 7621 on June 2, which was eclipsed on the 4th this month, followed by a new high 7817 on the 13th. Through that high, the index was up 23.7 percent from the March 30 intraday low of 6317.
As bulls and bears are fighting for control of 7600-plus, the daily Bollinger bands are tightening – once again. When this happens, a sharp move follows – either up or down. A month ago, in late July, the bands similarly narrowed, and it resolved with a breakout past 7621 early this month. Fingers crossed what follows this time.
The weekly seems to be itching to trade lower.
Euro: Currently net short 36.4k, down 22.7k.
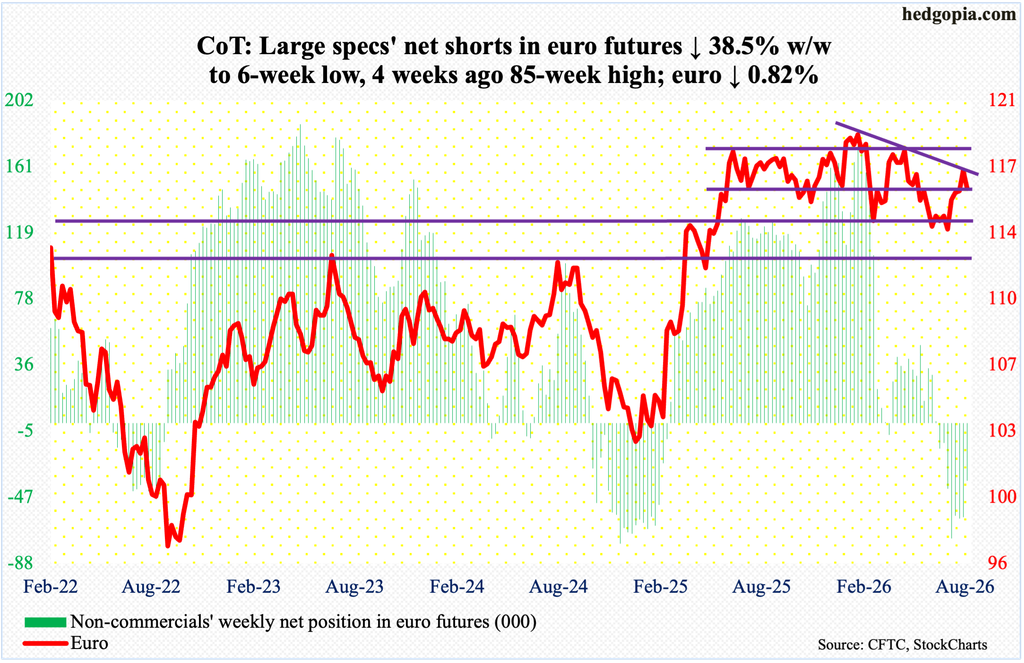
After seven sessions of staying above, the euro breached the 200-day ($1.163) this week on Friday – apparently in reaction to the Warsh speech. On Thursday and Friday last week, it tagged $1.171 intraday, which was the highest print since mid-May. This was just short of resistance at $1.18.
For more than a year, the currency went back and forth between $1.14 and $1.18, marked by a four-and-a-half-year high $1.208 posted on January 27, followed by a low of $1.141 on March 13. A declining trendline from the January high was broken three weeks ago, but nothing much came out of it.
As things stand, the 50-day rests below at $1.149, and it is likely to act as a magnet in the sessions ahead.
Gold: Currently net long 243.3k, up 21.1k.
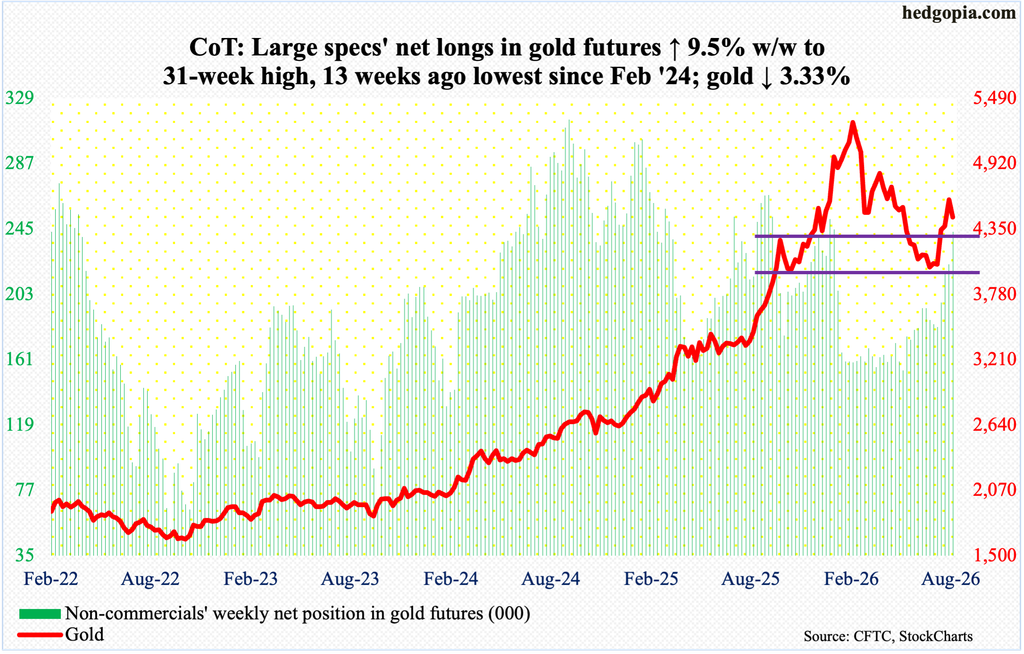
As was the case with the euro, gold fell back below the 200-day ($4,516) this week after seven sessions above it, losing 3.3 percent to $4,454/ounce. Gold bugs were unable to keep Tuesday’s intraday high of $4,697.
The metal closed this week right at horizontal support at $4,450s. A likely breach ahead opens the door toward $4,300, followed by the 50-day at $4,207.
Earlier, gold went from $3,312 in August last year – and $1,810 in October 2023 – to a peak of $5,608 on January 29 this year. The drop since found support at $3,900-$4,000 for six consecutive weeks in June-July before it broke out three weeks ago. Non-commercials, who have accumulated a decent amount of net longs and looked convinced the positive momentum had staying power, are now likely to rethink this thesis.
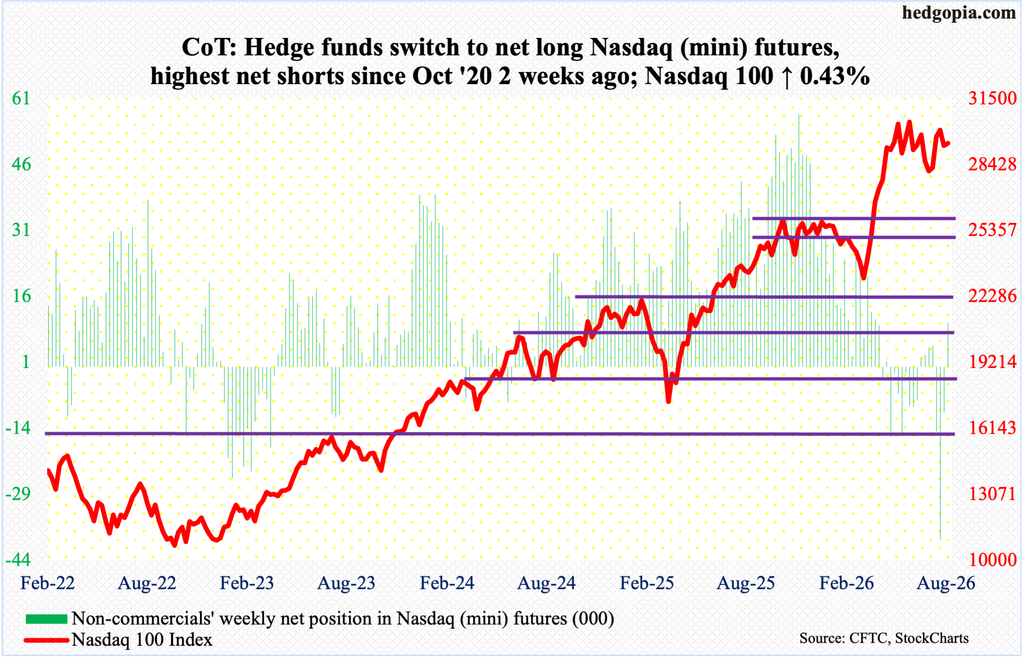
Nasdaq (mini): Currently net long 10k, up 20.5k.
Nvidia (NVDA), the largest publicly traded company with a market cap of $5.5 trillion, up from $5.3 trillion last week, delivered, not only beating on the top and bottom lines for the July quarter but guiding fiscal 2028 (ends January 2028) substantially higher – for revenue growth of 70 percent versus consensus forecast of 45 percent. Bulls nevertheless failed to rally the stock to a new high, with Thursday’s intraday high of $230.47 falling short of the prior high of $236.26 posted on May 14. Shares closed the week at $217.55. There is crucial horizontal support at $212-$213, a breach of which will have negative repercussions for both the Nasdaq 100 and the S&P 500, with NVDA accounting for eight percent of QQQ (Invesco QQQ Trust) and 7.6 percent of SPY (SPDR S&P 500 ETF).
For the week, the Nasdaq 100 was up 0.4 percent to 29433, with an intraday high of 29753 tagged on Friday. This was yet another lower high after the tech-heavy index peaked on June 3 at 30762. Other major indices like the S&P 500 and Russell 2000 posted fresh highs this month.
The Nasdaq 100 closed this week just above the 50-day (29270). Once it breaks, there is horizontal support at 28600s and then 28200s.
Russell 2000 mini-index: Currently net short 51.6k, up 9.4k.
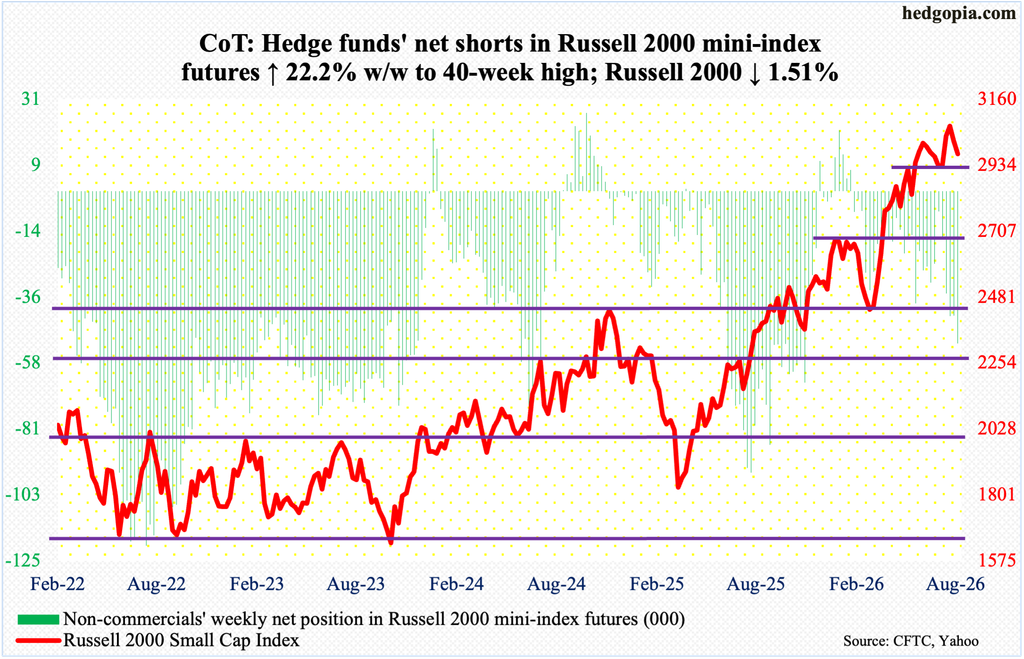
In the wake of a false breakout two weeks ago at 3040s, the Russell 2000 dropped 1.5 percent this week for a second consecutive down week, closing at 2972.
Two weeks ago, the small cap index squeaked past 3040s, with an intraday high of 3070 tagged on the 14th. It earlier hit 3047 on July 1, 3049 on the 5th and 3049 again on the 18th this month.
Now that 3040s have been lost, not to mention the 50-day at 2986, small-cap bears are probably eyeing 2940s – again – followed by 2880s.
US Dollar Index: Currently net long 18.7k, down 397.
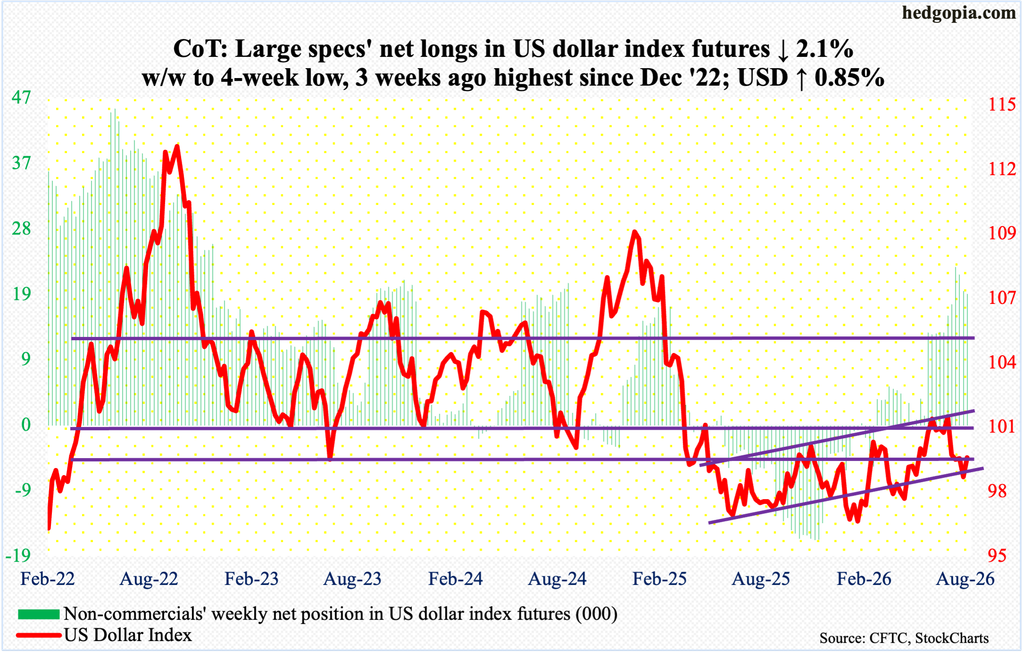
Dollar bulls this week have Warsh to be thankful for, as the latter’s tough stance on inflation Friday resulted in the session rallying 0.6 percent; for the week, the US dollar index added 0.85 percent to 99.68, reclaiming the 200-day at 99.15. The path toward the 50-day at 100.42 looks clear, and this will be an important test.
The index had been under pressure since getting rejected at 101-102 for six weeks in a row in June-July. The significance of 100 – or just north of it – goes back to March 2015.
VIX: Currently net short 78.2k, down 11.3k.
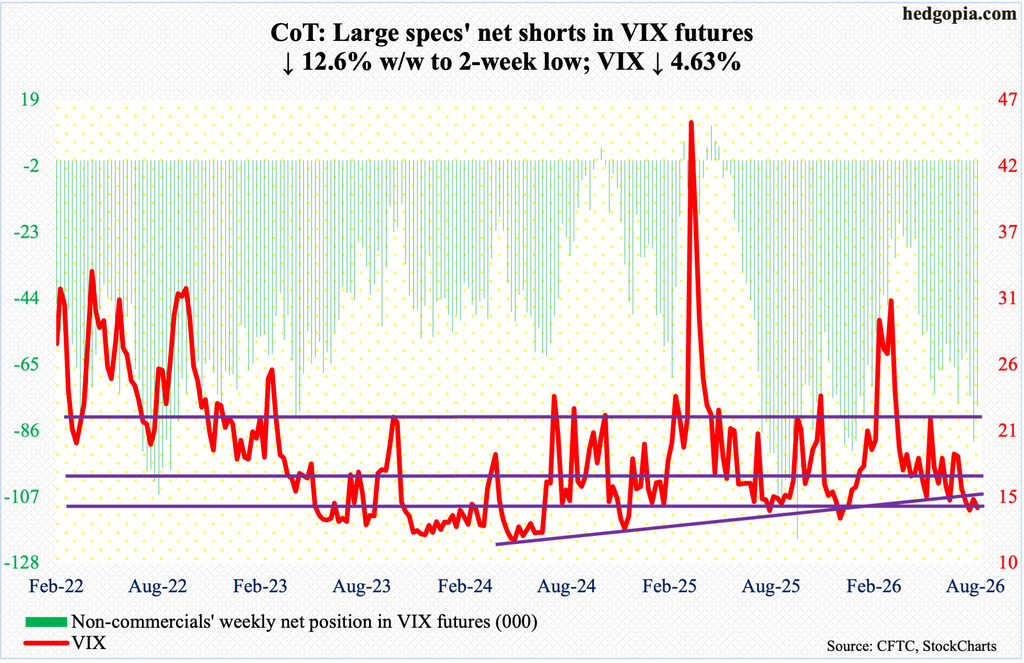
For the third week in four, VIX closed under 15. This week, it shed 0.70 points to 14.43, with Friday’s intraday low of 14.13 undercutting the prior low of 14.18 from the 14th this month. The volatility index has not gone sub-14 since last December, and it is unlikely this happens at least in the near term.
On the weekly, the RSI has not broken 43, or thereabouts, for nearly three years now. The metric closed the week at 44. But for upside momentum to sustain for volatility, VIX needs to decisively take out the median.
Thanks for reading!
