
Following futures positions of non-commercials are as of September 1, 2026.
10-year note: Currently net short 909.3k, up 70.3k.
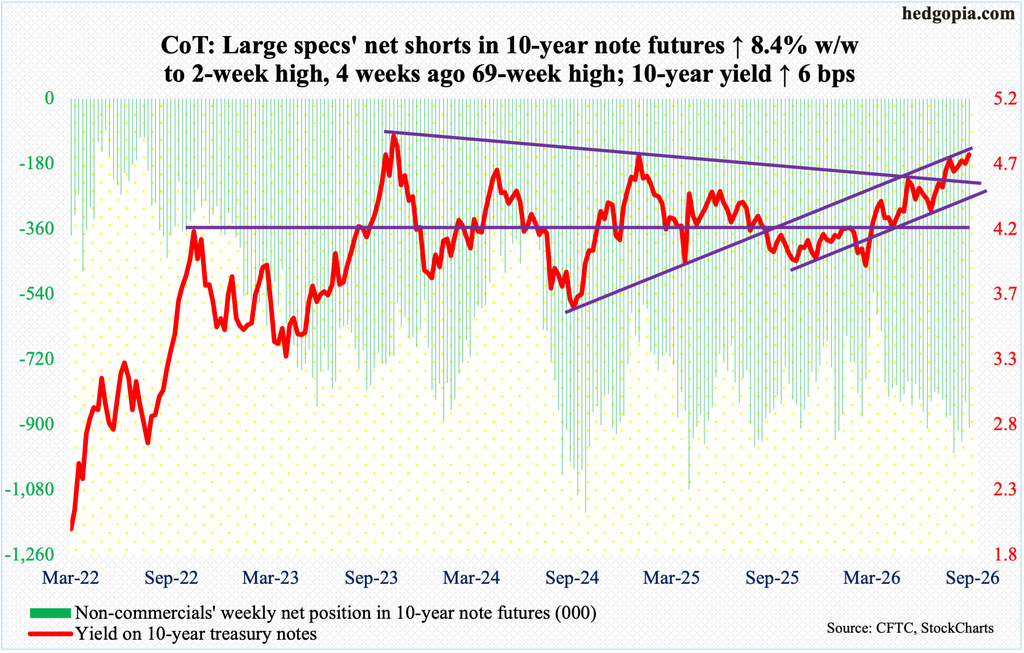
Going into the two-day FOMC (Federal Open Market Committee) meeting ending on the 16th this month, markets were laser-focused on two data points for August: Friday’s jobs report and next Friday’s CPI (consumer price index) report.
The jobs report was a blockbuster – sort of; versus where expectations were, they were. The economy last month produced 162,000 non-farm jobs; Wall Street was expecting a gain of 53,000. Plus, both June and July were revised up, with July’s previously reported negative 23,000 revised to a positive 21,000. Overall, the eight-month average this year now stands at 80,000, versus the previously reported 61,000 for the first seven months. The unemployment rate was essentially unchanged – 4.14 percent for August versus 4.09 percent for July.
Yields responded by rallying across the board – both for Friday and for the week. As per the CME’s FedWatch tool, the probabilities for a quarter-point hike in the upcoming FOMC meeting ended the week at just south of 60 percent, a few percentage points above where they were this time. The case for a hike in less than two weeks increasingly looks cut-and-dried, yet there are plenty of doves within the FOMC hoping for a soft CPI print next week just so they could justify a hold.
The fed funds rate has been left unchanged at a range of 3.5 percent to 3.75 percent since last December when it was reduced by 25 basis points; this preceded a cut of similar magnitude in September and October. Earlier, rates reached a cycle high 5.25 percent to 5.50 percent in July 2023, followed by cumulative cuts of 100 basis points over three meetings in 2024.
Rates have been pushed lower at a time when inflation – both CPI and PCE (personal consumption expenditures) – has remained above the Federal Reserve’s stated goal of two percent for over five years. In the 12 months to July, headline and core CPI grew 3.4 percent and 2.5 percent respectively, with May’s 4.3 percent and 2.9 percent at 37- and eight-month highs. Wages are not keeping up. In August, the average hourly earnings of private-sector employees increased 3.1 percent, which was the slowest year-over-year pace in just over five years; ironically, this very fact can be spun by the doves as proof of no wage pressure in the system, hence no need to tighten policy.
We will find out how things shake out in the upcoming meeting. But one thing is for sure. Even if the benchmark rates are left steady, the number of hawks will probably rise. In the July meeting, there were three dissenters.
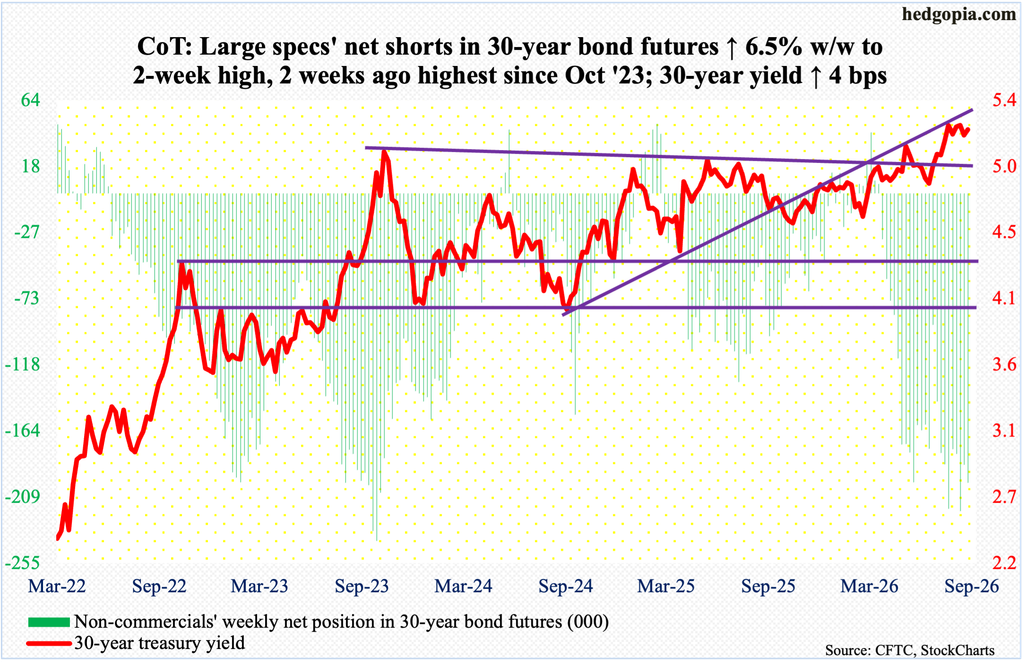
30-year bond: Currently net short 199.5k, up 12.3k.
Major US economic releases for next week are as follows. Markets are closed Monday for observance of the Labor Day.
The NFIB small business optimism index (August) will be published on Tuesday. Small-business job openings in July increased four points month over month to 36, matching a reading of June last year. May’s (this year) 29 was a six-year low.
The producer price index (August) and existing home sales (August) are scheduled for Thursday.
From a year ago, July headline and core PPI each rose 4.7 percent, respectively setting four- and three-month lows.
Sales of existing homes dropped 1.7 percent m/m in July to a seasonally adjusted annual rate of 4.06 million units – a three-month low.
Friday brings the CPI (August) and University of Michigan’s consumer sentiment index (September, preliminary).
In the 12 months to July, headline and core CPI increased 3.4 percent and 2.5 percent respectively – for four- and five-month lows, in that order.
In August, consumer sentiment declined 3.5 points m/m to 51.7 – a two-month low. May’s 44.8 set a record low.
WTI crude oil: Currently net long 105.3k, down 3k.
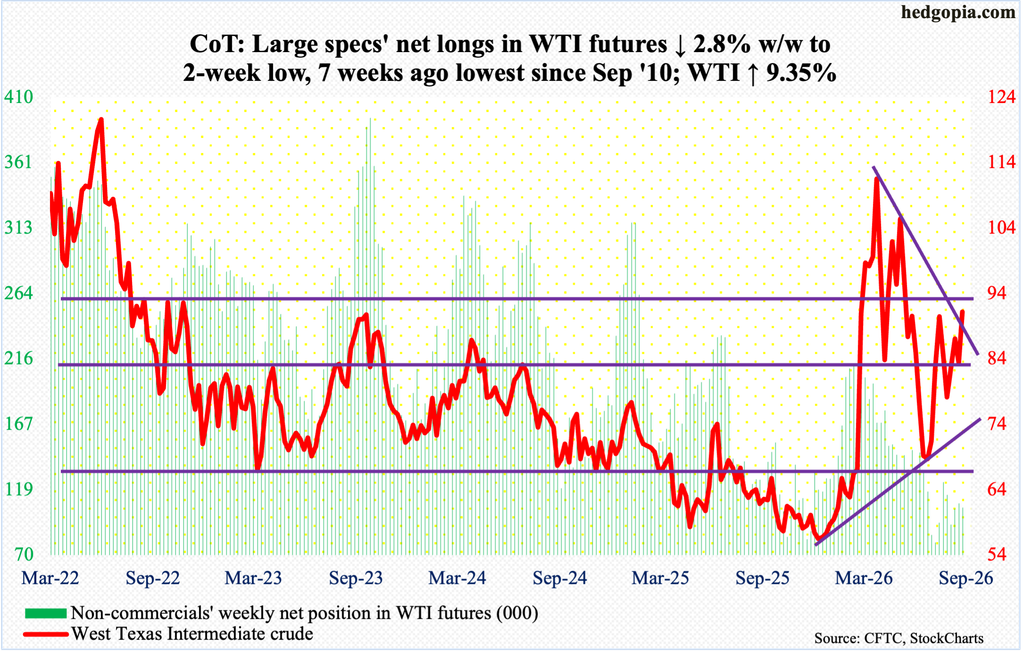
West Texas Intermediate crude broke out of trendline resistance from March 9 when it peaked at $119.48. The peak followed a six-session surge starting March 2 when WTI gapped up in response to the February 28 U.S. and Israeli military attack on Iran. On February 27, the crude closed at $67.02, with a session high of $67.83 and a low of $64.85.
WTI concurrently is struggling to push past $92-$93. This week, it jumped 9.4 percent to $91.20/barrel, with Thursday tagging $93.14 in a spinning top session. The session before that, too, formed the same candle, even as Friday produced what looks like a hanging man.
On the daily, WTI looks ready to head lower. This week’s gains comprise the third up week in four – and sixth in nine since bottoming at $67.04 on July 2.
In the event of a drawdown, there is horizontal support at $83, followed by the 50- and 200-day moving averages at $80.90 and $78.73.
In the meantime, as per the EIA, US crude production in the week to August 28 increased 19,000 barrels per day week over week to 13.862 million b/d, matching the record set in the week to November 7 last year. Crude imports rose 612,000 b/d to 6.8 mb/d. As did distillate inventory which grew 796,000 barrels to 104.2 million barrels; crude and gasoline stocks were down 4.5 million barrels and 1.2 million barrels to 424.5 million barrels and 205.7 million barrels. Refinery utilization rose six-tenths of a percentage point to 98 percent, which is the highest since August 2018.
E-mini S&P 500: Currently net short 75.9k, up 7.9k.
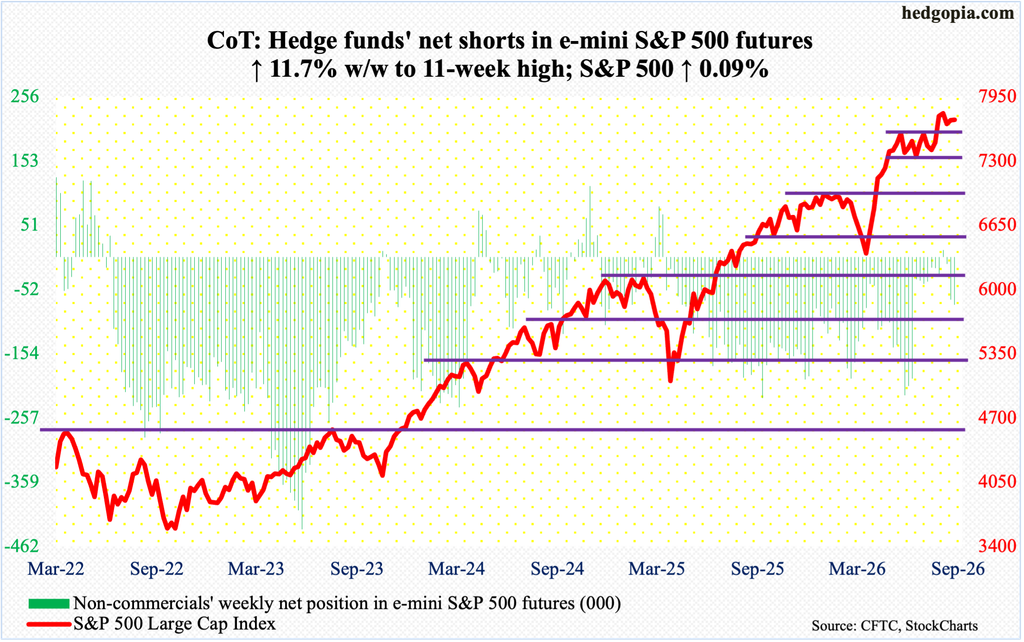
Equity bulls and bears alike defended their turf this week, as the S&P 500 edged up 0.1 percent to 7719. Thursday’s intraday high 7757 kissed the underside of a falling trendline from August 13 when the large cap index retreated after tagging 7817. Tuesday’s intraday low 7611, on the other hand, was a successful retest of August 4 breakout past 7600-plus.
The S&P 500 earlier consolidated for a couple of months after peaking at 7621 on June 2. Through that high, the index jumped 23.7 percent from the March 30 intraday low of 6317.
The daily Bollinger bands remain very tight. When this happens, a sharp move follows, which can go either direction. A month ago, in late July, the bands similarly narrowed, and it resolved with a breakout past 7621 early last month. With continued defense of 7600-plus, bulls deserve the benefit of the doubt, but only as long as this support holds.
Non-commercials, in the meantime, continue to add to net shorts, with holdings at an 11-week high.
Euro: Currently net short 24.9k, down 11.4k.
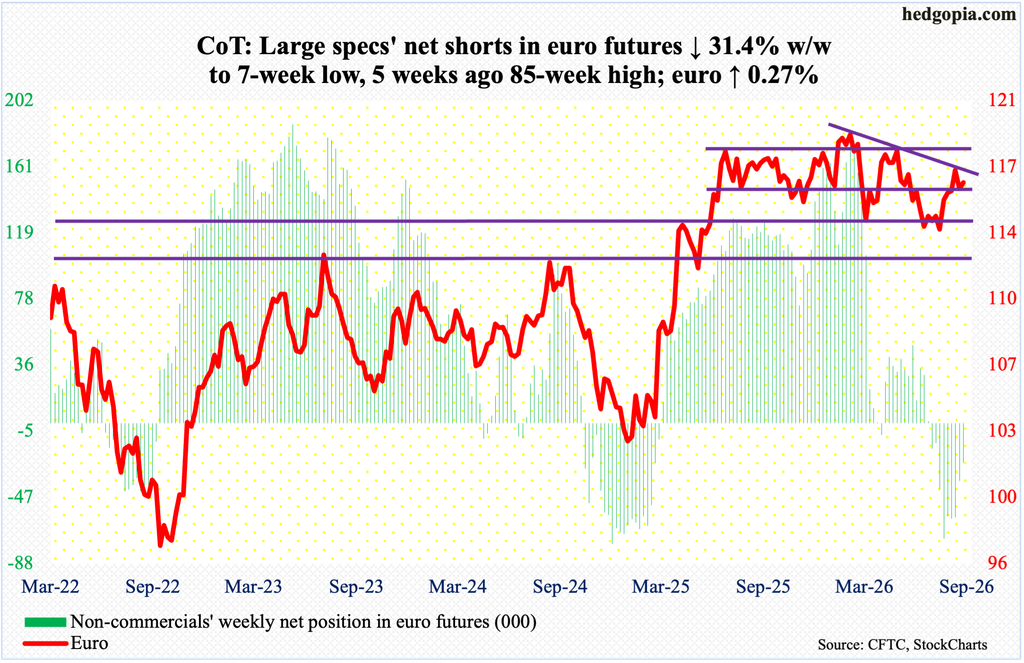
After losing the 200-day ($1.163) on Friday last week, the euro sought to reclaim the average this week, but unsuccessfully. Thursday, it ticked $1.164 intraday, but only to close the week at $1.1615, up 0.3 percent. This was the fifth up week in six.
The currency rallied from $1.135 on July 28 to $1.171 on August 20, which was the highest print since mid-May. This was just short of resistance at $1.18.
For more than a year, the euro went back and forth between $1.14 and $1.18, marked by a four-and-a-half-year high of $1.208 posted on January 27, followed by a low of $1.132 on June 24. A declining trendline from the January high was broken four weeks ago, but euro bulls have been unable to resolutely build on it.
The 50-day rests underneath at $1.151.
Gold: Currently net long 228.1k, down 15.2k.
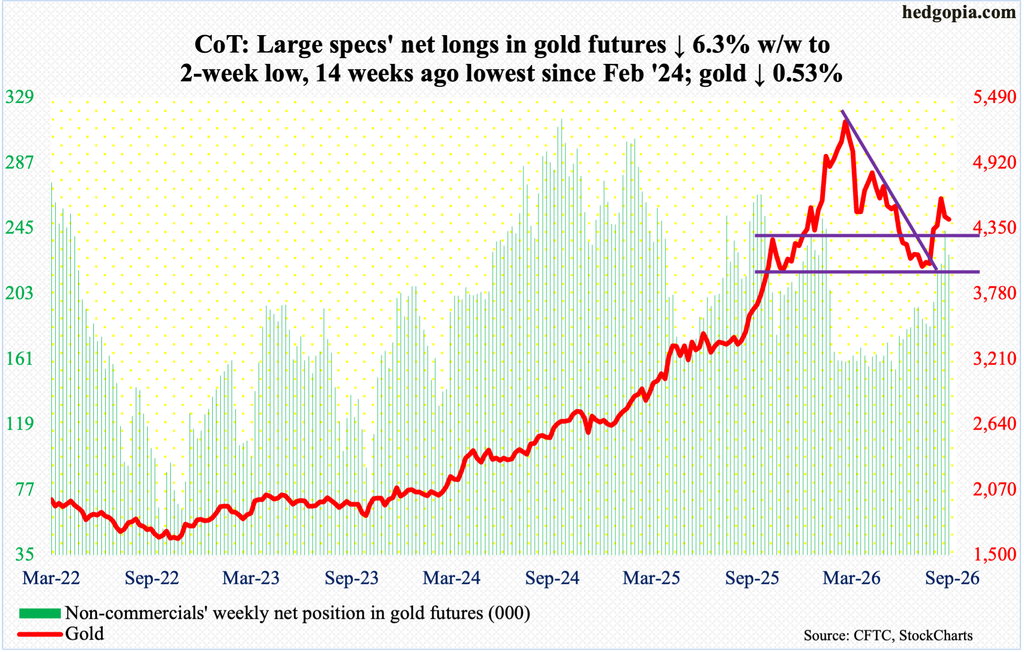
Last Friday, gold sliced through the 200-day ($4,524). This week, gold bugs sought to reclaim the average on Thursday when the metal ticked $4,511 but could not quite pull it off, with the week ending lower 0.5 percent to $4,429/ounce – just below horizontal support at $4,450s, a decisive breach of which opens the door toward $4,300, followed by the 50-day at $4,237.
Earlier, gold went from $3,312 in August last year – and $1,810 in October 2023 – to a peak of $5,608 on January 29 this year. The drop since found support at $3,900-$4,000 for six consecutive weeks in June-July before it broke out three weeks ago. That momentum seems to have hit the wall – at least for now.
From longs’ perspective, non-commercials, who have accumulated a decent amount of net longs, better not be losing patience and begin to reduce holdings.
Nasdaq (mini): Currently net long 25.9k, up 15.9k.
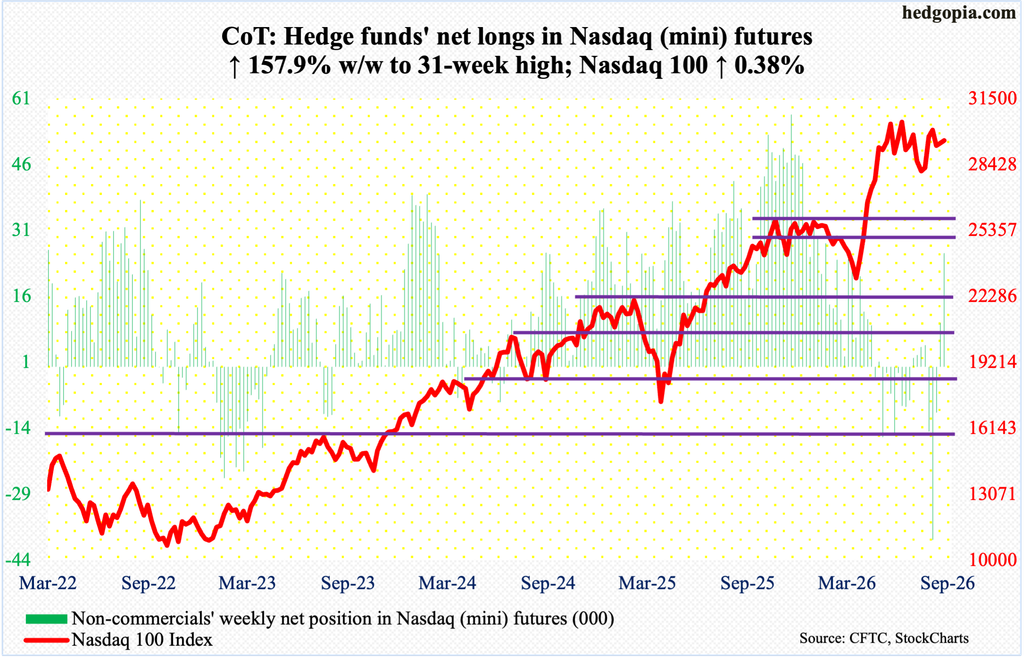
The Nasdaq 100 is yet to see an end to a pattern of lower highs since it peaked on June 3 at 30762. Other major indices like the S&P 500 and Russell 2000 posted fresh highs last month. The Nasdaq 100 remains under its June peak, with trendline resistance from that high at 30000. This week, the tech-heavy index rose 0.4 percent to 29544, recapturing the 50-day at 29229.
At this juncture, bulls cannot afford to lose 28600s; this week’s low was 28953, set on Tuesday.
Russell 2000 mini-index: Currently net short 71.7k, up 20.1k.
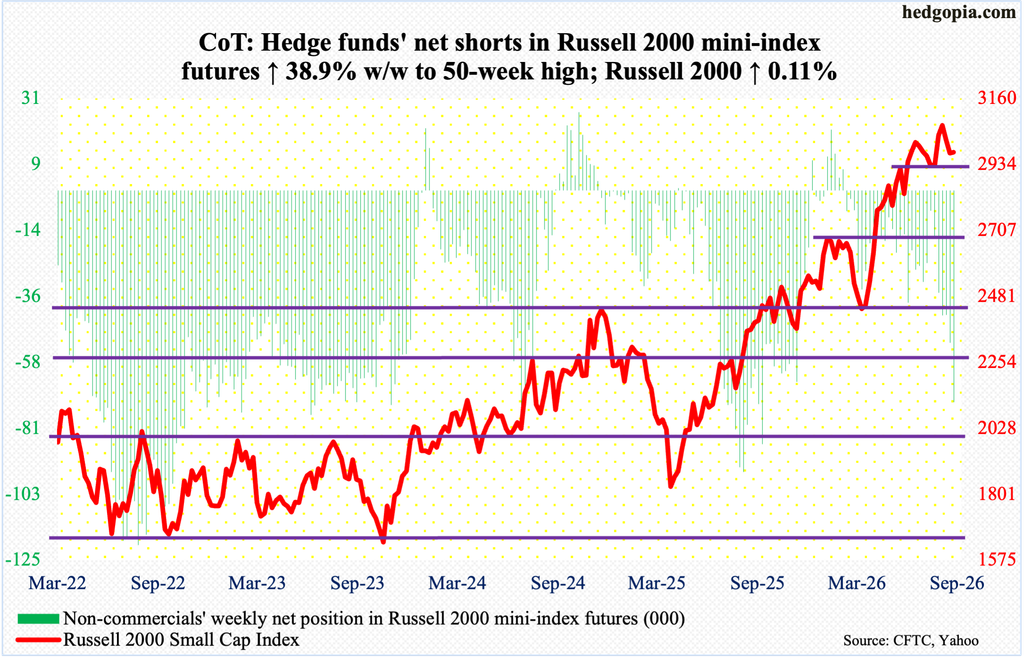
On Friday last week, the Russell 2000 breached the 50-day (2988). It remained under the average this week, despite edging up 0.1 percent to 2976.
The small cap index also obviously remains under 3040s, which it had falsely broken out of three weeks ago. It earlier hit 3047 on July 1, 3049 on August 5 and 3049 again on the 18th.
Following this, bears this week succeeded in pushing the index below horizontal support at 2940s, but only temporarily as Tuesday’s intraday drop to 2917 was bought. Bulls face hurdle at the 50-day, which coincides with trendline resistance from August 14 when the index peaked at 3070 on August 14.
US Dollar Index: Currently net long 17k, down 1.7k.
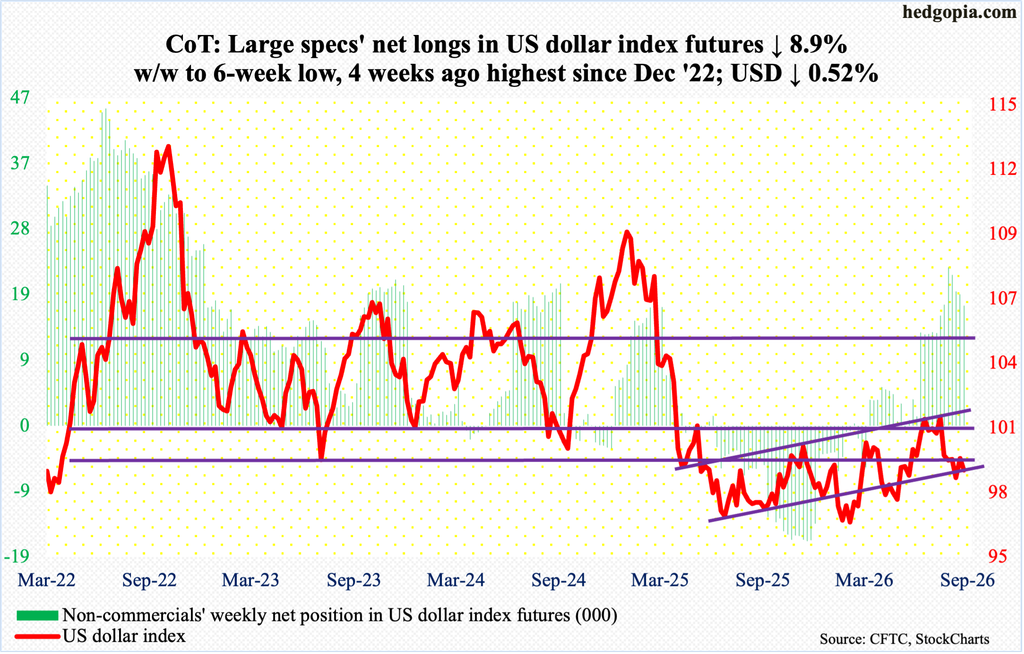
Last week’s 0.6-percent rally on the back of Fed Chair Kevin Warsh’s tough talk on inflation at Jackson Hole Symposium proved fleeting, as the US dollar index gave back 0.5 percent this week to 99.16. Dollar bulls were unable to keep Wednesday’s intraday high of 99.86. The index retreated this week well before testing the 50-day at 100.22; the 200-day sits at 99.14.
The US dollar index had been under pressure since getting rejected at 101-102 for six weeks in a row in June-July. The significance of 100 – or just north of it – goes back to March 2015. For three weeks in a row, the index has now witnessed selling just south of 100.
VIX: Currently net short 84.2k, up 6k.
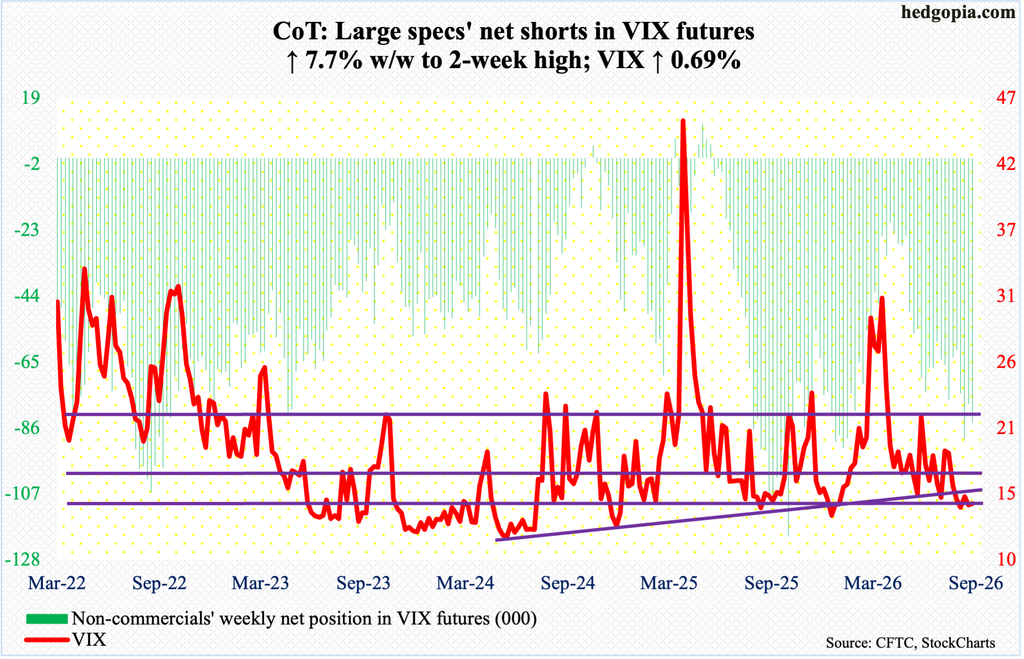
On Friday, VIX went sub-14 intraday tagging 13.80 but rallied to close at 14.53, up 0.10 points for the week. This was the first time since last December when the volatility index traded with the 13 handle.
Concurrently, on the weekly, the RSI closed at 44.23. For nearly three years now, this metric has not broken 43, or thereabouts. Odds favor the streak continues in the near future. That said, for upside momentum to develop, VIX needs to decisively take out the median, which last occurred in early February.
Thanks for reading!
