
Following futures positions of non-commercials are as of September 22, 2026.
10-year note: Currently net short 811.8k, down 9.5k.
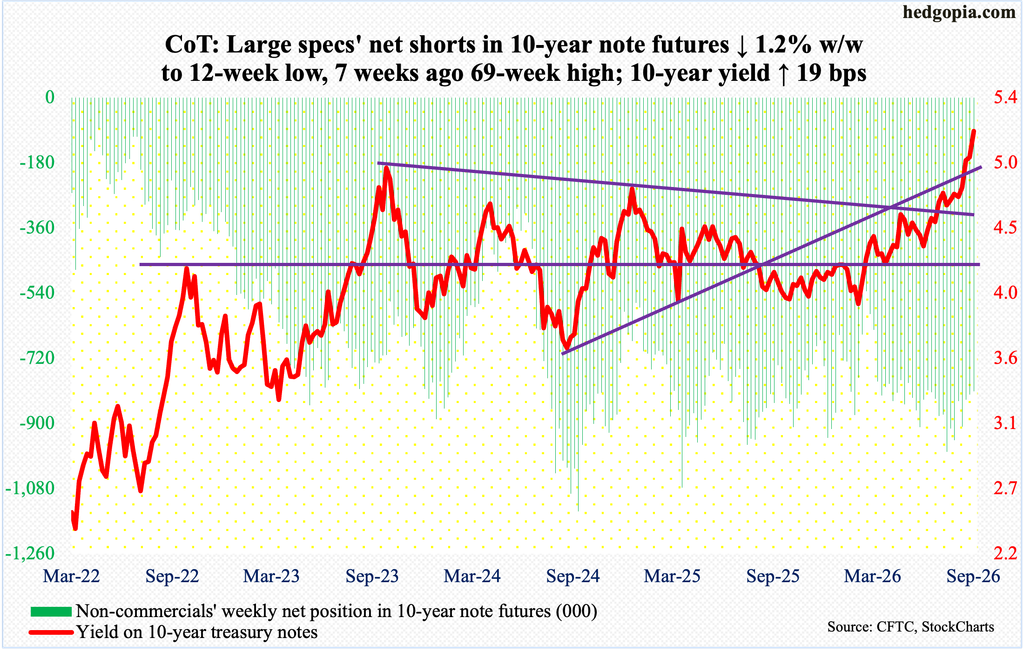
Lateral support at 4.75s on the 10-year treasury yield was never tested, with this week’s low taking place at 4.93 percent on Tuesday. When it was all said and done, these notes were yielding 5.18 percent at the end of the week, with Friday ticking 5.23 percent, which was the highest since June 2007.
The 10-year has been on a roll since February this year when it bottomed at 3.96 percent. Since that low, the yield has rallied in six of the seven months. With three sessions remaining this month, the 10-year has surged 43 basis points – past the October 2023 high of five percent (4.997 percent, to be exact).
On both the daily and weekly, the 10-year remains overbought, but it has been that way for some time now. In the event some of these overbought conditions gets unwound, what happens at five percent will decide if there is a new leg higher or the yield proceeds toward 4.75s, with the 50-day moving average at 4.77 percent.
For whatever it is worth, non-commercials doggedly remain bearish, betting on higher rates.
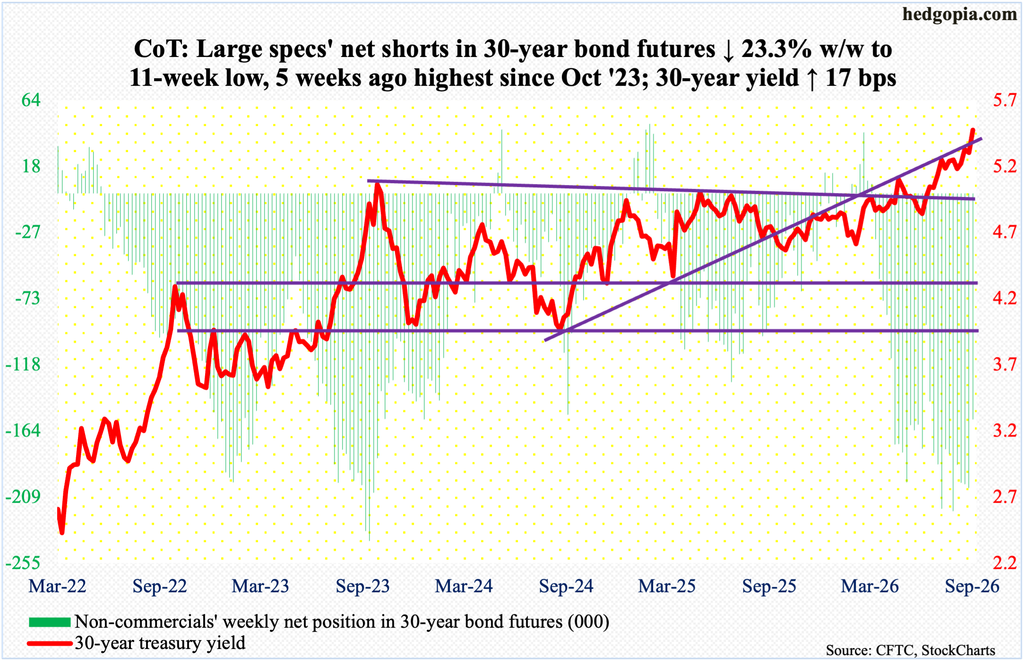
30-year bond: Currently net short 155.8k, down 47.4k.
Major US economic releases for next week are as follows.
The S&P Cotality Case-Shiller home price index (July) and job openings (JOLTs, August) will be published Tuesday.
In June, home prices nationally rose 1.5 percent from a year ago. March’s 0.8 percent was the slowest year-over-year price appreciation since June 2023.
Non-farm job openings in June increased 89,000 month over month to 7.27 million – a two-month high. Last December’s 6.55 million set a 63-month low.
GDP (2Q26, 3rd estimate), corporate profits (2Q26, revised) and personal income/spending (August) are on schedule for Wednesday.
Real GDP grew 1.5 percent in the June quarter, the second estimate showed.
Corporate profits adjusted for inventory valuation and capital consumption shot up 22.8 percent y/y in the June quarter to a seasonally adjusted annual rate of $4.83 trillion – a record. This was the fastest pace of 12-month growth in 18 quarters.
The ISM manufacturing PMI (September) is due out Thursday. Manufacturing activity in August fell a percentage point m/m to 54.6 percent. This represented the eighth consecutive month of expansion following a 10-month contraction.
In the 12 months to July, headline and core PCE (personal consumption expenditures) respectively grew 3.7 percent and 3.3 percent – a four-month low and a two-month high, in that order.
Friday brings payrolls (September) and factory orders (August).
In August, the economy created 162,000 non-farm jobs, which were much better than expected, putting the monthly average so far this year at 80,000, up from the 2025 average of 10,000.
August orders for non-defense capital goods ex-aircraft – proxy for business capital spending plans – were up 1.6 percent m/m to $87.6 billion (SAAR), which set a fresh record; from a year ago, orders spiked 14.1 percent, for a five-year high.
WTI crude oil: Currently net long 134.6k, up 16.5k.
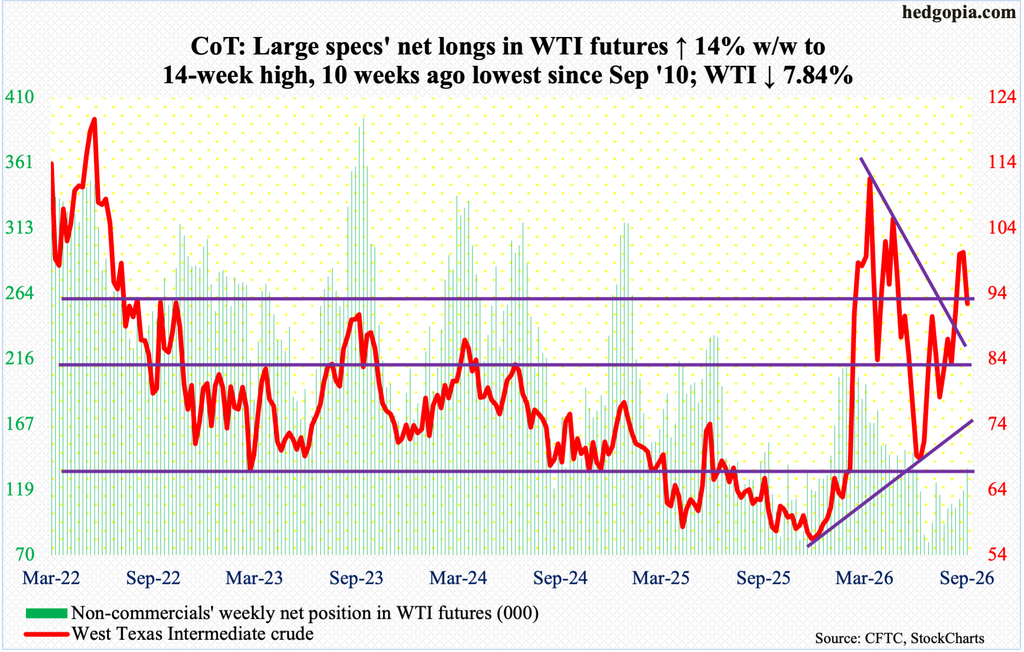
West Texas Intermediate crude gapped down on Monday, but oil bears failed to make the most out of it. Bulls showed up in the next two sessions just above the 50-day ($87.84), with a tag of $88.67 on Tuesday and $88.71 on Wednesday. For the week, nevertheless, the crude dropped 7.8 percent to $92.44/barrel.
WTI has come a long way since July 2 when it bottomed at $67.04, filling a gap from March 2 when the crude had a six-session surge in the wake of the February 28 US and Israeli military attack on Iran. On February 27, WTI closed at $67.02, with a session high of $67.83 and a low of $64.85.
Most recently, the crude has come under pressure since the 15th when it ticked $106.75 and headed lower. Loss of horizontal support at $92-$93 will open the door to a test of the 50-day, followed by the 200-day at $81.42.
With three sessions to go, September represents the third consecutive up month but is on the way to forming a potentially bearish shooting star.
In the meantime, as per the EIA, US crude production in the week to September 18 dropped five million barrels per day week over week to 13.939 mb/d; two weeks ago, or in the week to September 4, a record 13.947 mb/d was produced. Crude imports declined 1.2 mb/d to 5.88 mb/d. As did gasoline and distillate inventory, which respectively fell 1.7 million barrels and 428,000 barrels to 206 million barrels and 107.4 million barrels; crude stocks were up three million barrels to 426.4 million barrels. Refinery utilization shrank 2.8 percentage points to 94 percent; three weeks ago, utilization at 98 percent was the highest since August 2018.
E-mini S&P 500: Currently net short 133.2k, up 32.8k.
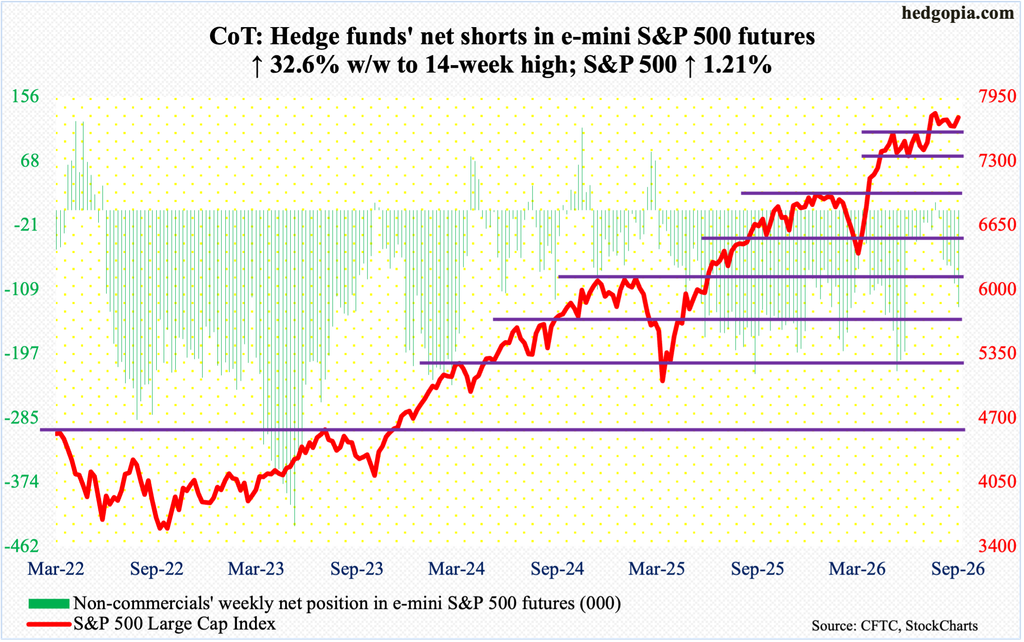
On August 13, the S&P 500 ticked 7817 intraday and headed back down. A pattern of lower highs since that peak was broken this week, as the large cap index rallied 1.2 percent to 7743. This preceded defense of 7600-plus for five successive weeks.
Earlier, the S&P 500 consolidated for a couple of months after peaking at 7621 on June 2, with a breakout on August 4. Thus far, a retest of this breakout has gone the bulls’ way. At Tuesday’s session high 7782, the index was merely 0.4 percent from the August 13 peak; with the bulls not able to cling on to that high, the index finished the week one percent away.
As things stand, the August high is the path of least resistance.
Euro: Currently net short 52.3k, up 25.3k.
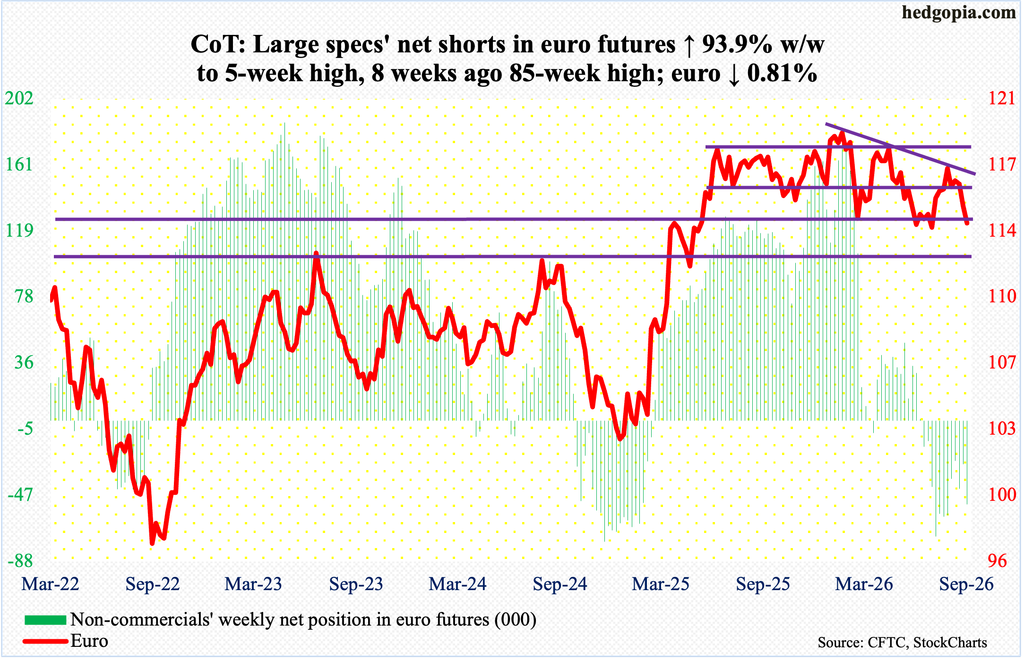
The euro is on the verge of breaking crucial support.
For more than a year, the currency went back and forth between $1.14 and $1.18, marked by a four-and-a-half-year high $1.208 on January 27 this year, followed by a low of $1.132 on June 24. A declining trendline from the January high was broken seven weeks ago, but euro bulls failed to build on it.
Last week, the euro sliced through the 50-day ($1.154). This week, it declined in four of the five sessions, losing 0.8 percent to $1.139. There is still time for euro bulls to salvage the situation and save $1.14.
The daily is indeed deeply oversold, so a rally is possible, in which case the nearest resistance lies at $1.145s.
Gold: Currently net long 225.9k, down 4.5k.
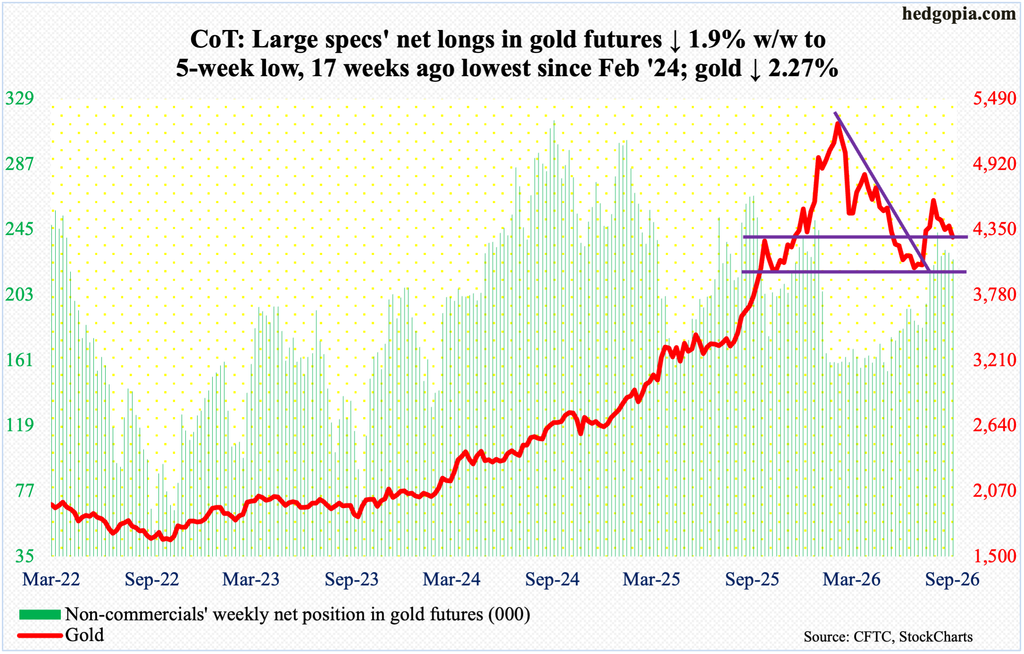
Gold bugs this week not only failed to save the 50-day ($4,310) but also horizontal support at $4,370s-$4,380s. The metal dropped 2.3 percent to $4,284/ounce.
The risk facing the bulls is that gold continues lower toward $3,900-$4,000, which is where it found support at for six consecutive weeks in June-July before turning up. Earlier, gold went from $3,312 in August last year – and $1,810 in October 2023 – to a peak of $5,608 on January 29 this year.
After the metal bottomed at $3,900-$4,000 in June-July, it rallied to tick $4,697 intraday on August 25 and reversed lower; it has now been down in four of the five weeks, with odds of continued downward momentum rising.
Nasdaq (mini): Currently net long 56.2k, up 22.4k.
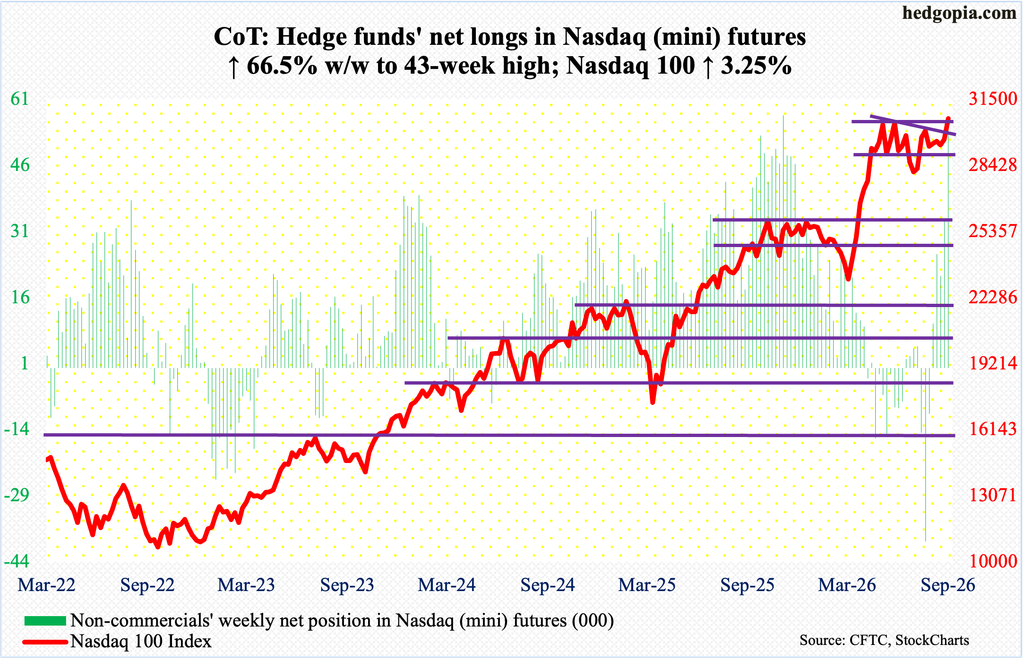
At long last, the Nasdaq 100 succeeded in taking out its June high, but barely. Unlike other major indices like the S&P 500 and Russell 2000, which posted fresh highs in August, the Nasdaq 100 continued to trade under the June 2 intraday high of 30762 – until Tuesday this week when it ticked 30771. The tech-heavy index finished the week up 3.3 percent to 30608.
This week’s gap-up gains followed last week’s defense of horizontal support at 28600s-28800s. Bulls have the ball as we speak. It is their loss if they cannot build on this momentum and mount a clean breakout.
Russell 2000 mini-index: Currently net short 75.8k, up 3.4k.
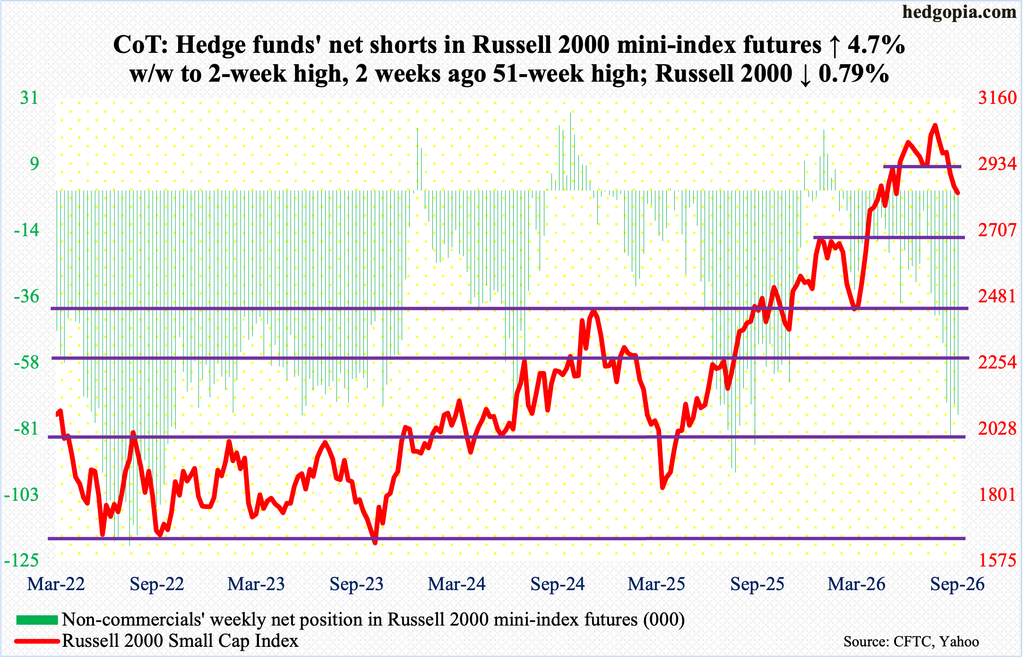
Unlike large-cap indices, small-caps continued to trade lower this week. The Russell 2000 gave back 0.8 percent to 2838. This was the third consecutive down week – and fifth in six.
The small cap index has been on the defensive since peaking at 3070 on August 14. This week’s loss comes on the heels of last week’s breach of horizontal support at 2880s. Two weeks ago, lateral support at 2940s was compromised. Even earlier, six weeks ago, there was a false breakout at 3040s, as the August 14 high was given back in no time.
The 50-day (2958) has been breached, and the 200-day (2775) lies underneath, with the latter potentially acting as a magnet should bids not show up next week in defense of trendline support from March 30 when the index bottomed at 2405; Thursday’s intraday low 2811 kissed that support.
US Dollar Index: Currently net long 10.3k, down 263.
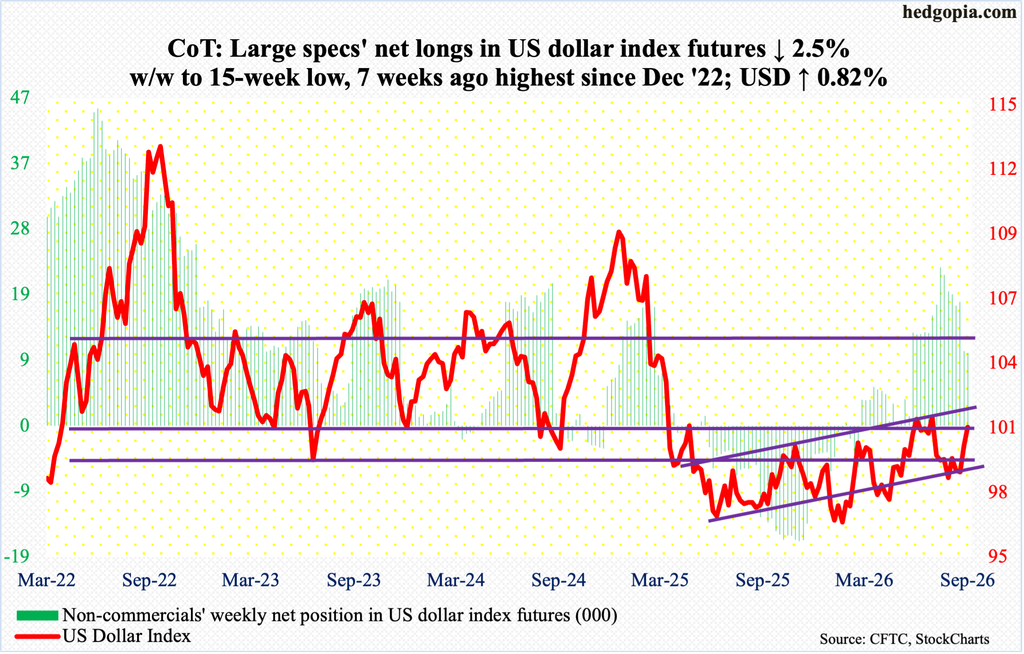
The US dollar index acts like it wants to seriously test the strength of 101-102, which stood like a rock for six weeks in a row in June-July. Subsequently, it bottomed at 98.56 on August 20; and since September 9 when the index tagged 98.60, it has just about gone parabolic, reclaiming both the 50- and 200-day (respectively 99.90 and 99.23).
This week, the US dollar index touched 101.40 intraday Thursday, before ending the week at 101.04, up 0.8 percent for the week.
The daily is getting extended. There is always a chance that the index comes under pressure near term, finds support at the 50-day and then regains strength toward the June-July high. The 50-day approximates 100, where support goes back to March 2015.
VIX: Currently net short 79.3k, down 7.3k.
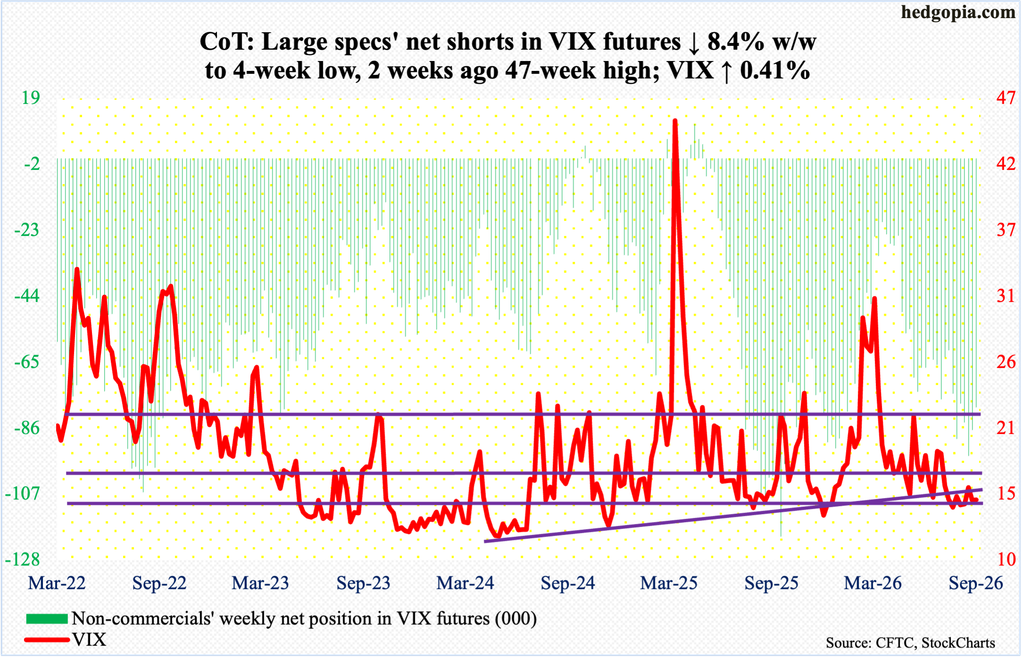
It was one of those weeks in which both the S&P 500 and VIX rallied, although the volatility index was barely up, up 0.06 points to 14.87. On Wednesday, VIX fell as low as 14.12.
Volatility bulls’ defense of the low-14s bodes well for them. It would be ideal if the weekly RSI concurrently tested 43, or thereabouts, which has not been broken for nearly three years now, but that did not happen, with the metric ending the week at 45.31, a touch higher than a week ago.
Thanks for reading!
