
Following futures positions of non-commercials are as of October 6, 2026.
10-year note: Currently net short 896.5k, down 4.1k.
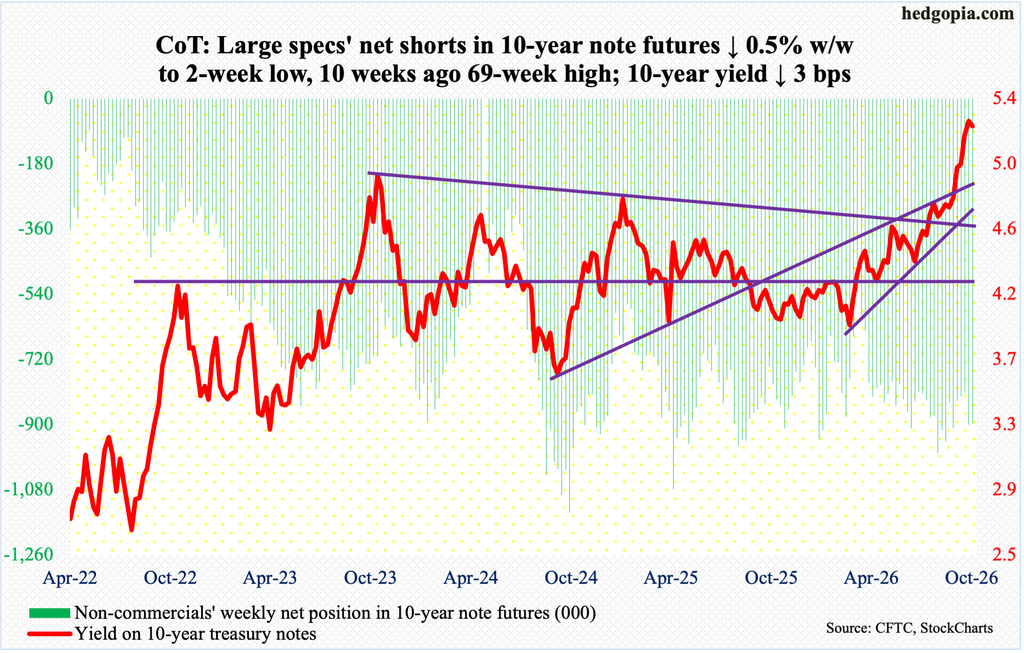
The persisting strength in the 10-year treasury yield has been the talk of the town. In February this year, these notes were yielding 3.96 percent; intraday Wednesday, the rate ticked 5.36 percent, which was the highest since April 2002. September particularly was very strong, up 53 basis points, eclipsing the October 2023 high of five percent (4.997 percent, to be precise).
The long end of the sovereign yield curve in the developed world has been rallying everywhere, from the United Kingdom to France to Japan. One common theme among these economies is that the government is neck deep in debt. Ditto with the United States. A lack of restraint in fiscal spending has now combined with the tremendous investment needed in the buildout of AI infrastructure, and these companies are now competing with governments for funds.
This argues for a higher plateau in yields – at least for the foreseeable future. That said, it is never going to be a straight run higher. There will be cyclical fluctuations within a secular trend. For now, subtle signs are emerging that the 10-year is ready for a breather.
In this scenario, bond bears (on price; price and yields are inversely related) are likely to try to aggressively defend five percent on the 10-year, which fell three basis points this week to 5.24 percent. This will include the non-commercials, who remain heavily net short 10-year note futures, betting on higher rates.
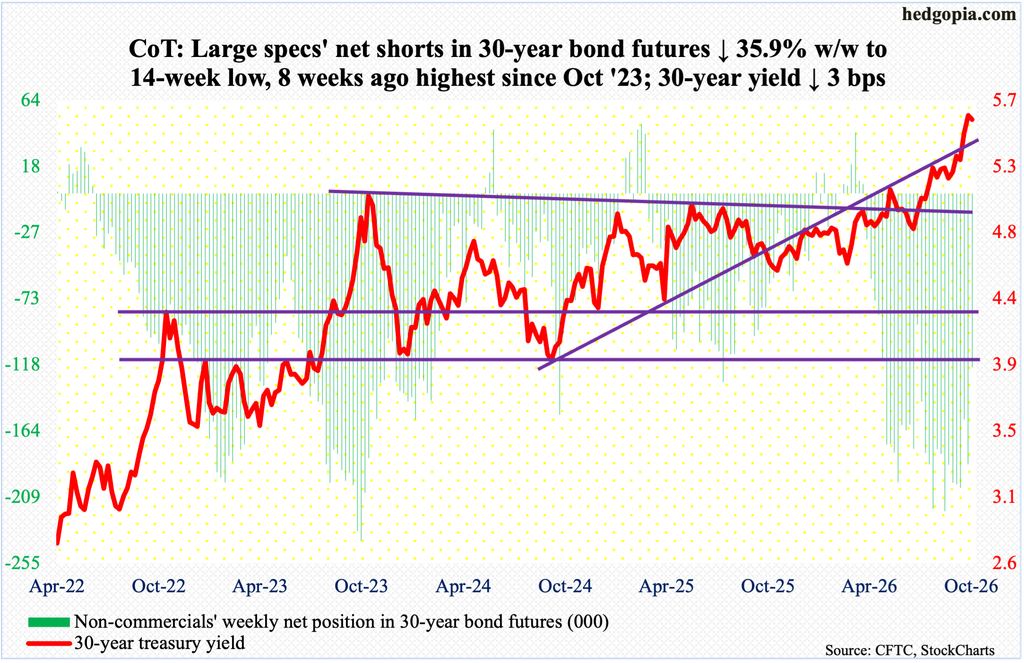
30-year bond: Currently net short 119.8k, down 67.1k.
Major U.S. economic releases for next week are as follows.
Tuesday brings the NFIB small business optimism index (September) and existing home sales (September).
Small-business job openings shrank one point month over month in August to 35. May’s 29 hit a six-year low.
August sales of existing homes declined two percent m/m to a seasonally adjusted annual rate of 3.98 million units, matching a reading from June last year.
The consumer price index (September) will be out Wednesday. In the 12 months to August, headline and core CPI grew 3.4 and 2.45 percent, with the latter the lowest since March 2021.
Retail sales (September) and the producer price index (September) are scheduled for Thursday.
Retail sales set a new high in August, rising 1.2 percent m/m to $773.9 billion (SAAR).
Headline and core PCI jumped 5.4 percent and 4.7 percent in August from a year ago.
Industrial production/capacity utilization (September) will be published Friday. Capacity utilization in August fell 0.1 percent m/m to 76.3 percent – a two-month low.
WTI crude oil: Currently net long 86.6k, down 17.1k.
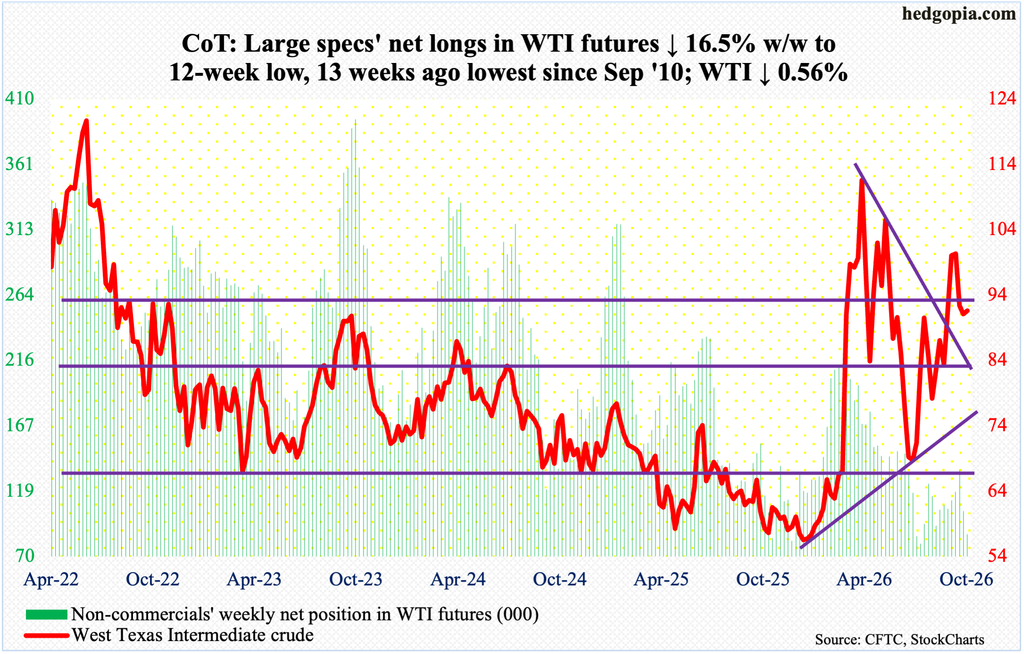
After two consecutive weeks of decline, West Texas Intermediate crude by the Tuesday low of $86.86 was down another 4.7 percent for the week, but that low below the 50-day moving average ($89) was bought. By the end of the week, the crude finished up 0.15 percent to $91.62/barrel.
WTI has come a long way since July 2 when it bottomed at $67.04, filling a gap from March 2 when the crude had a six-session surge in the wake of the February 28 U.S. and Israeli military attack on Iran, subsequently peaking on the 9th at $119.48; on February 27, it closed at $67.02, with a session high of $67.83 and a low of $64.85.
Most recently, WTI has come under pressure since September 15 when it reversed lower after ticking $106.75. This constituted yet another lower high since the March 9 high. Oil bears nevertheless have been unable to break the 50-day for the third week in a row. The problem for the bulls is that they at the same time have struggled to meaningfully rally the crude off the average. A breach of the 50-day can open the door to hurriedly test the 200-day ($83.10).
In the meantime, as per the EIA, U.S. crude production in the week to October 2 increased 24,000 barrels per day week over week to 13.979 million b/d – a record. Crude imports, too, rose, up 1.1 mb/d to 6.8 mb/d. As did gasoline inventory, which grew 382,000 barrels to 204.7 million barrels; crude and distillate stocks went the other way, down 3.2 million barrels and 42,000 barrels to 424.1 million barrels and 105.1 million barrels respectively. Refinery utilization edged up two-tenths of a percentage point to 92.7 percent; five weeks ago, utilization at 98 percent was the highest since August 2018.
E-mini S&P 500: Currently net short 154.1k, up 11.6k.
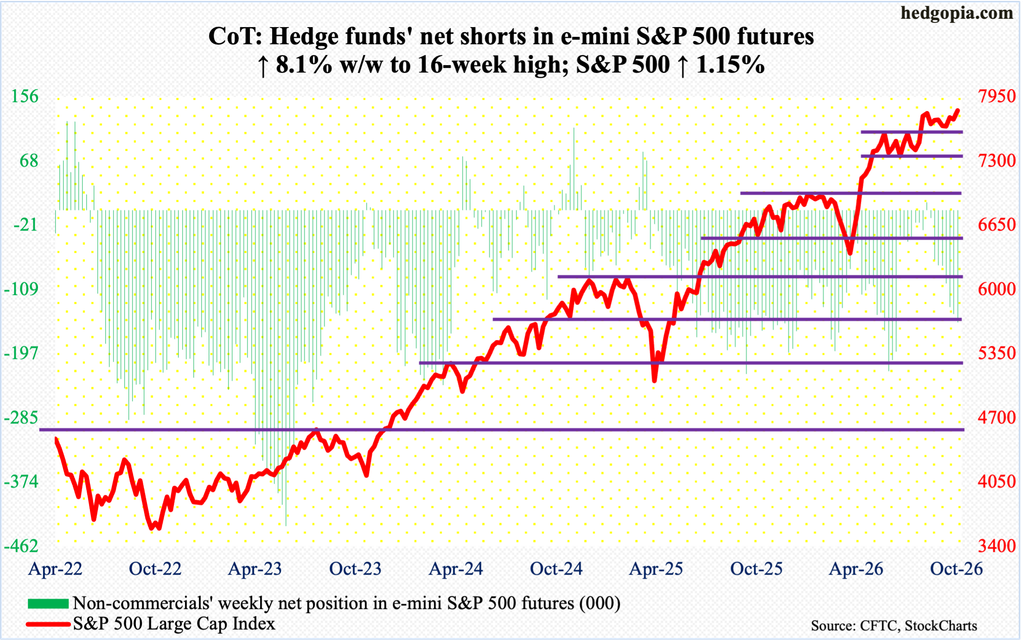
Equity bulls on Tuesday succeeded in leaving behind the August 13 high 7817 with an intraday high of 7845 but the session ended with a shooting star closing at 7819; this was followed by Wednesday’s hammer (bullish)/hanging man (bearish) and Thursday’s spinning top. In short, bulls and bears are doing their best not to leave their turf. In the end, the S&P 500 ended the week at 7812, up 1.15 percent.
As things stand, bulls probably have the edge – at least near term – although the large cap index is extended on the daily. Bulls also deserve the benefit of the doubt as they defended breakout retest at 7600-plus for seven successive weeks going into this week.
The S&P 500 earlier consolidated for a couple of months after peaking at 7621 on June 2, with a breakout on August 4, followed by the August 13 high.
Euro: Currently net short 99.3k, up 36.1k.
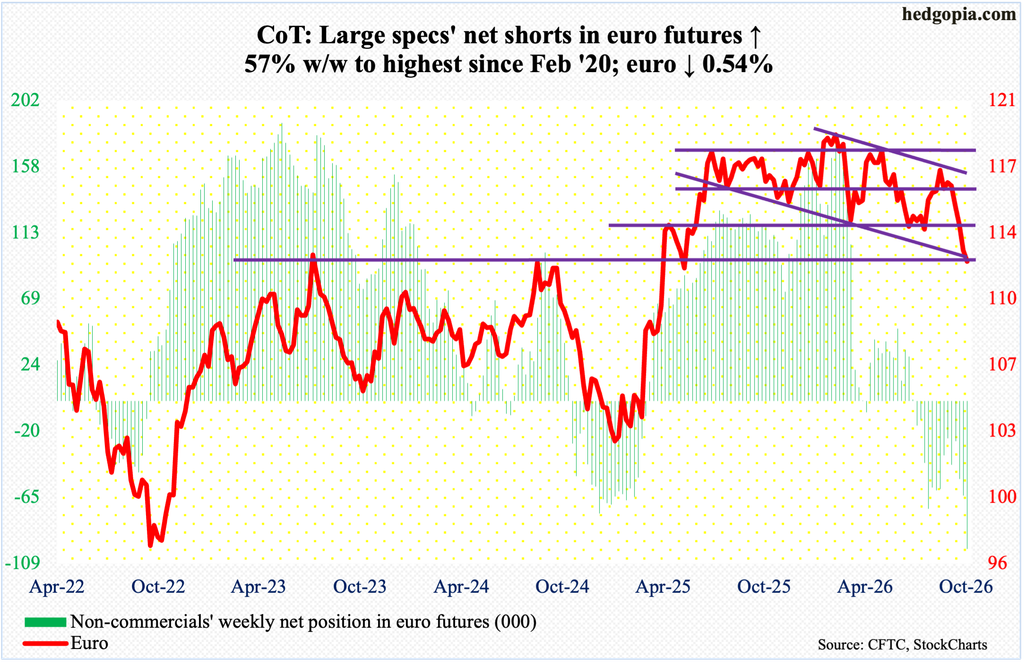
Last week, the euro broke crucial range support at $1.14. For more than a year, it went back and forth between $1.14 and $1.18, marked by a four-and-a-half-year high $1.208 posted on January 27 this year; this was then followed by a low of $1.132 on June 24, which was compromised last week.
This week, bulls continued to struggle to stop the bleeding, as the euro gave back 0.5 percent to $1.12. This was the fifth consecutive week of drawdown – and sixth in seven. On August 20-21, the currency reversed lower after tagging $1.171.
Not surprisingly, the euro remains oversold – particularly on the daily – and it sits right at dual support of horizontal plus descending channel. Assuming the bulls put their foot down, non-commercials with net shorts the highest since February 2020 can come under temptation to lock in profit.
Gold: Currently net long 210.3k, down 8.3k.
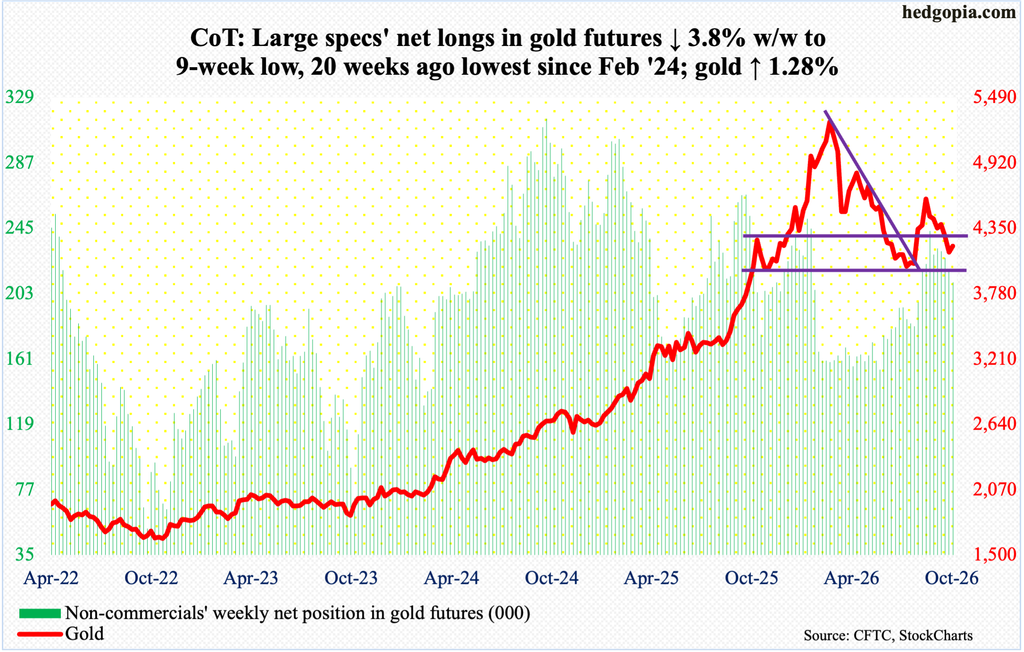
Gold finally witnessed some buying this week, rallying 1.3 percent to $4,193/ounce. This was the first up week in three – and second in six. On August 25, the metal began to retreat after tagging $4,697 intraday.
The yellow metal found support at $3,900-$4,000 for six consecutive weeks in June-July before turning up. Earlier, gold went from $3,312 in August last year – and $1,810 in October 2023 – to a peak of $5,608 on January 29 this year.
Gold in due course can still go test the strength of $3,900-$4,000. Right here and now, there is horizontal resistance at $4,370s-$4,380s, with the 50-day at $4,328.
Nasdaq (mini): Currently net long 58.1k, up 6.9k.
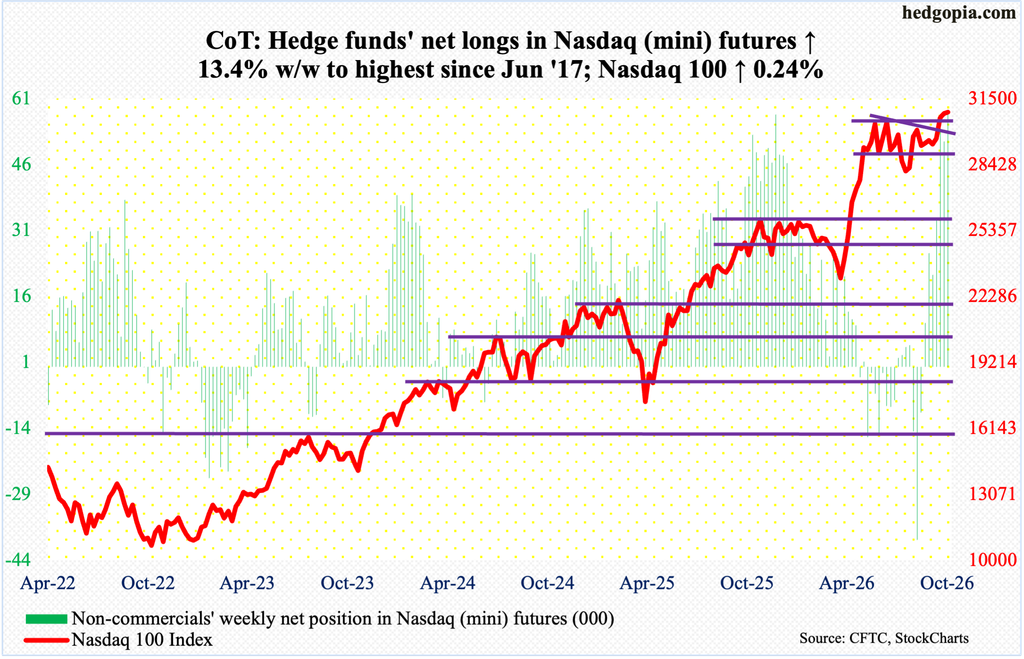
Non-commercials are aggressively bullish tech. At 58,123 contracts, they are now net long Nasdaq (mini) futures that are the highest since June 2017; a month ago, they were sitting on 20,895 contracts, while two months ago they were net short 39,302 contracts.
Tech bulls in the meantime have rallied the Nasdaq 100 from the September 16 low of 28753 to Tuesday’s fresh intraday high of 31361. Six sessions ago, the index finally took out the June 3 high of 30762. Yet, the breakout looks wobbly, with the index adding 0.2 percent this week to 30883 with a weekly doji and essentially on par with the June high.
Bulls, including the non-commercial traders, have spent a ton of buying power in recent weeks. With the 3Q earnings reporting season beginning next week, it remains to be seen if there is more currency left to decisively take out 30770s.
Russell 2000 mini-index: Currently net short 87.8k, up 10.4k.
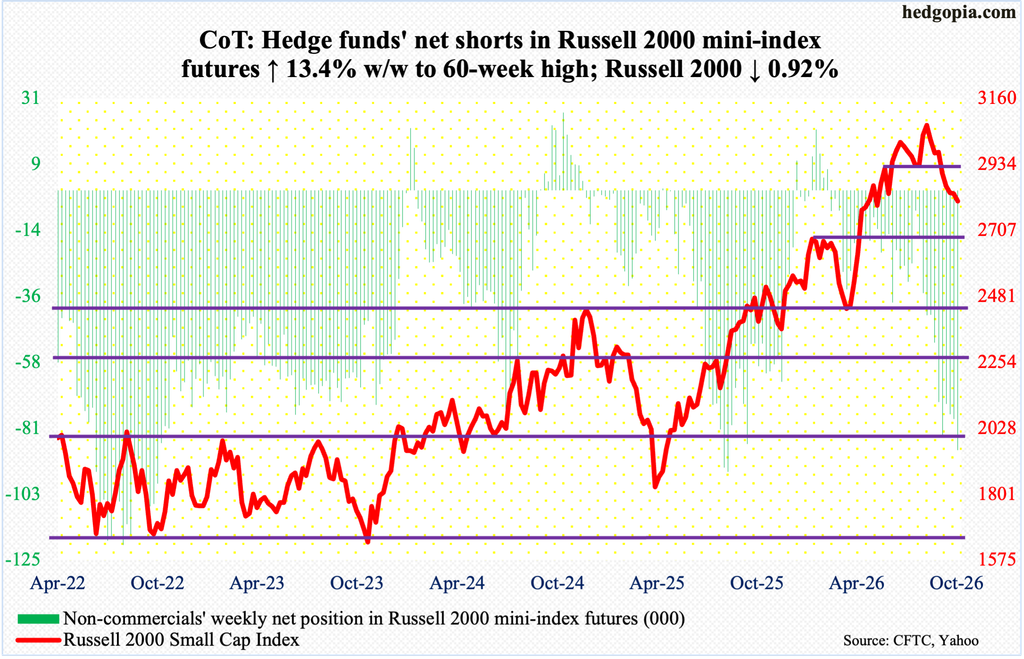
Small-cap bulls’ attempt to reclaim 2880s came up short Tuesday when the Russell 2000 tagged 2865 and reversed hard. By Friday, the index closed at 2807, down 0.9 percent for the week. This was the fifth weekly loss in succession – and seventh in eight.
The small cap index has fallen on hard times since peaking at 3070 on August 14. In the week that high was set, the Russell 2000 falsely broke out of 3040s, followed by a breach of horizontal support at 2940s and 2880s.
If there is any good this week from the bulls’ perspective, it is that they defended the 200-day (2789) Thursday when the index ticked 2763, and the low generated buying interest. In the event of further strength, sellers will likely show up at 2880s.
US Dollar Index: Currently net long 12k, up 130.
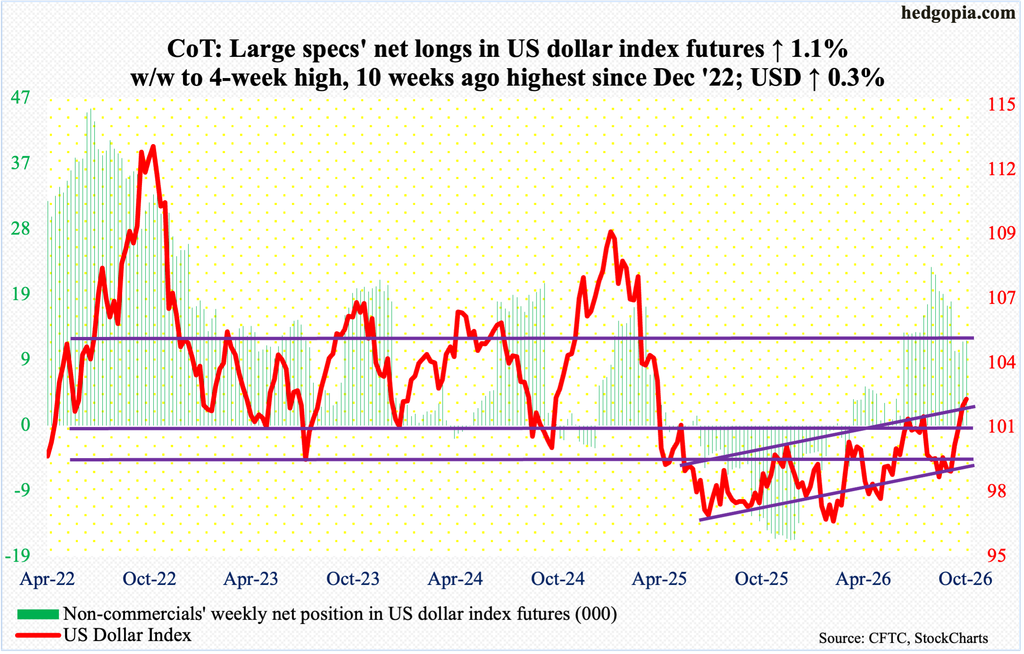
Dollar bulls kept up the buying pressure, as the US dollar index rallied 0.3 percent this week to 102.23, with Monday tagging 102.53 intraday. This represented the fourth up week in a row. On September 9, it bottomed at 98.60, defending the 98.56 reached on August 20-21.
Earlier, the index had been under pressure since getting rejected at 101-102 for six weeks in a row in June-July. The significance of 100 – or just north of it – goes back to March 2015. The level has now been recaptured.
In doing so, the daily conditions have been driven into overbought territory, and unwinding is just a matter of time. In the event the US dollar index comes under pressure, the 50-day at 100.08 coincides with the previously mentioned support at 100.
VIX: Currently net short 91.3k, up 11.7k.
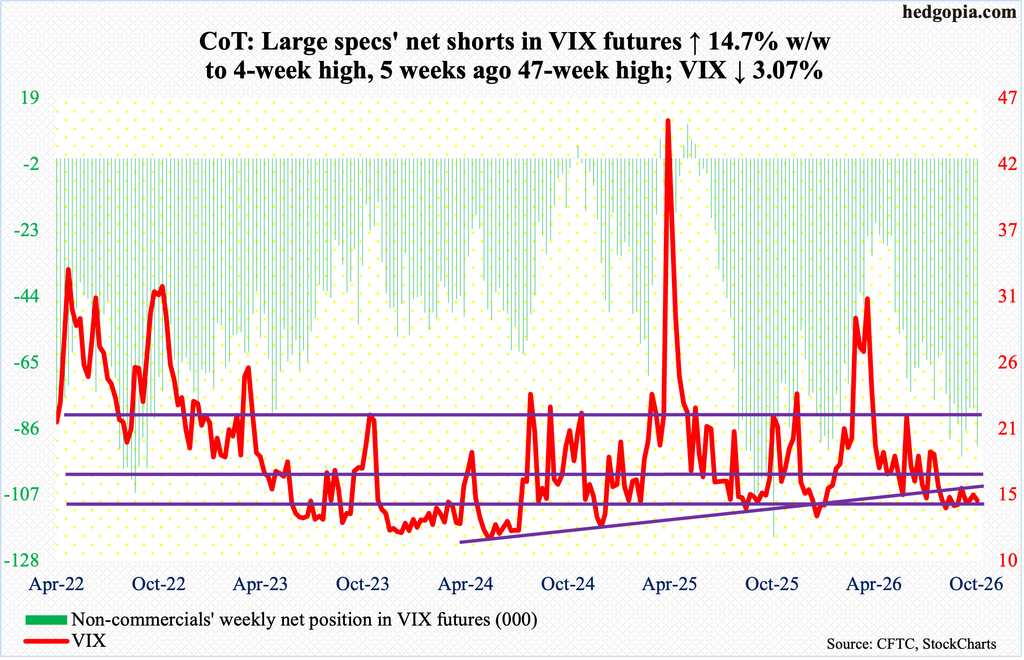
Seven sessions ago on October 1, volatility bulls failed to hold on to the session high 17.59; this Thursday, they were unable to keep the session high 16.46. By Friday, VIX was down 0.47 points for the week to 14.84.
There is trendline support, going back to the September 4 low of 13.80, at 14.60s, and this likely gets tested in the sessions ahead.
Concurrently, the daily RSI on Thursday turned lower from the median, ending the week at 45.37; there is support at 43 on the weekly.
Thanks for reading!
