
Following futures positions of non-commercials are as of October 13, 2026.
10-year note: Currently net short 988.1k, up 91.6k.
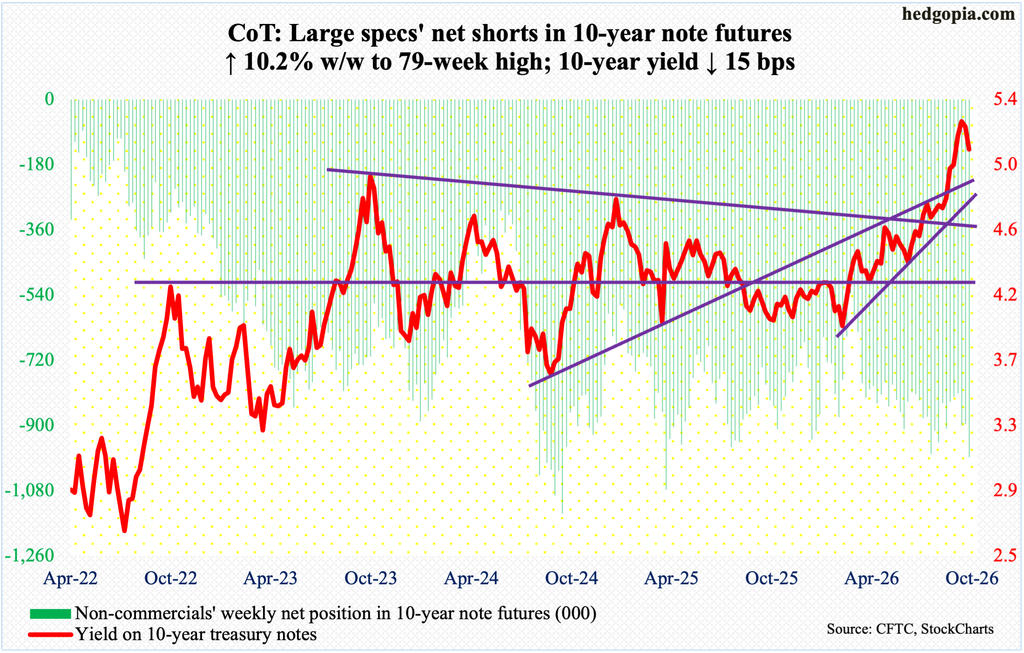
Last week, after a massive rally, the 10-year treasury yield gave out subtle signs of fatigue. This week, it gave back 15 basis points to 5.1 percent, with Thursday ticking 5.04 percent intraday.
The 10-year jumped from 3.96 percent in February to 5.36 percent on the 7th this month, with the latter the highest since April 2002.
The latest decline in the yield is coming at a time when markets have just about priced out the odds of a hike in the upcoming FOMC meeting, slated for 27-28 this month. Until just a few weeks ago, CME futures traders were convinced of a 25-basis-point increase in the fed funds rate to a range of 400 basis points to 425 basis points. The benchmark rates were raised in September to a range of 3.75 percent to four percent. This was the first hike since July 2023.
Markets this week focused more on FOMC members than on macro data. September’s CPI came in above expectations, with the headline rising 3.7 percent and the core 2.6 percent from a year ago. Immediately after the CPI report, the CME probabilities for a hike this month did rise to a 50/50, but they retracted as key Federal Reserve officials spoke.
Speaking on Tuesday, a day before the CPI report was published, John Williams, president of the New York Fed, which has a permanent voting seat within the FOMC, sees one more hike this year and none in 2027. CME futures traders are betting on a hike in December, followed by two more next year – one in March and the second by June or July.
Then on Friday – post-CPI – Fed Chair Kevin Warsh, speaking at the International Monetary Fund’s annual meetings in Bangkok, was as non-committal as he could be, saying “I don’t prejudge meetings.” Increasingly, it is looking like they are avoiding taking a controversial decision to hike six days before the mid-term elections.
If the 10-year for now is taking a cue from the short end of the curve, then it is worth watching if bond bears (on price; price and yield are inversely related) will be able to defend five percent in the sessions to come. Non-commercials, betting on higher rates, remain heavily net short 10-year note futures, and their decision to lock in gains can potentially put downward pressure on yields.
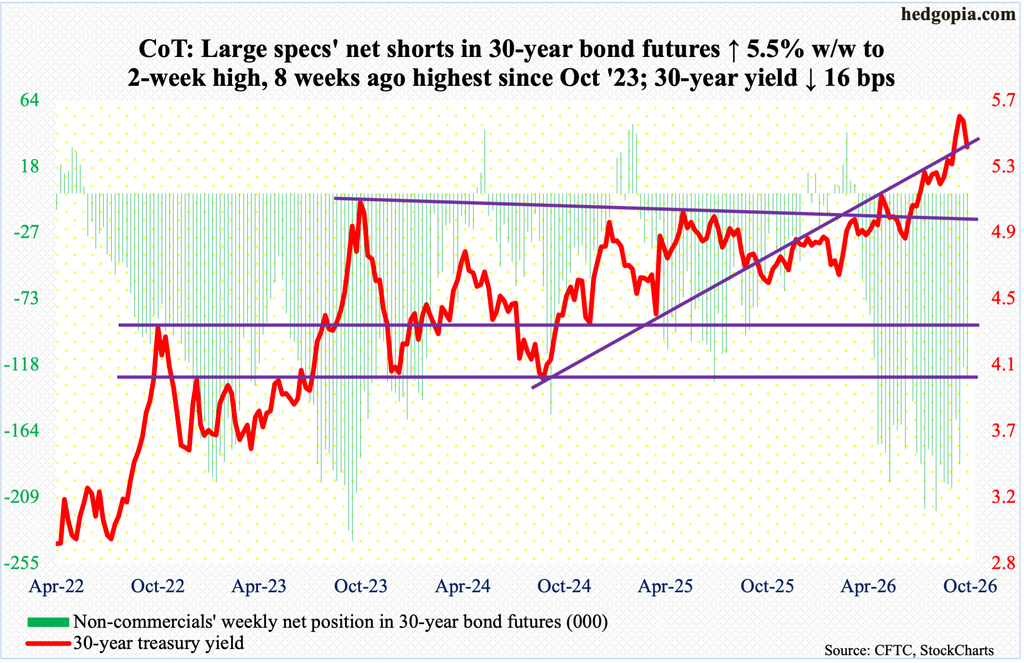
30-year bond: Currently net short 126.4k, up 6.6k.
Major U.S. economic releases for next week are as follows.
The NAHB housing market index (October) is on schedule for Monday. Homebuilder optimism dropped three points month over month in September to 32, matching the low of September last year.
Housing starts (September) come out on Tuesday. August starts declined 2.6 percent m/m to a seasonally adjusted annual rate of 1.275 million units – a three-month low. May’s 1.182 million hit a six-year low.
Friday brings University of Michigan’s consumer sentiment index (October, final). October’s preliminary reading showed consumer sentiment fell 1.8 points m/m to 46.3 – a five-month low. May’s 44.8 was a record low.
WTI crude oil: Currently net long 77.4k, down 9.2k.
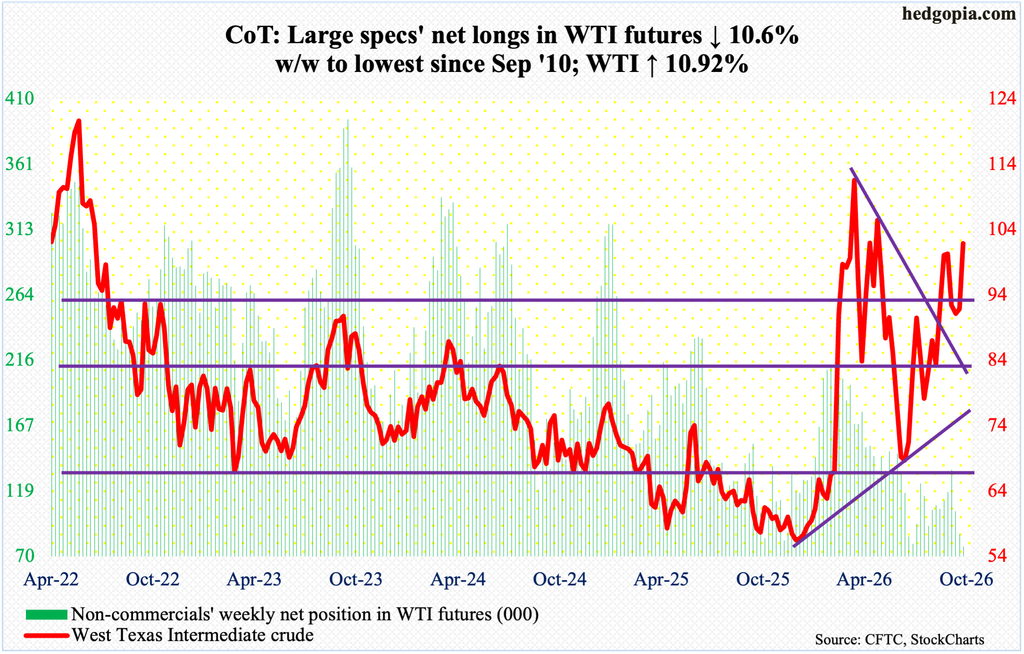
West Texas Intermediate crude, using intraday prices, printed higher lows since July 2 when it bottomed at $67.04, filling a gap from March 2 when the crude had a six-session surge in the wake of the February 28 U.S. and Israeli military attack on Iran, subsequently peaking on the 9th at $119.48; on February 27, it closed at $67.02, with a session high of $67.83 and a low of $64.85.
The crude concurrently had also been making lower highs since the March peak. Last week, oil bulls defended both the rising and falling trendline from July and March respectively. This week, WTI shot up 10.9 percent to $101.88/barrel. The current momentum is up, and the bulls are probably eyeing at least $106-$107. Earlier, the crude reversed lower on September 15 after ticking $106.75.
In the meantime, as per the EIA, U.S. crude production in the week to October 9 decreased 300,000 barrels per day week over week to 13.679 million b/d from record 13.979 mb/d. Crude imports, too, dropped, down 791,000 b/d to six mb/d. As did crude and distillate inventory, which declined 8.6 million barrels and 2.5 million barrels to 415.6 million barrels and 102.6 million barrels respectively; gasoline stocks went the other way, up 3.5 million barrels to 208.3 million barrels. Refinery utilization rose eight-tenths of a percentage point to 93.5 percent.
E-mini S&P 500: Currently net short 141k, down 13.1k.
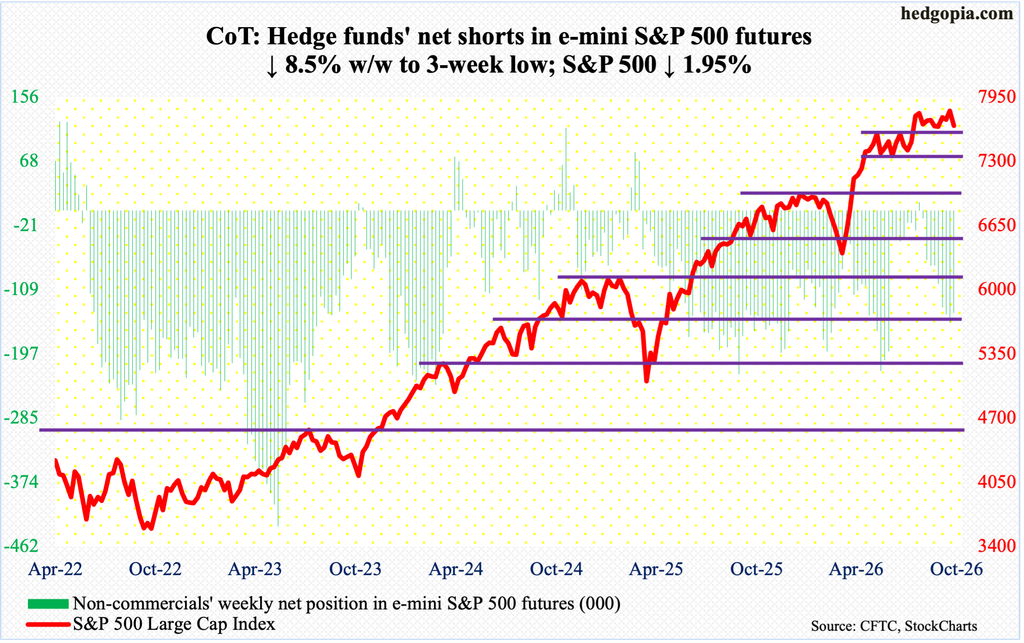
Equity bulls simply ran out of buying power, or that is how it looks. Last week, the S&P 500 looked poised for a breakout. It had gone sideways in a 200-point range for two and a half months, with resistance north of 4800 and support north of 4600.
Earlier, the large cap index consolidated for a couple of months after peaking at 7621 on June 2, with a breakout on August 4, followed by the August 13 high of 7817 and a newer high 7845 posted on the 6th this month.
Going into this week, bulls probably deserved the benefit of the doubt having also defended breakout retest at 4600-plus for nearly two months but came up short, as the S&P 500 tumbled a couple of percent to 7659. They will be tested in the sessions ahead if they can continue to defend 7600-plus. Last Friday, the crucial support was sort of defended as the session low 7632 was bought, but at this juncture a breach increasingly looks like the path of least resistance; Friday also breached the 50-day moving average (7706).
Euro: Currently net short 137.6k, up 38.2k.
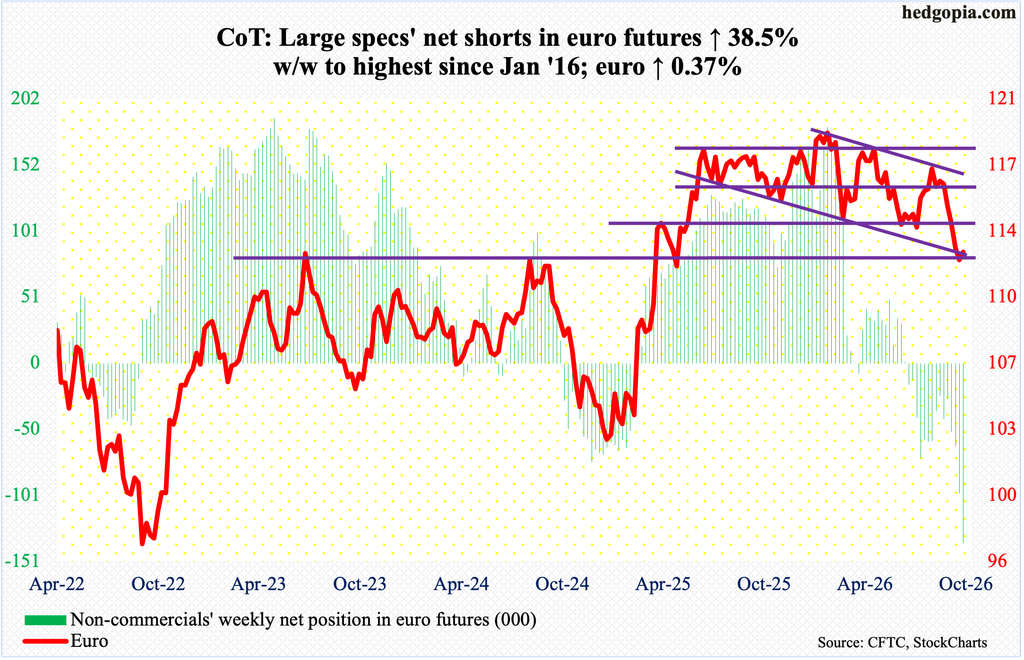
Non-commercials’ net shorts as of Tuesday were the highest going back to January 2016; as recently as June 30, they were net long and have been rewarded for their bearish switch.
The euro peaked at a four-and-a-half-year high $1.208 on January 27 this year, followed by lower highs of $1.1852 in April, $1.1792 in May and $1.1712 in August.
Two weeks ago, the currency broke crucial range support at $1.14. For more than a year, it vacillated between $1.14 and $1.18.
Amidst this persistent drawdown, the euro finished last week right at dual support at $1.12 – horizontal plus descending channel. On Wednesday this week, that support was violated intraday with a low of $1.1113 but was saved by close.
On both the daily and weekly, the euro remains way oversold, and unwinding of these conditions looks probable – more so if non-commercials, who are neck-deep in net shorts, decide to lock in gains.
Gold: Currently net long 207.9k, down 2.5k.
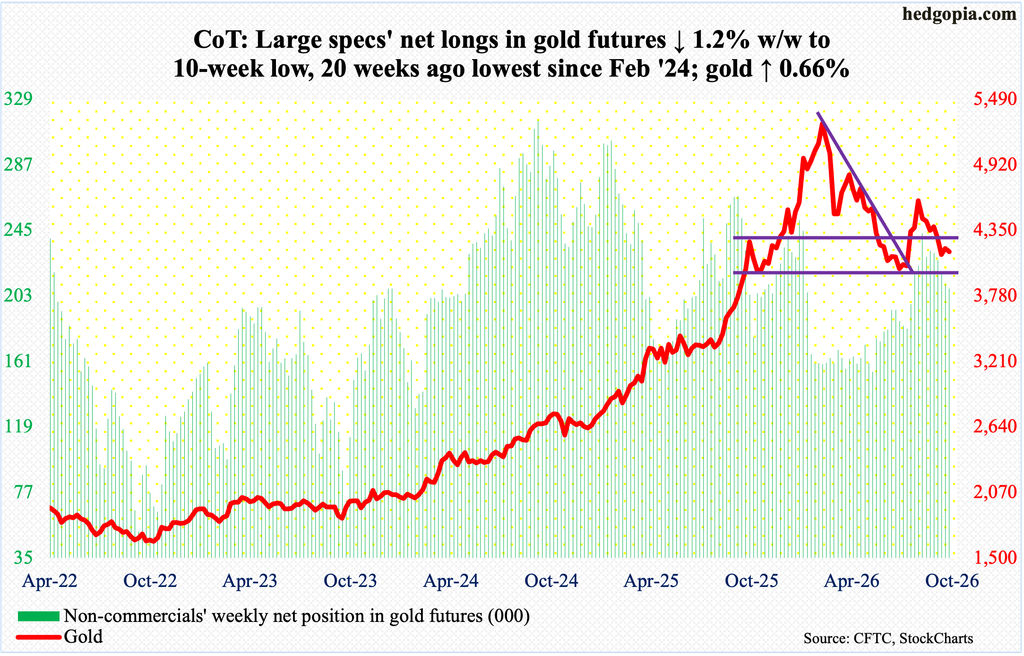
Bids are showing up just under $4,100. Last Wednesday, gold tagged $4,067 intraday; a week later, this Wednesday, it ticked $4,074. The metal ended lower 0.7 percent this week to $4,166/ounce.
Gold bugs are stepping up to the plate just above lateral support at $3,900-$4,000, which in June-July this year was defended for six consecutive weeks before the metal turned up. On January 29 this year, gold peaked at $5,608, rallying from $3,312 in August last year, and $1,810 in October 2023. On August 25, it began to retreat after tagging $4,697 intraday.
In the right circumstances, gold can rally to go test horizontal resistance at $4,370s-$4,380s, with the 50-day at $4,330.
Nasdaq (mini): Currently net long 48.5k, down 9.6k.
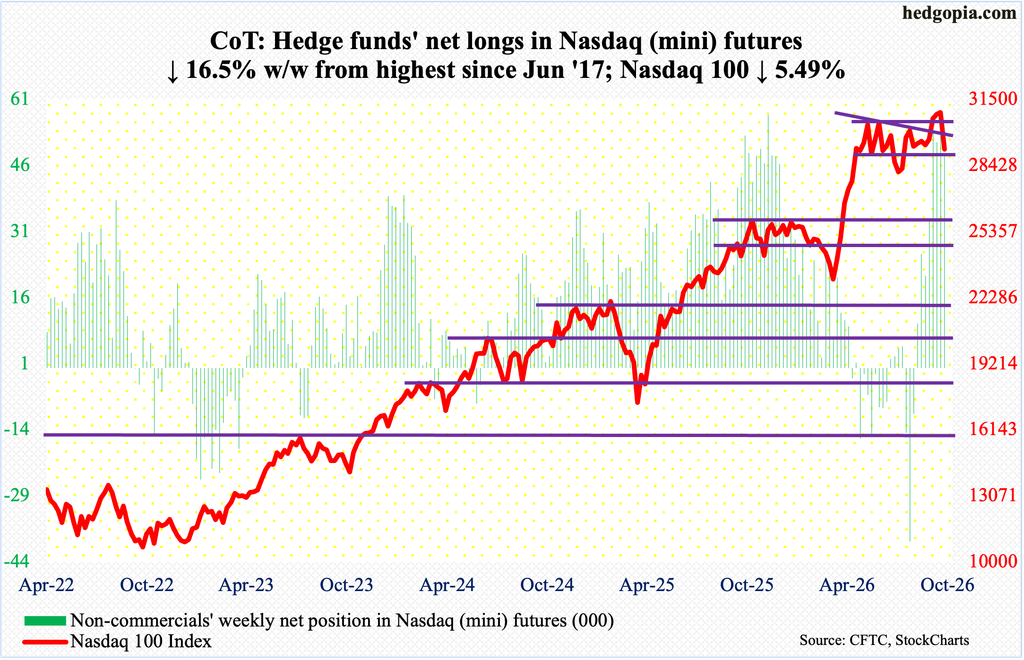
After weeks and weeks of underperformance by the soldiers versus the generals, the Nasdaq 100 fell apart this week, down 5.5 percent to 29188. This is taking place at a crucial juncture.
Tech bulls rallied the Nasdaq 100 from the September 16 low of 28753 to last Tuesday’s fresh intraday high of 31361. Six sessions before that, the index finally took out the June 3 high of 30762. Even though last week’s close of 30883 ended with a weekly doji, the Nasdaq 100 was positioned well to decisively take out 30770s. Bears, however, had other ideas, pushing the index lower in all sessions this week, slicing through the 50-day (29868).
As things stand, bulls have their work cut out for them.
Russell 2000 mini-index: Currently net short 61k, down 26.8k.
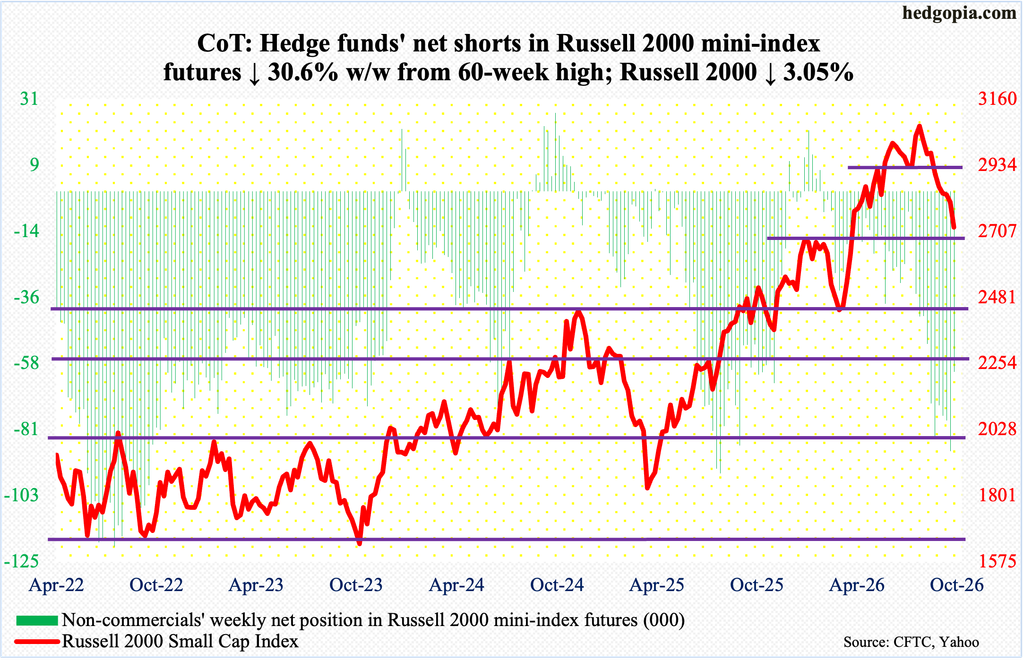
The Russell 2000 dropped 3.1 percent this week to 2721 to register its sixth weekly loss in a row – and eighth in nine.
The small cap index has taken it on the chin since peaking at 3070 on August 14. In the week that high was set, the Russell 2000 falsely broke out of 3040s, followed by a breach of horizontal support at 2940s and 2880s, not to mention the definitive loss this week of a rising trendline from April last year.
This week’s close puts the index right on horizontal support at 2700. In the event of a rally, the 200-day (2795) lies right above.
US Dollar Index: Currently net long 12.9k, up 908.
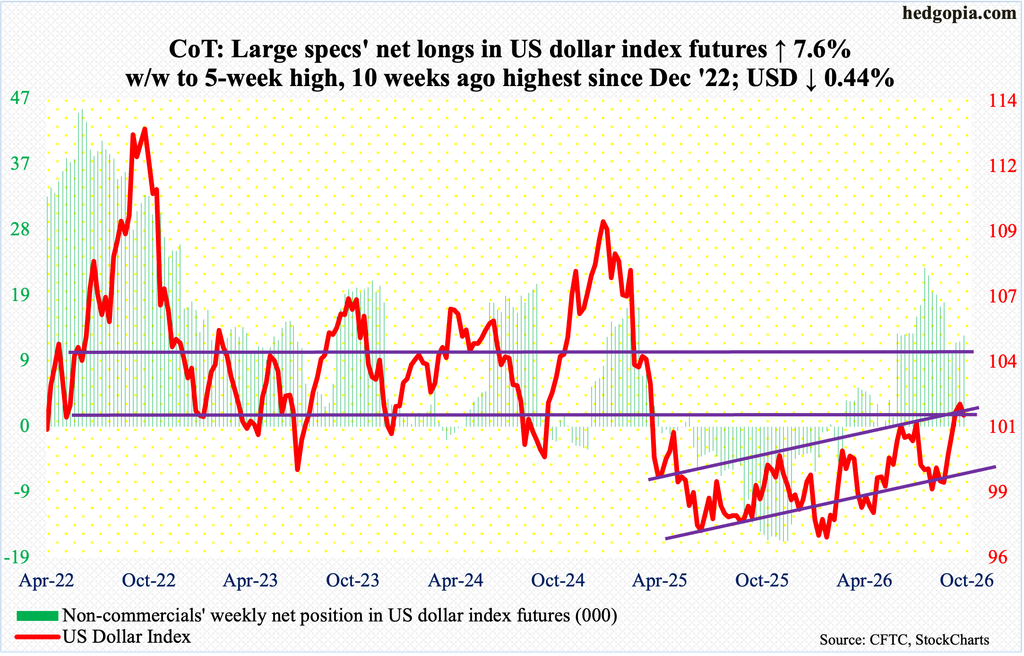
The US dollar index suffered a big reversal Wednesday when it ticked 102.94 intraday – a six-month-plus high – but only to close at 102.21. This was followed by more downward pressure in the latter two sessions, ending the week down 0.4 percent to 101.78.
The index has come a long way from the intraday low of 98.60 set on September 7, which essentially tested the 98.56 reached on August 20-21.
Earlier, the US dollar index had been under pressure since getting rejected at 101-102 for six weeks in a row in June-July. The significance of 100 – or just north of it – goes back to March 2015. These levels will be tested in the sessions to come. The 50-day rests at 100.31.
VIX: Currently net short 96.5k, up 5.2k.
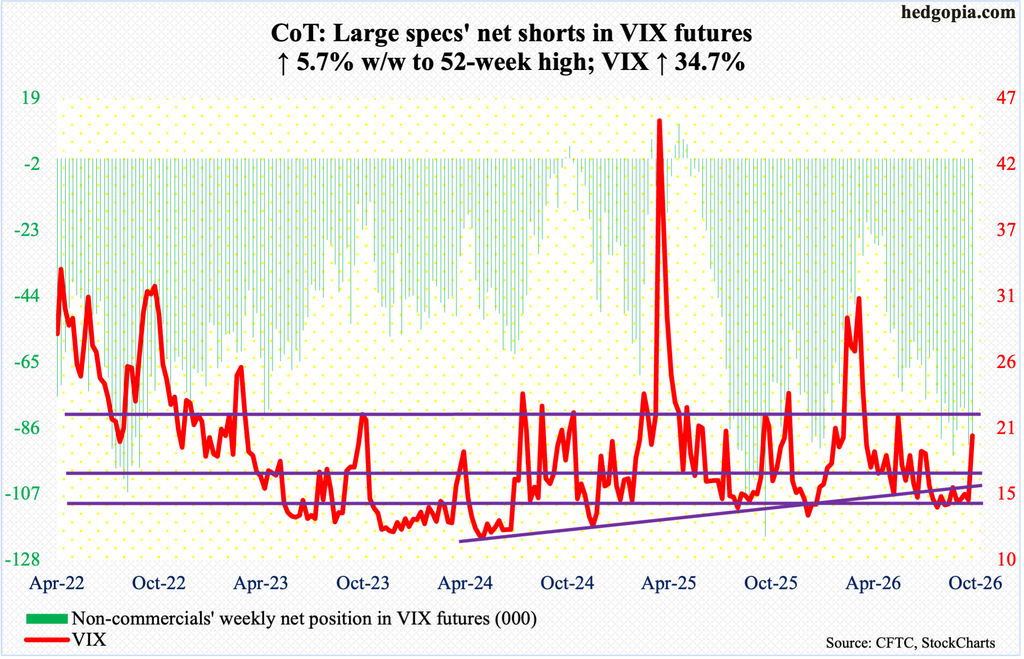
Just when non-commercials raised net shorts to a 52-week high, VIX shot up 3.53 points this week to 19.99, with Friday ticking 22.31 intraday. Time will tell if this intraday reversal has staying power, but for now volatility bulls have the upper hand, with the index past both the 50- and 200-day (15.59 and 18.10 respectively). The 200-day particularly had been rejecting rally attempts from late July; this can now act as support.
Thanks for reading!
