
Following futures positions of non-commercials are as of November 3, 2026.
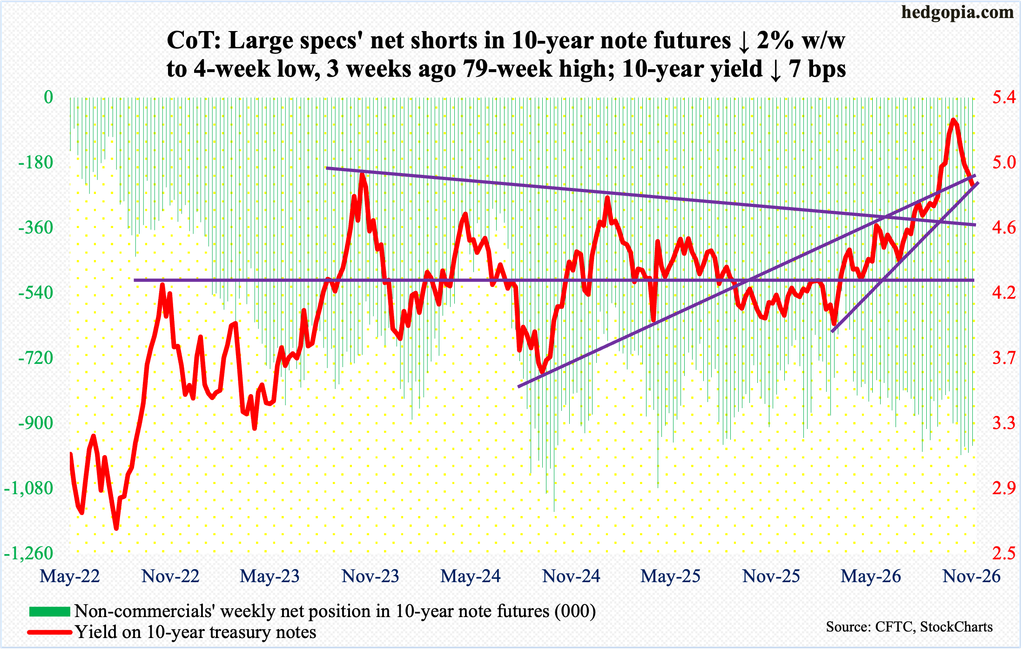
10-year note: Currently net short 962.4k, down 19.2k.
Democrats’ sweeping victory in Tuesday’s mid-term elections, giving them control of both the House and the Senate, is reverberating through all sorts of assets, not the least of which is the outlook for interest rates.
The 10-year treasury yield gave back seven basis points this week to 4.86 percent. The yield has already been under pressure since tagging 5.36 percent on October 7, which was the highest print since April 2002. The 10-year rallied incessantly from 3.96 percent in February, with the recent downward pressure helping unwind some of the overbought condition it was in.
Over on the short end of the yield curve, market participants seem to be believing that that the mid-term results have raised the odds of weaker economic growth in the quarters ahead, thanks to tighter restrictions on data center construction in certain states.
Going into the week, using CME FedWatch data, traders were betting on two quarter-point hikes in the fed funds rate by the end of next year – one this December and the other next year. Leading up to the October 27-28 FOMC meeting, in which the benchmark rates were left steady at a range of 375 basis points to 400 basis points, these traders were betting on three 25-basis-point increases by the end of next year. Now, they are overwhelmingly betting on a hike this December but are assigning probabilities of only 60 percent on a hike next year.
These futures traders tend to be very volatile. A better signal may come from the 10-year treasury yield. Bond bears (on price; price and yield are inversely related to each other), who are betting on higher rates, struggled to defend five percent, which also lines up with the 50-day moving average (5.03 percent). If they similarly fail to defend 4.75s, then we know markets are betting on decent weakness in the economy in the quarters to come. On both Thursday and Friday, the 10-year tagged 4.81 percent and rose a tad, leaving 4.75s intact.
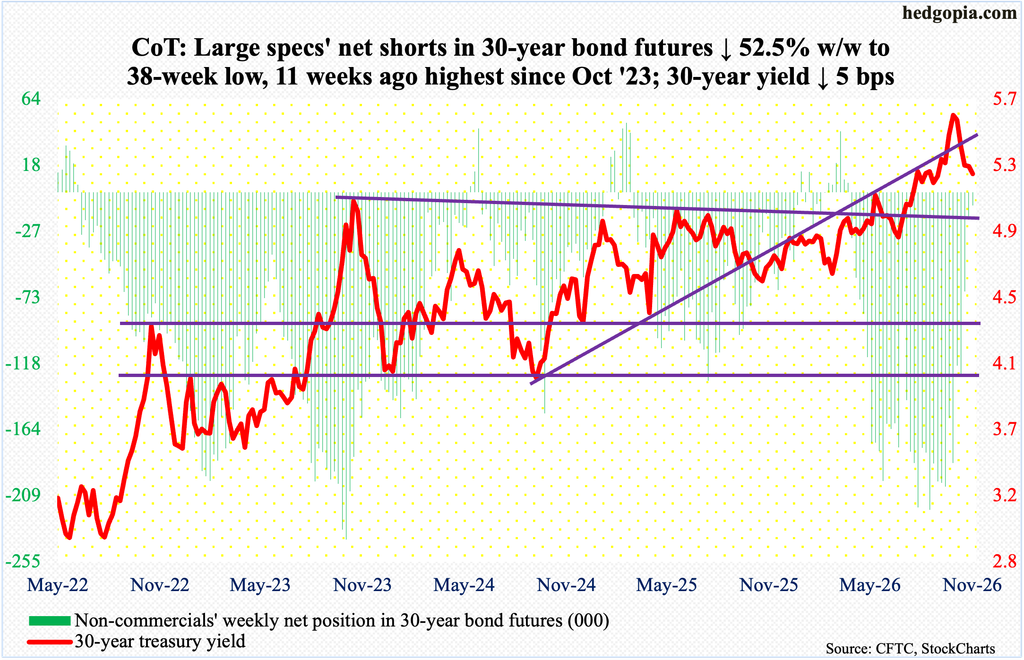
30-year bond: Currently net short 9.1k, down 10k.
Major U.S. economic releases for next week are as follows.
The NFIB small business optimism index (October) and the consumer price index (October) are on schedule for Tuesday.
Small-business job openings dropped three points month over month in September to 32. May’s 29 was a six-year low.
In the 12 months to September, headline and core CPI increased 3.74 and 2.56 percent respectively – a four- and three-month high, in that order. May’s 4.25 percent and 2.85 percent were 37- and eight-month highs respectively.
Existing home sales (October) are due out Thursday. September sales grew 1.5 percent m/m to a seasonally adjusted annual rate of 3.99 million units. August’s 3.93 million set a 14-month low.
Friday brings the producer price index (October). Year over year in September, headline and core PPI jumped 6.3 percent and five percent respectively.
WTI crude oil: Currently net long 55.1k, up 8k.
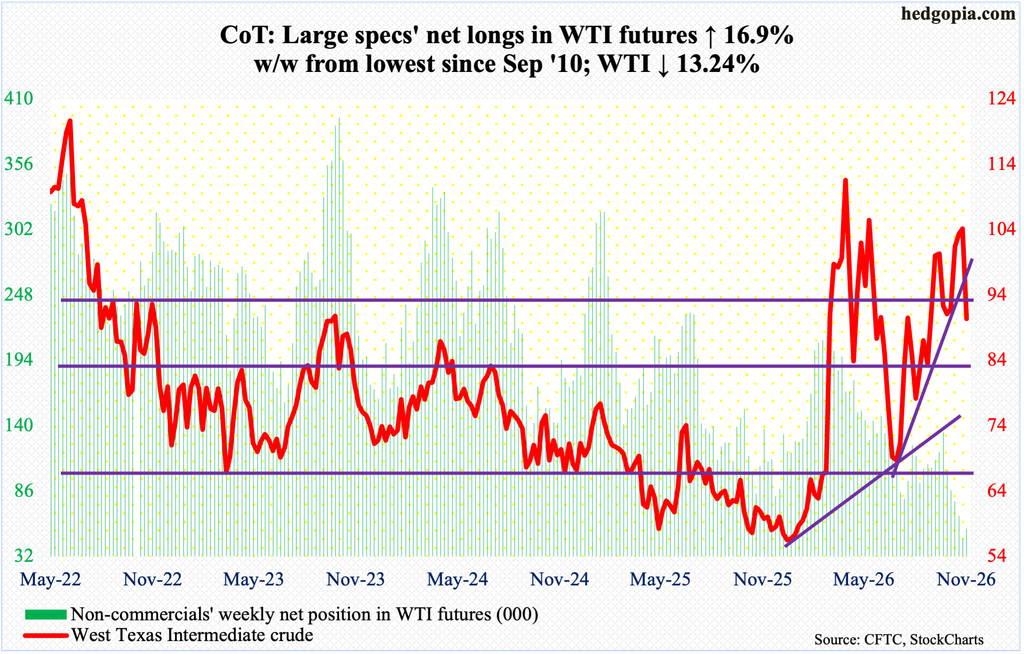
Last Friday’s session high $104.99 was part of a series of lower highs since West Texas Intermediate crude peaked on March 9 at $119.48; six sessions before that, it surged in the wake of the February 28 U.S. and Israeli military attack on Iran. On February 27, the crude closed at $67.02, with a session high $67.83 and a low $64.85.
This week opened lower and continued lower until WTI tested the 200-day ($86.99) with Thursday’s intraday low of $86.65. For the week, it tumbled 13.2 percent to $90.34/barrel.
Investors seem to be concluding that the mid-term results have lessened the odds of continued elevated tensions in the Middle East. This may be a little premature, but for now the crude remains overbought on particularly the weekly. A rising trendline from January when WTI was in the mid-$50s extends to $78. In the event the Iran conflict gradually simmers down, oil bears will once again begin to eye the high-$60s.
In the meantime, as per the EIA, U.S. crude production in the week to October 30 increased 11,000 barrels per day week over week to 14.003 million b/d – a record. Crude imports were flat at 6.4 mb/d. Stocks of crude, gasoline, and distillates all declined, down 865,000 barrels, 222,000 barrels and 3.6 million barrels respectively to 409.8 million barrels, 209 million barrels and 99.3 million barrels, with distillates the lowest since May 2003. Refinery utilization increased 1.7 percentage points to 94.5 percent.
E-mini S&P 500: Currently net short 129.4k, down 5k.
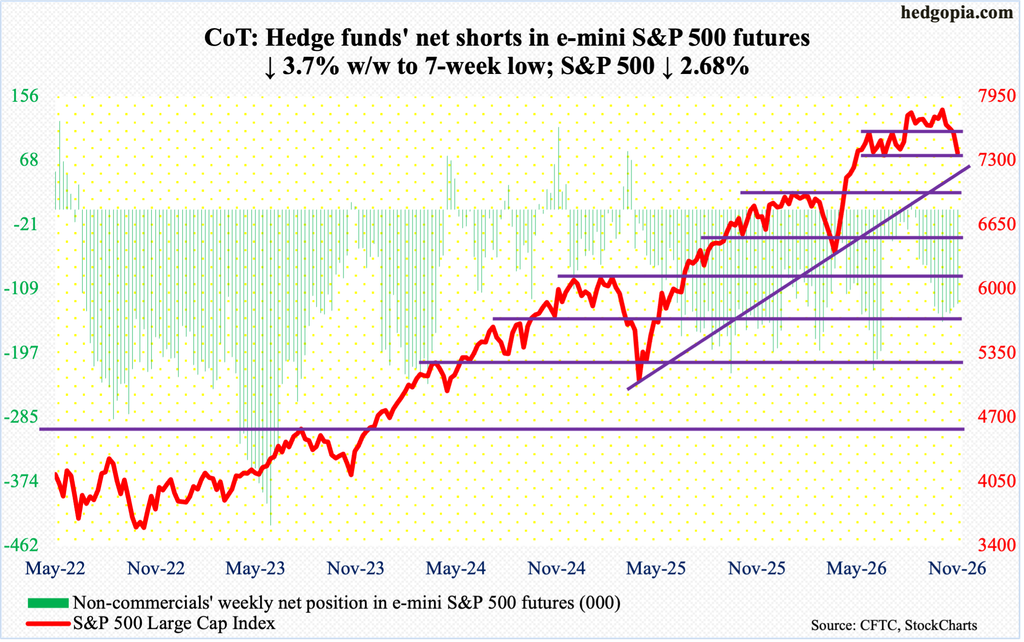
Last week, after defending a 200-point range with resistance north of 4800 and support north of 4600 for two and a half months, bulls simply ran out of buying power, as the range was broken to the downside. In fact, subtle signs of distribution were showing up ever since the S&P 500 ticked a new all-time high of 7817 on August 13.
This week, reacting to the mid-term results, the large cap index tumbled 2.7 percent to 7377, with Thursday tagging 7350. The 200-day rests at 7325, and the index has not closed below the average since March 19 this year. Odds strongly favor a breach in due course.
Mid-April this year, after the S&P 500 bottomed at 6317 on March 30, it burst out of 7000, and this, when it occurs, is going to be an important breakout retest.
Euro: Currently net short 157.8k, up 13.9k.
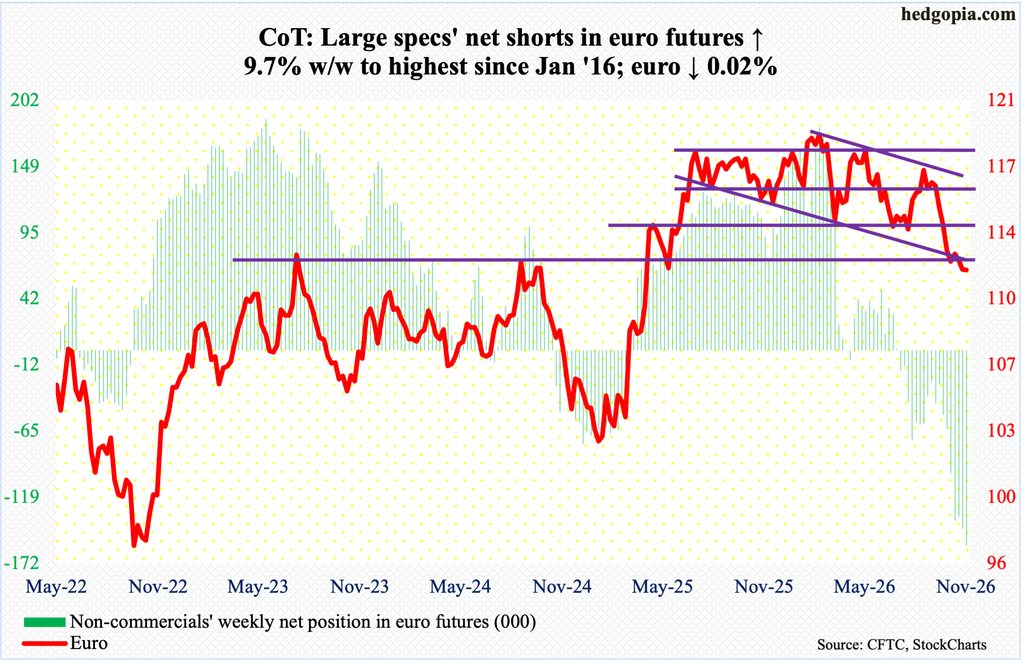
Euro bulls tried to rally early on but Wednesday’s session high $1.1276 drew sellers, and the currency ended the week essentially flat at $1.1153, forming a weekly gravestone doji. But it remains above $1.11, with the sideways pattern intact for four weeks now.
The euro has been under downward pressure since peaking on January 27 this year at a four-and-a-year high $1.208. Five weeks ago, it broke crucial range support at $1.14. For more than a year, it vacillated between $1.14 and $1.18.
The currency is near/just under dual support at $1.12 – horizontal plus descending channel. On particularly the weekly, it remains way oversold, and unwinding of these conditions looks probable – more so if non-commercials, whose holdings of net shorts are the highest since January 2016, decide to lock in gains.
Gold: Currently net long 179.5k, down 6.9k.
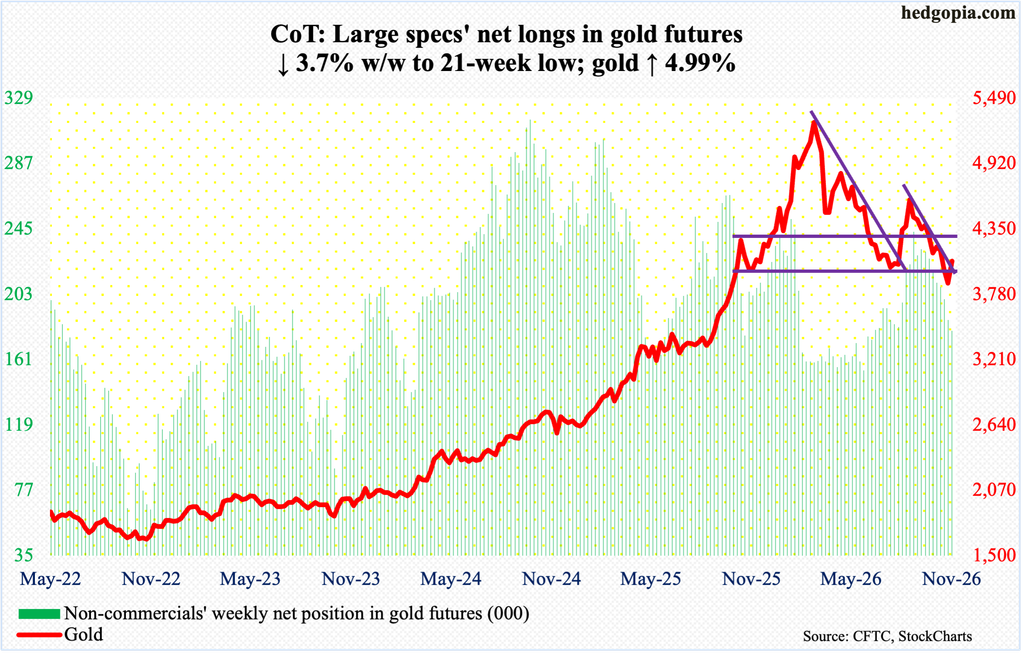
Only a week after breaching crucial support of $3,900-$4,000, where it went sideways for six consecutive weeks in June-July this year before turning up, gold reclaimed the level, closing this week up five percent to $4,069/ounce. This was the first up week in four.
There is near-term horizontal resistance at $4,100s, and it is holding, with gold bugs unable to hang on to Thursday’s session high $4,147. If this hurdle gives way, the 50-day sits right above at $4,199.
In ideal circumstances, bulls would love to go test trendline resistance from January 29 this year when it peaked at $5,608; this hurdle is at $4,400, with the 200-day at $4,481.
Nasdaq (mini): Currently net long 42.9k, down 6k.
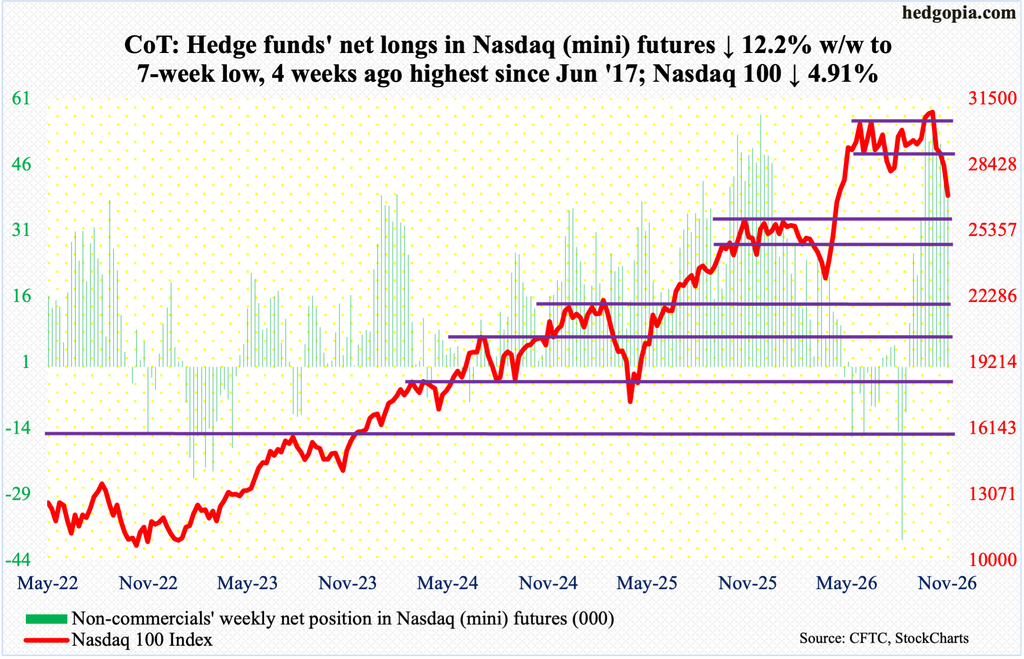
Last week, tech bulls could no longer defend 28800s on the Nasdaq 100, which had been on the defensive since reaching an all-time high 31361 on October 6. This week, their attempt on Wednesday to recapture the support-turned-resistance failed at 28830. Then came Thursday’s 6.4-percent drubbing, slicing through the 200-day at 27984. For the week, the index gave back 4.9 percent to 26990, which is nothing given the massive gains the tech-heavy index has enjoyed over the last several months and quarters.
From the March 30 low of 22841 through the October high, the Nasdaq 100 jumped 37.3 percent; going back further, it surged 89.6 percent from the April 2025 low of 16542.
In April this year, the index broke out of 26100s, and a retest should occur soon. Thursday’s session low 26606 was close but probably not sufficient.
The daily is oversold. In the event of a rally near term, bears can show up at 28100s – just above the 200-day – and then 28800s.
Russell 2000 mini-index: Currently net short 23.7k, down 12.4k.
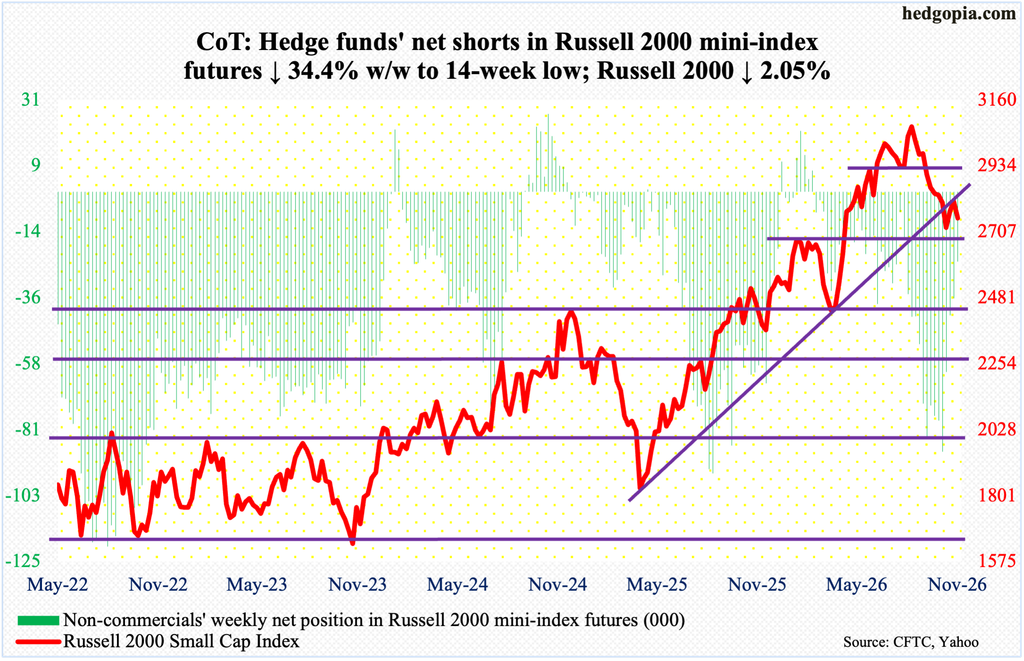
Even though the Russell 2000 was punished this week for a 2.1 percent drop, there was consolation for small-cap bulls in that they defended horizontal support at 2700, which has drawn bids in three of the last four weeks. This week, Friday tagged 2721 intraday, ending the session/week at 2754. The Russell 2000 earlier peaked at 3070 on August 14.
With that said, Wednesday’s session high 2875 similarly attracted offers right at the underside of a broken trendline from April last year. The best that the bulls can hope for now is a rally toward lateral resistance 2880s, which comes after the 200-day at 2808 and the 50-day at 2838.
US Dollar Index: Currently net long 14.2k, up 69.
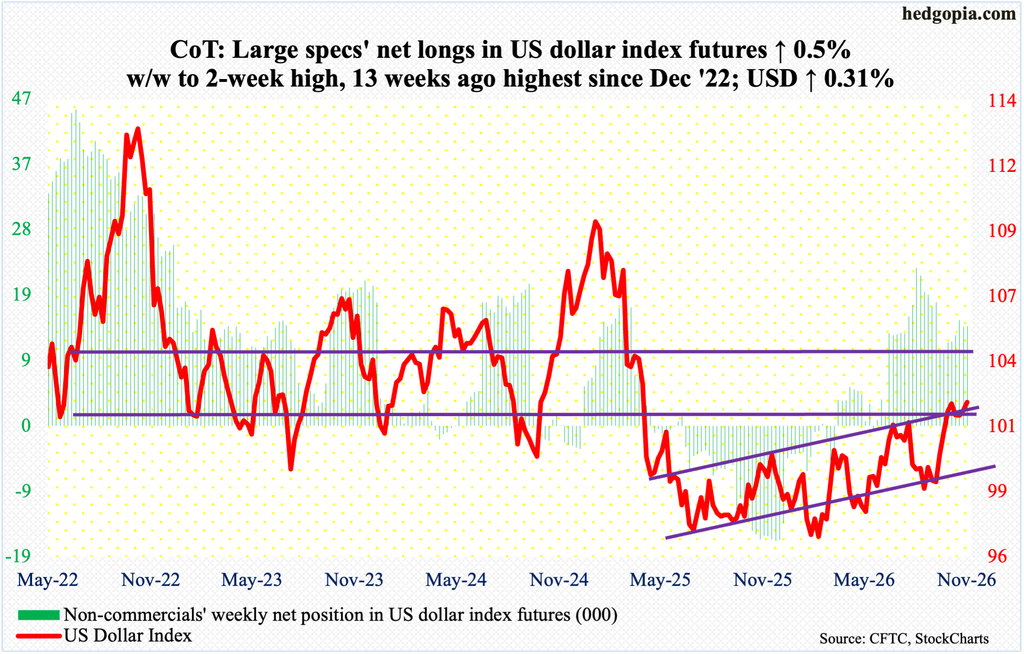
Dollar bulls had an opportunity to defend the 50-day (101.06) this week, and they grabbed it when Wednesday’s intraday drop to 101.10 was embraced. For the week, the US dollar index increased 0.3 percent to 102.28.
On October 14, the index ticked 102.94, which was preceded by several sessions of intraday prints just north of 102.50. Earlier, the September 7 intraday low of 98.60 essentially tested the 98.56 reached on August 20-21.
The US dollar index had been under pressure since getting rejected at 101-102 for six weeks in a row in June-July. The significance of 100 – or just north of it – goes back to March 2015. As things stand, 101.50s is being defended. If this ultimately results in a decisive push past 102.50s, dollar bulls would have regained momentum.
VIX: Currently net short 76.9k, down 550.
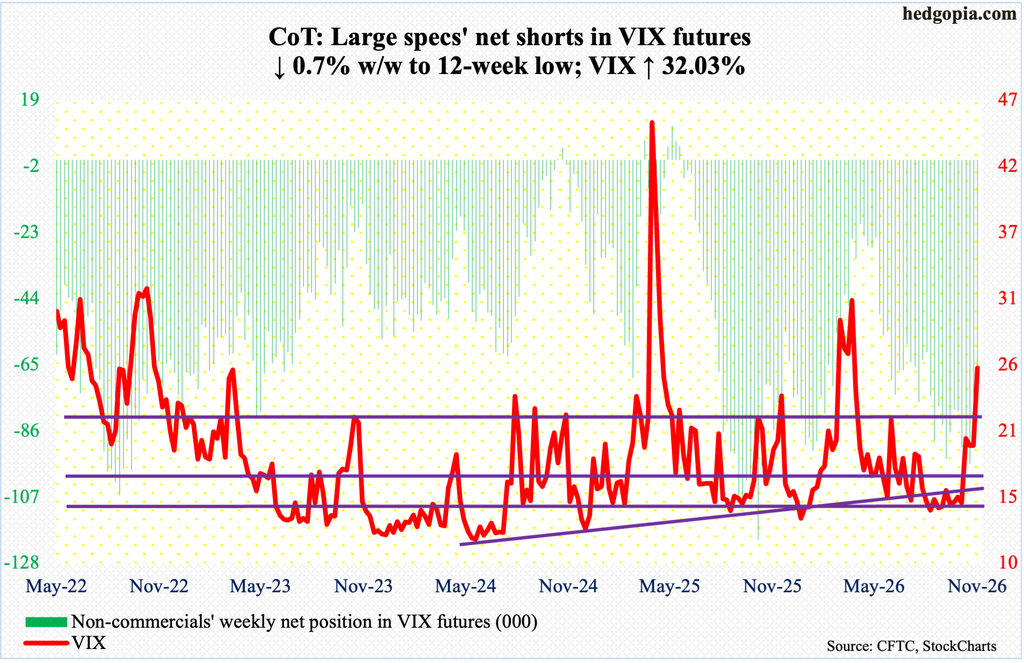
VIX shot up 6.22 points this week to 25.64, with Thursday rising as high as 28.36.
This follows a couple of months of solid defense of 14, or just north of it, and a month beginning early October of upward pressure, although volatility bulls were unable to hold on to that strength. This time around, they have hung on to it.
The volatility index reclaimed the 200-day (18.38) as well, with the 50-day at 16.90. This week’s gains give the bulls a nice cushion to fall back on. If, let us say, VIX comes under pressure, the upward momentum will remain intact even if it drops to 21 and the level gets defended. Beginning September 4 when the index ticked 13.80 intraday, VIX has gradually trended higher.
Thanks for reading!
