Equities celebrated last week’s Republican sweep with huge gains. More gains are possible ahead, although not all the wheels are in sync.
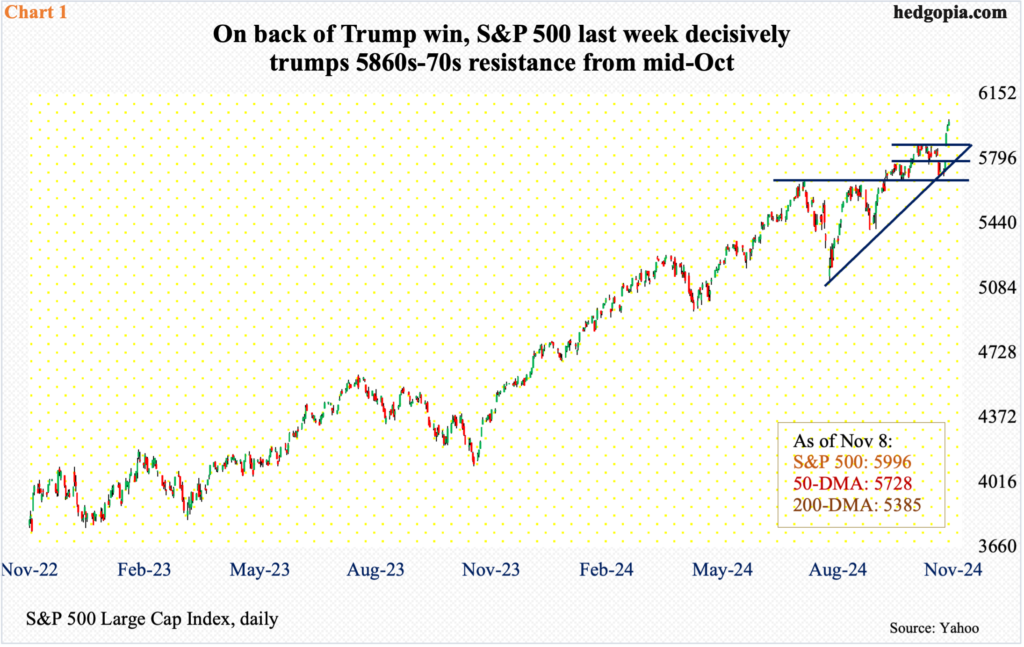
Leading into last Tuesday’s presidential and congressional elections, the S&P 500 was kind of stuck in a rut. It peaked at 5878 on October 17, hitting 5870s twice in the same week before and once more after that. Unable to penetrate that hurdle, the large cap index subsequently fell, before stabilizing at its 50-day, with last Monday’s low of 5697 slightly breaching the average intraday. It then rallied the next four sessions, adding 267 points – or 4.7 percent – for the week to 5996, with Friday establishing a new intraday high of 6012 (Chart 1).
With nearly two months to go, the index is now up 25.7 percent for the year. This follows last year’s 24.2 percent rally. These are heady returns. Bulls’ advantage is that the next several weeks tend to be favorable for stocks.
That said, the weekly has been overbought for several weeks now, and the daily will soon enter that territory. In an ideal world, the S&P 500 trudges higher before coming under pressure and then finding support. One such spot to do so is breakout retest at 5870s, and after that lies last Wednesday’s gap-fill at 5780s.
Equity bulls need cooperation from volatility.
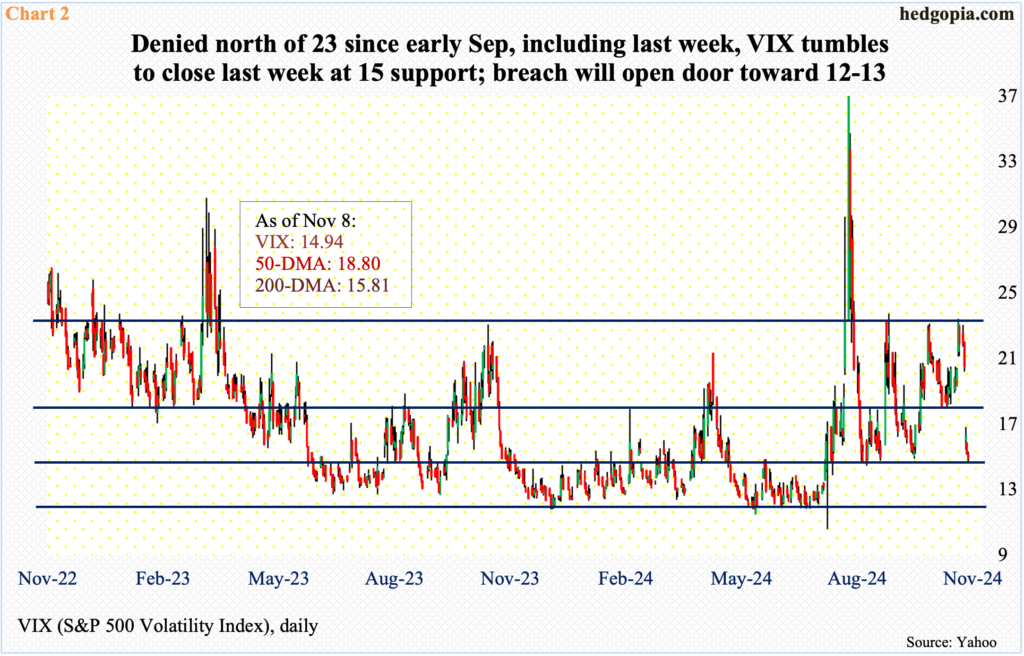
Last week, VIX tumbled 6.94 points week-over-week to 14.94. Previously, the volatility index was rejected just north of 23 beginning early September – including last Monday when it tagged 23.07 intraday. By the end of the week, both the 50- and 200-day (18.80 and 15.81 respectively) were breached, and VIX is sitting at crucial support (Chart 2).
A breach of 15 has the potential to drive VIX lower all the way to 12, where support is solid.
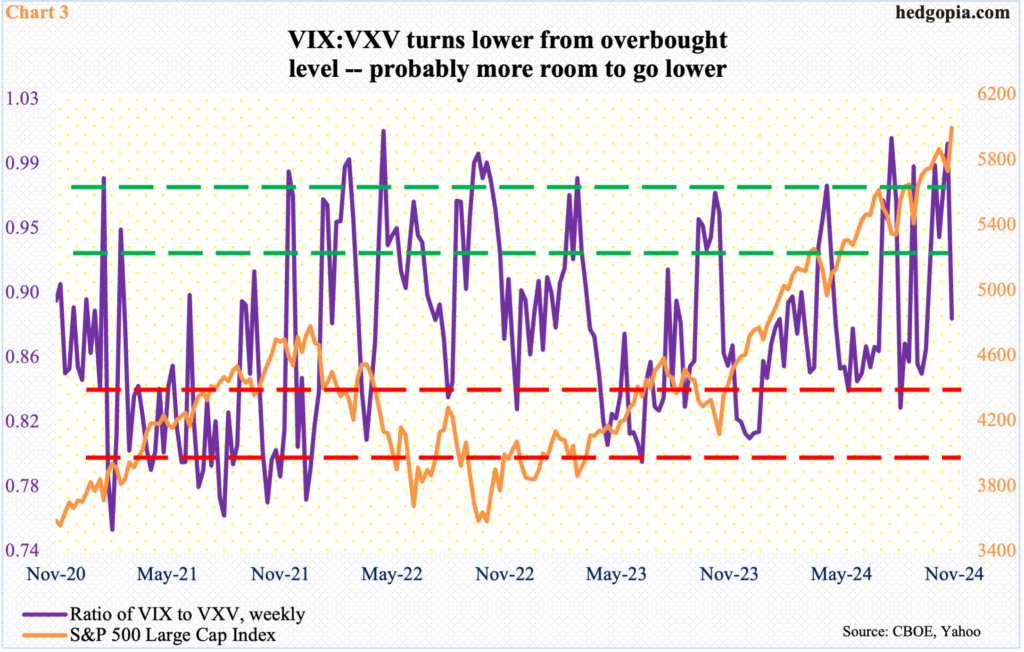
In this scenario, the ratio of VIX to VXV can continue lower toward support.
VIX measures market’s expectation of 30-day volatility on the S&P 500. VXV does the same, except it goes out to three months. When the investing climate is risk-on, as has been the case of late, demand for VIX-derived securities is lower than, let us say, VXV. The opposite is true when investor sentiment wanes.
Leading up to last week, for five successive weeks, the ratio sat in the 0.90s. Last week, it dropped to 0.89 and has room to go lower still before entering oversold territory (Chart 3).
If past is prelude, the ratio has genuinely tended to bottom in the high-0.70s to low-80s. Once it bottoms and heads higher, VIX begins to outperform VXV, putting the S&P 500 under pressure.
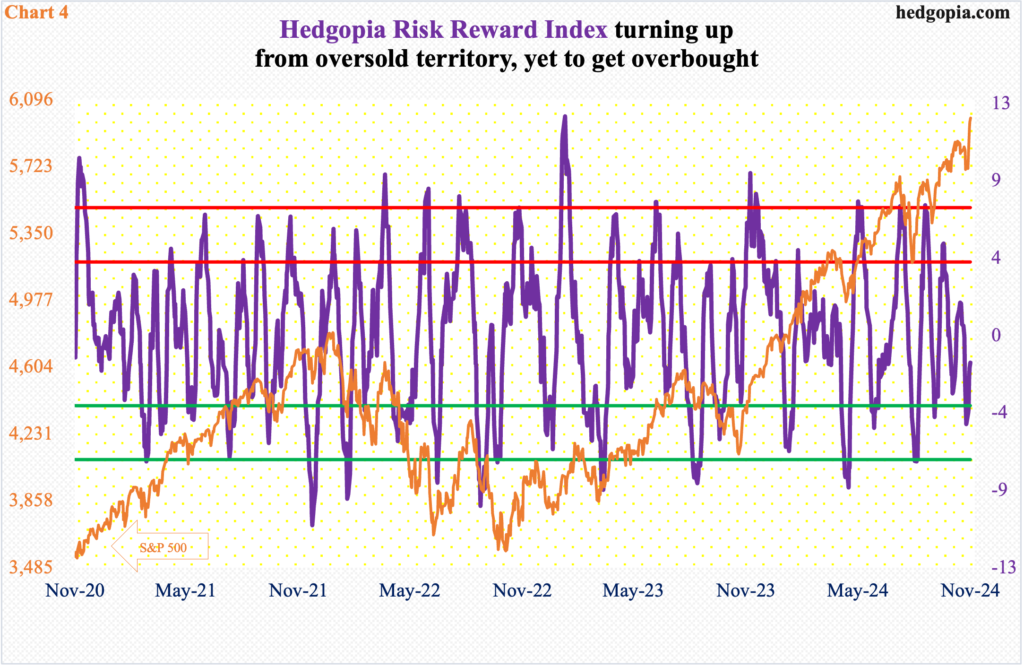
For that matter, our own Hedgopia Risk Reward Index is pointing toward the possibility of more gains ahead in the S&P 500 (Chart 4).
The index is designed to capture short-term swings, not mid- to long-term. As is true with any indicator, it is not perfect. Whiplashes do occur. But more often than not, it gets it right, playing ping pong between the red and green zones. It dropped into the green zone six sessions ago, and with the rally in the S&P 500 in the last several sessions, has moved up, with more room to run before entering the red zone.
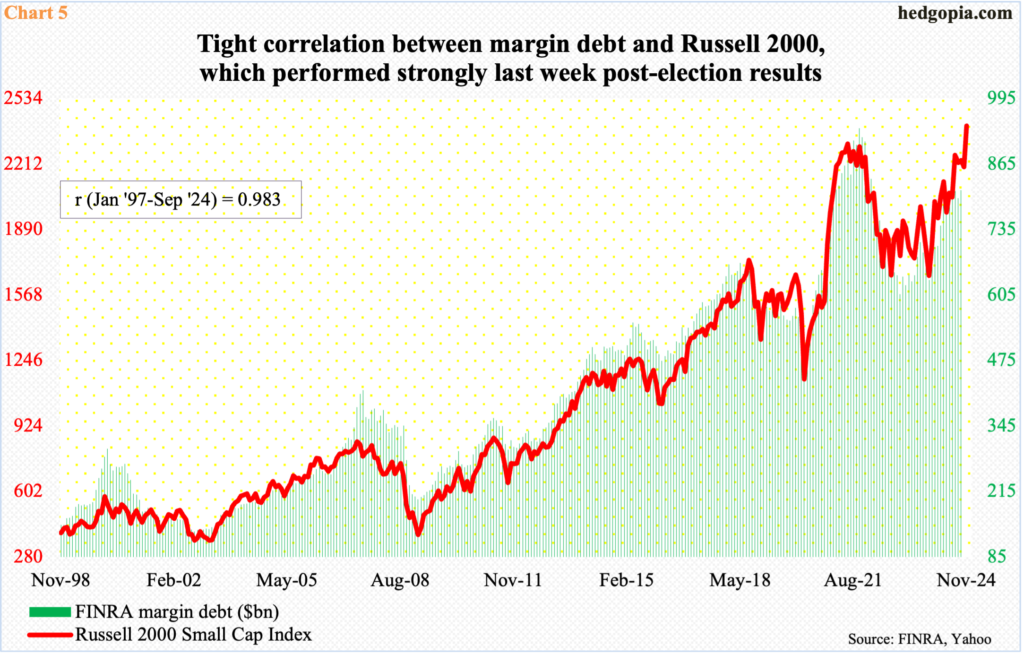
Amidst all this, margin debt through September has continued to be sluggish, when it increased $16 billion month-over-month to $813.2 billion. In October last year, when stocks bottomed, margin debt was $635.3 billion. So, there has since been a nice uplift in investor willingness to take on leverage, but the fact remains that margin debt remains more than $100 billion lower than the record $935.9 billion posted in October 2021.
The Russell 2000 and FINRA margin debt hold a very tight relationship (Chart 5). Last week, the small cap index shot up 8.6 percent to 2400, with an intraday high of 2402 on Thursday, decisively taking care of resistance at 2260s in place since mid-July. The index is now within 2.5 percent of its high from four years ago, when it peaked at 2459 in November 2021, although on a closing basis it is at a new high. It will be interesting to see if last week’s gains came on a meaningful increase in margin debt. To find out, we will have to wait a little.
It is more than a month before November’s numbers are reported, as the FINRA is yet to report October’s. November’s numbers will be telling.
For now, there is this. Even after last week’s massive rally in the S&P 500 – as well as the Nasdaq 100 – the daily and weekly RSI are still under 70 – mid- to high-60s. Momentum – the weekly in particular – has been in divergence with the price for weeks. This needs to change if equity bulls want to sustain last week’s pricing action.
Thanks for reading!

