
After a roller-coaster ride since peaking late January, U.S. equity indices have once again approached potentially critical technical juncture.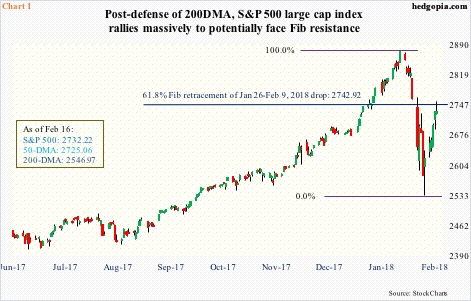
The S&P 500 large cap index peaked on January 26 at an intraday high of 2872.87, then dropping 11.8 percent intraday to 2532.69 on February 9. Bids showed up at/near the 200-day moving average. This was the first test of that average since early November 2016, just before the post-election rally.
After five sessions of countertrend rally since that low, the index last Friday closed essentially unchanged, unable to hang on to the intraday gains. At one time, it was up 0.9 percent. In the end, the session produced a shooting star. This is a potentially bearish candle, but needs confirmation. If Tuesday fails to make a higher high and closes under the Friday close, technicians would view it as confirmation. More important perhaps is where the candle showed up.
A 61.8-percent retracement of the aforementioned 11-session decline lies at 2743. Intraday last Friday, the index rose to 2754.42 before reversing (Chart 1). For Fibonacci fans, .618 is an important number.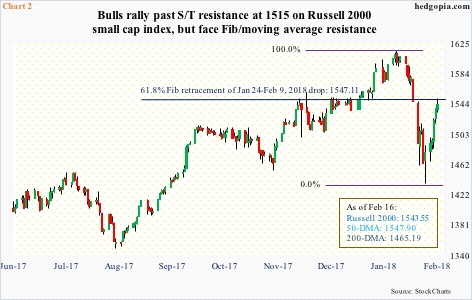
The same phenomenon was also at work Friday on the Russell 2000 small cap index.
On January 24, the index peaked at 1615.52, before beginning a cliff dive. By February 9, it had dropped to 1436.43. A .618 retracement of that decline lies at 1547. Both the 20- and 50-day lie there as well. Friday, it closed just underneath that level (Chart 2).
Of late, small-caps have also been lagging their large-cap brethren. In January, the Russell 2000 only rose 2.6 percent. In contrast, the S&P 500 was up 5.6 percent, and the Nasdaq composite 7.4 percent. During the recent selloff, of major U.S. indices, the Russell 2000 was the first to lose the 200-day and is yet to win back the 50-day.
This action is rather uncharacteristic of small-caps particularly considering the recently enacted tax cuts.
Small businesses inherently are domestically focused, hence the widely held perception – rightly or wrongly – that they benefit more from cuts in taxes and regulations than large-caps. But stocks have been acting otherwise.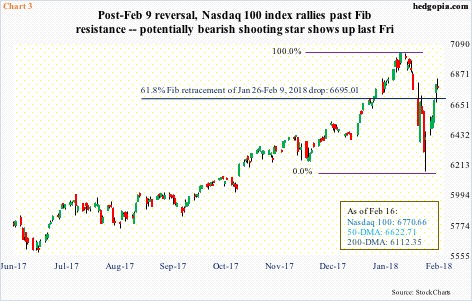
Right here and now, at least from the perspective of Fibonacci resistance, if there is any consolation for the bulls, it likely comes from the Nasdaq 100 index. A .618 retracement of the all-time high of 7022.97 on January 26 and the low of 6164.43 on February 9 lies at 6695. The index is already past that. It is also comfortably above the 50-day (Chart 3). But even here, a shooting star did appear last Friday. The candle also showed up on the Dow Industrials last Friday (not shown here).
Having appeared after a massive countertrend rally post-February 9 lows, this candle is worth watching. Particularly so when the indices mentioned above are so close to Fibonacci resistance.
Thanks for reading!
