
An oversold market, desperate for positive news – real or perceived – got some Tuesday. Major US equity indices rallied massively, closing right at/near important resistance. In the right circumstances for bulls, more upside is likely near term. Medium-term risks remain.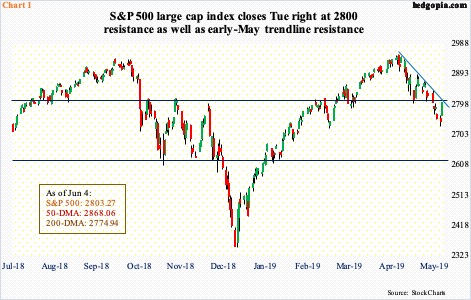
Equity indices had a very strong session Tuesday. The S&P 500 large cap index (2803.27) jumped 2.1 percent, the Nasdaq 100 index (7166.75) 2.7 percent and the Russell 2000 small cap index (1508.56) 2.6 percent, among others. This was preceded by sustained downward pressure that lasted through all of May. From early May through Monday’s lows, they were down 7.6 percent, 11.6 percent and 9.8 percent, in that order.
On the daily in particular, these indices were way oversold – looking for a reason to reverse. Tuesday offered a few – or was perceived by markets as such.
Fed Chair Jerome Powell said this in Chicago.
“We are closely monitoring the implications of these developments for the US economic outlook and, as always, we will act as appropriate to sustain the expansion, with a strong labor market and inflation near our symmetric two percent objective.”
This was a typical Fed speak. Nowhere does it tacitly declare that the Fed is close to cutting rates. If the economic outlook deteriorates, the Fed will act. This is no rocket science. Yet, markets’ collective wisdom interpreted this as dovish. Also Tuesday, Richard Clarida, vice-chair, said that he would take the inverted yield curve seriously if it persists for some time. The yield spread between 10-year notes and three-month bills recently inverted.
Last Friday, markets reacted badly to President Donald Trump’s Thursday tweet threatening to impose a five-percent tariff on Mexican imports beginning next Monday. Apparently, some GOP senators have warned the White House they would try to block this. At the same time, Mexican officials are in Washington currently holding talks with Administration officials.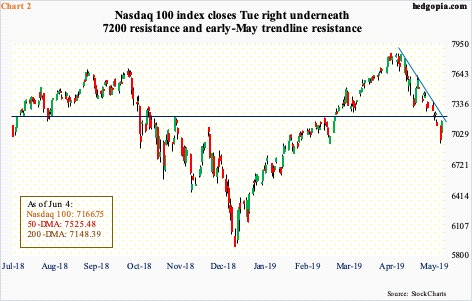
Combine all this and a recipe for a rally was concocted. All these three indices closed Tuesday at/near important resistance.
During the selloff last month, the S&P 500 not only lost 2800, which has proven to be an important price point going back to March last year, but also the 200-day moving average. The latter was reclaimed Tuesday, but not the former (Chart 1).
Similarly, on the Nasdaq 100, the average was retaken Tuesday, but barely. More importantly, it closed right underneath resistance at 7200 (Chart 2). Both these indices also closed right below trend-line resistance from early May.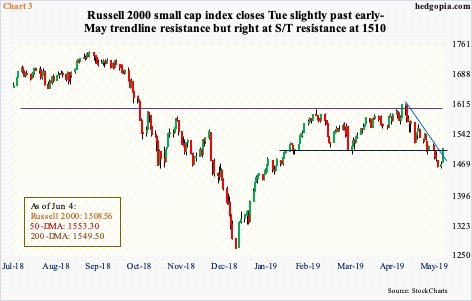
The Russell 2000, however, rallied past a similar trend line – albeit slightly – but it closed right at short-term resistance at 1505-1510. It remains under the 200-day (Chart 3). All these three indices remain below their 50-day.
On the Russell 2000, both these averages converge in 1550s. Bulls would love to test this, which is three percent away. On the S&P 500, the 50-day is 2.3 percent away, and on the Nasdaq 100 five percent away. In a scenario in which the news flow near term does not get any worse, or is not perceived as getting worse – be it on the trade front or as relates to rate expectations – the path of least resistance is up, if nothing else just to unwind investor fear that had been building.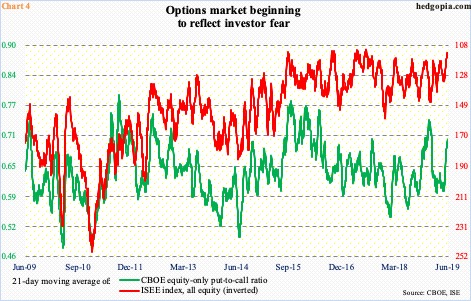
Chart 4 is one such metric, which plots the 21-day moving average of the CBOE equity-only put-to-call ratio and the ISEE index, all equity. The latter is a call-to-put ratio, hence inverted. It excludes trades from market makers and brokers/dealers, and only uses opening long trades. In general, the ISEE index is considered a cleaner of the two.
Both these metrics are at levels reflecting a decent amount of fear. The ISEE index, as a matter of fact, is not that far away from its record lows. The CBOE put-to-call ratio ended Tuesday at 0.706. Historically, it has shown a tendency to revert from high-0.60s/low-0.70s. As unwinding takes place, equities rally.
With that said, last December, the S&P 500 bottomed on Boxing Day. One session before that, on Christmas Eve, the green line in the chart peaked at 0.744.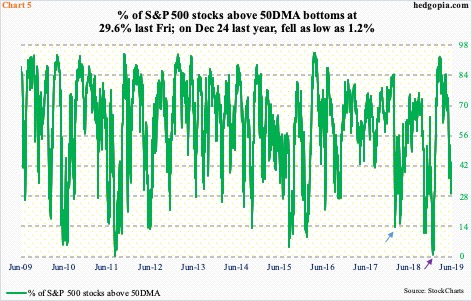
Along the same lines, there are several other metrics that are yet to reach washout lows. This week, Investors Intelligence bulls fell 6.3 percentage points week-over-week to 42.7 percent, even as bears rose 1.2 percentage points to 18.5 percent. Early January, they were respectively 29.9 percent and 34.6 percent.
Similar dynamics are at play in Chart 5, which shows the percent of S&P 500 stocks above the 50-day. Last Friday, the metric bottomed at 29.6 percent, with Tuesday at 40.1 percent. On Christmas Eve, it bottomed at 1.2 percent (violet arrow), which, among other things, laid the foundation for the rally in the S&P 500 that followed. Before this, in early February last year, it dropped as low as 13.6 percent (blue arrow).
Hence the odds that a durable bottom in the aforementioned indices is yet to occur. Risks remain medium- to long-term.
Thanks for reading!
