
This week is crucial. The FOMC meets, and an inflation report that could potentially impact monetary policy next year is on deck as well. Leading up to this, both large- and small-caps met with heavy selling pressure at crucial resistance.
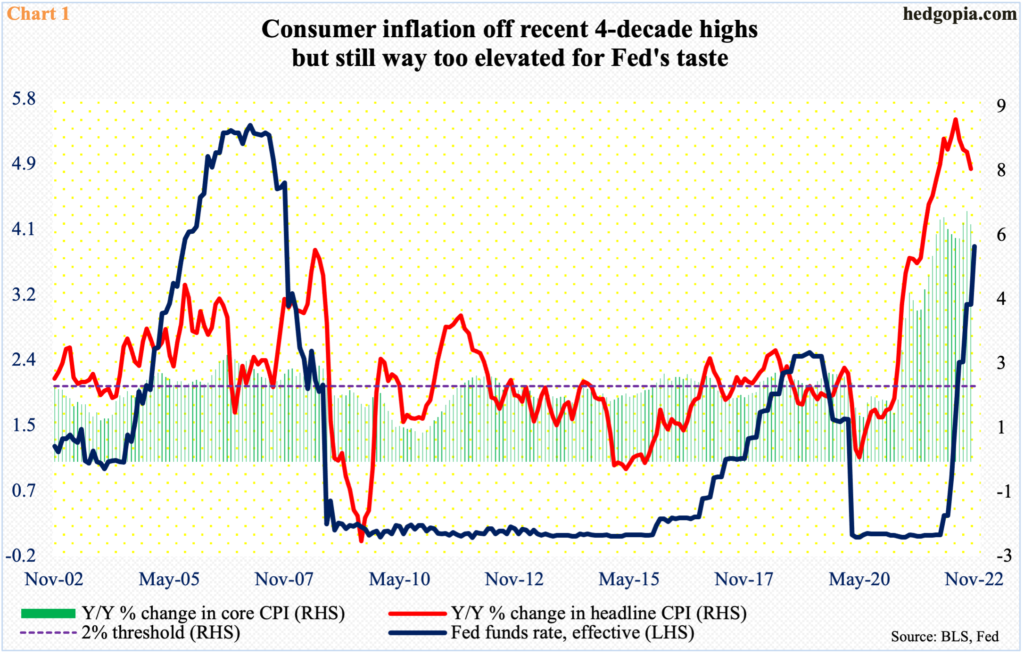
November’s consumer price index is due out on Tuesday. That same day, a two-day FOMC meeting gets underway. A 50-basis-point increase is pretty much locked in. This will be a step-down from four consecutive 75-basis-point hikes. The fed funds rate currently stands at a range of 375 basis points to 400 basis points, up from zero to 25 basis points in March (Chart 1).
On November 10, both headline and core CPI was reported lower than expected for the month of October; both bonds and stocks rallied, with the S&P 500 jumping 5.5 percent. Since that report, and aided later by October’s PCE (personal consumption expenditures) inflation, markets have significantly dialed down pivot expectations.
As things stand, futures traders expect the Fed to stop hiking in the first half next year just north of five percent. This is in line with the signals coming from the Fed. However, the two massively diverge as to when to start cutting. Powell has signaled several times that rates will be held higher for longer – meaning once they pause, they would leave it there for a while. Markets, however, want the Fed to pivot a lot sooner, with futures traders pricing in two 25-basis-point cuts by next December.

Time will tell how this evolves.
Leading up to this, both large- and small-caps are beginning to act iffy.
First off, the major US equity indices have had a phenomenal rally off October’s lows. The S&P 500 large cap index, for instance, bottomed at 3492 intraday on October 13 and went on to rally 17.4 percent through the December 1 intraday high of 4101.
Last week, the S&P 500 closed at 3934, down 3.4 percent week-over-week. In the week before, rally attempts were vigorously repelled at dual resistance – the down-sloping 200-day (currently 4037) plus a falling trend line from January when the index peaked at 4819. Since the October bottom, the large cap index also traded within an ascending channel, which it fell out of last week (Chart 2).
The index remains above lateral support at 3900. Once it gets breached, the path toward the up-sloping 50-day (3840) and, worse, 3630s opens up. Hence the significance of this week.
If, let us say, CPI cooperates, (1) Federal Reserve Chair Jerome Powell may not soften his tune as inflation remains way ahead of the benchmark rates (Chart 1), or (2) even if he moderates his message, stocks may not react the way they did on November 10, as (1) they have rallied big off October’s lows already, and (2) they are also beginning to focus on the prospects for recession next year.
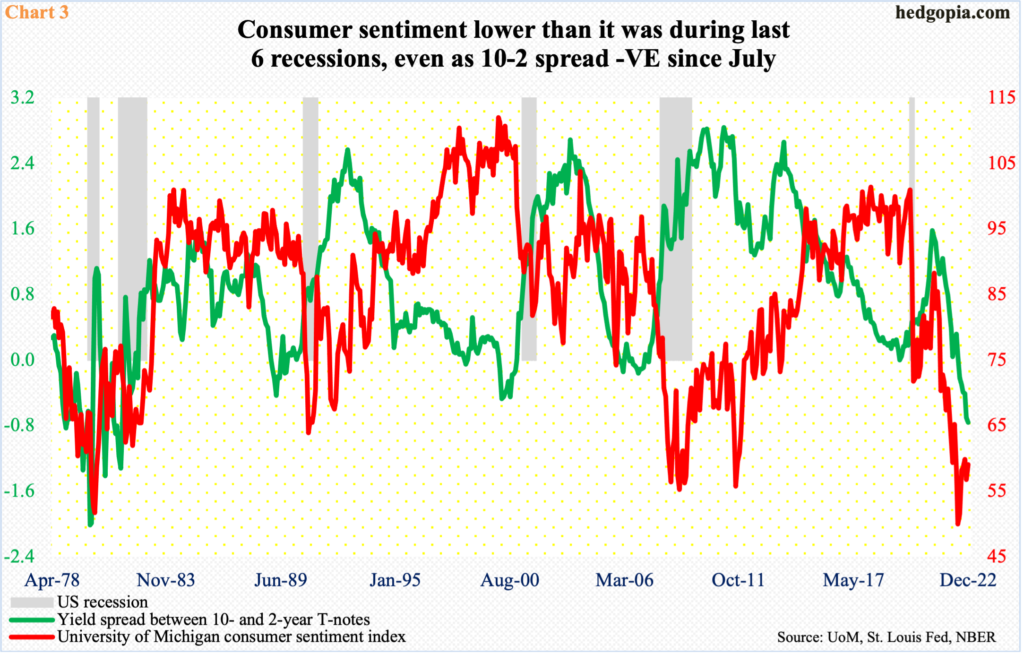
Last week, the yield spread between 10- and two-year treasury notes was minus 0.76 percent (or 76 basis points). In July, for the first time since May 2007, the spread dipped into negative territory, and has stayed there since (Chart 3).
Going back more than four and a half decades, this always preceded economic contraction (during the short and shallow Covid-19 recession, the spread did not quite go negative, but went flat by August 2019).
Concurrently, the University of Michigan’s consumer sentiment index reached an all-time low 50 this June, with December’s preliminary reading at 59.1 (series dates back to January 1978). Needless to say, all six recessions in Chart 3 set in when sentiment was stronger.

Small-caps are sending the same message.
Inherently, small businesses carry more domestic exposure than their mid- or large-cap brethren and are thus more deeply exposed to the ups and downs of the US economy. When economic prospects are bright, investors tend to, not surprisingly, gravitate toward the Russell 2000. The small cap index thus acts as one of the ways to measure risk-on.
Right now, investors are avoiding that risk.
The Russell 2000 peaked in November last year at 2459 and plunged 33.2 percent through the October 13 low of 1642. Along the way, it lost crucial horizontal support at 1700 but the breach did not last. The index closed back above that threshold on the 17th that month. Small-cap bulls then proceeded to rally the index 16.1 percent through the November 15 high of 1905. That was the second time 1900 was tested after losing it in late August, and it failed. The level was once again tested early this month, and once again the bears prevailed (Chart 4). This is top of the 1700-1900 range, and a decisive breach of 1800 opens the door for 1700 again.
If small-cap bulls believed next year’s prospects were good for both the economy and earnings, they would be falling over each other to buy the Russell 2000 at these levels, mopping up all the supply that is likely to show up at 1900.
As far as this week is concerned, if on Wednesday Chair Powell says/repeats (1) inflation is high and rates will remain higher for longer, and (2) the Fed would not mind economic pain to bring it under control, stocks likely will be on the defensive.
Thanks for reading!
