
Investors increasingly are hiding in large-caps. The S&P 500 large cap index Monday reached a new all-time high, while the S&P 600 small cap index closed Tuesday 16 percent off its all-time high from last August. Stocks are rallying but risk-on vibes are missing in action.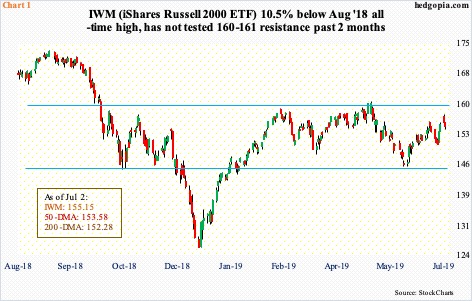
US stocks in general had an excellent June. July got off to a good start as well. The S&P 500 rallied 0.8 percent Monday to a new intraday high of 2977.93, with a new closing high of 2973.01 on Tuesday. But underneath this feel-good story lurks lagging performance by mid- and small-cap stocks.
The S&P 400 mid cap index peaked last August at 2053.06 and closed Tuesday at 1946.19, down 5.2 percent from that high. The S&P 600 small cap index (948.46) peaked last August as well, at 1100.58; it is currently 13.8 percent from that high. The other major small cap index, the Russell 2000 small cap index, is down 10.4 percent from its August 2018 high. The performance difference in these two indices is due to their respective makeup, but both are lagging. IWM (iShares Russell 2000 ETF) tracks the Russell 2000.
Since January last year, 160-161 on IWM (155.15) has proven to be an important price point (Chart 1). In May that year, the ETF broke out on its way to August’s all-time high of 173.39. In October, it lost that support, followed by several unsuccessful attempts. It is still 10.5 percent from that high. Bulls need to reclaim this level to at least try to regain momentum.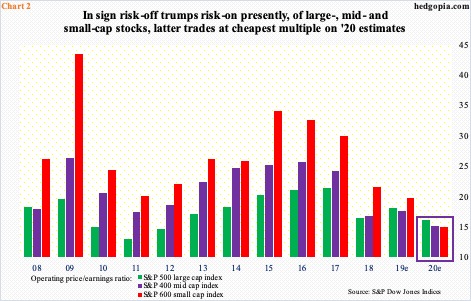
Chart 2 nicely captures the prevailing aversion to small-caps, using the P/E lens for S&P 500/400/600 companies. Typically, small-caps tend to trade at a higher multiple than mid-caps and mid-caps higher than large-caps. On 2020 estimates, however, there is a role reversal, with the S&P 600 trading at 14.9x, the S&P 400 at 15.1x and the S&P 500 at 16.2x.
The revision trend for estimates has been down for all three.
In March, S&P 500 companies next year were expected to earn $186.36 in operating earnings, which has now been revised lower to $184.01. Between January and now, S&P 400 companies’ 2020 estimates went from $136.71 to $128.72 and between February and now S&P 600 companies’ from $67.63 to $63.60. Thus far, small-caps’ 2020 estimates have been revised lower by six percent and large-caps’ by 1.3 percent. Markets are voting the downward revision trajectory continues, hence suppressed multiple for the S&P 600.
Buy-and-hold types will struggle in times like this. Nimble traders can still do well. After rallying for four straight weeks, IWM is down 0.2 percent week-to-date. Immediately ahead, this likely continues. Monday, the ETF at one time was up 1.6 percent but bulls were unable to hang on to the gains closing up merely 0.4 percent. Tuesday, it shed 0.6 percent, even as most other major equity indices rallied. Large-caps are making new highs, but not amidst risk-on sentiment.
Thanks for reading!
