
Amidst mixed signals in the economy and divergences with the bond market and crucial metals, among others, US stocks continue to rally to new highs.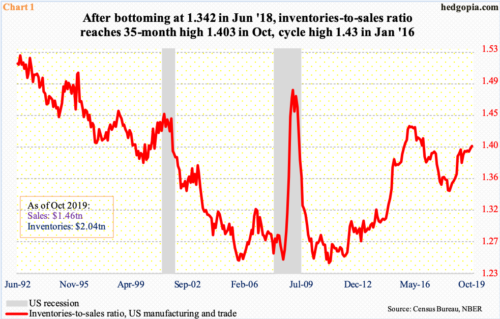
US inventories are building – again.
In October, manufacturing and trade inventories rose 0.2 percent month-over-month to $2.04 trillion, while sales fell 0.1 percent m/m to $1.46 trillion. Inventories were at a record, even as sales reached their highest $1.46 trillion in August.
As a result, the inventories-to-sales ratio rose to 1.402 in October, which was the highest since November 2016. The ratio has been rising since bottoming in June last year at 1.342 but is still lower than the cycle high 1.430 reached in January 2016 (Chart 1).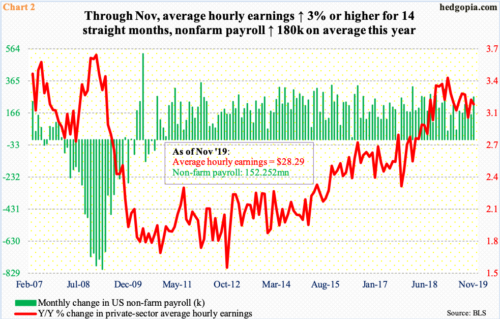
Inventories are accumulating even as the economy continues to send out mixed signals.
The jobs picture is decent. In November, the economy added 266,000 jobs, for a monthly average this year of 180,000, which is slower than the monthly average last year of 223,000. But given that the economy is in its 11th year of post-Great Recession recovery/expansion, this is more than respectable.
Average hourly earnings are not going gangbusters but holding up. In November, they grew 3.1 percent year-over-year to $28.29. This is the 14th consecutive monthly increase of three percent or higher – or 15th out of last 16 months (Chart 2).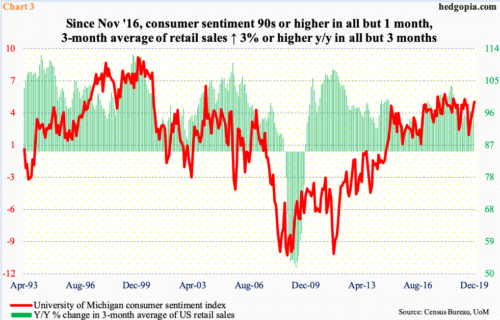
Consumer sentiment is buoyant, and consumers are spending.
December’s preliminary reading showed the University of Michigan’s consumer sentiment index rose 2.4 points m/m to 99.2. Except for August’s 89.8, this was the 38th consecutive monthly reading of 90 or higher, four of which were 100 and above.
Retail sales are healthy. In the 12 months to November, they rose 3.4 percent to a seasonally adjusted annual rate of $528 billion – a record. The three-month average of sales grew 3.5 percent in November – eighth monthly increase of three percent plus in a row (Chart 3).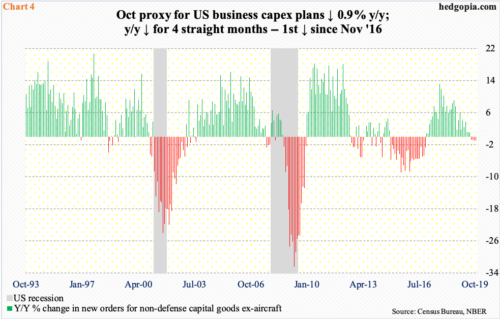
The picture is not as sanguine when it comes to capital expenditures.
In the 12 months to October, orders for non-defense capital goods ex-aircraft – proxy for business capex plans – contracted 0.9 percent to $69.3 billion. The all-time high of $70 billion was reached in July last year.
October’s y/y decline was the fourth monthly contraction in a row. The last time this metric dropped y/y was November 2016, and it was much more severe back then – both in terms of magnitude and duration (Chart 4).
Nevertheless, capex leaves much to be desired, as does manufacturing.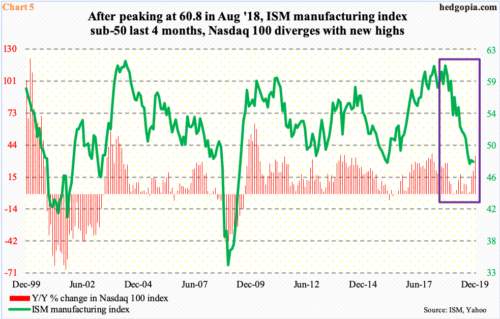
Manufacturing is in recession. The ISM manufacturing index has been sub-50 the last four months, with November down two-tenths of a point m/m to 48.1. The cycle high of 60.8 was reached in August last year. Historically, it is hard to sustain activity above 60 for too long. From that high, the index dropped to 47.8 in September this year (box in Chart 5). The box also highlights a divergence – that of how the Nasdaq 100 is behaving.
Historically, the two variables in the chart move together. This time around, despite the decline in manufacturing, the Nasdaq 100 last Friday posted a new high. This is also true with the S&P 500 large cap index, which too hit a new high last Friday.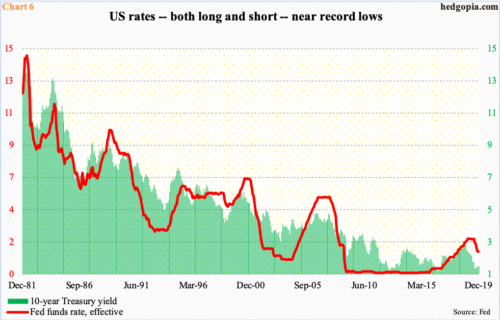
From many respects, equities are in their own world, diverging with a whole host of other assets. The message coming from equities is not being confirmed by the bond market either. Or, the benchmark rate, for that matter (Chart 6).
The 10-year Treasury yield (1.82 percent) early September dropped to 1.43 percent before rising. Back in July 2012, rates fell to 1.39 percent, which was followed by a drop to 1.34 percent in July 2016.
The September low thus can be viewed as a retest of the prior lows. The rally since got stopped on November 7 at just under two percent. With that said, there has been a pattern of higher lows the past three months, but no higher highs yet. For that to happen, the 10-year has to eclipse 1.97 percent, and for that to happen, the weak spots of macro such as manufacturing need to churn out better numbers.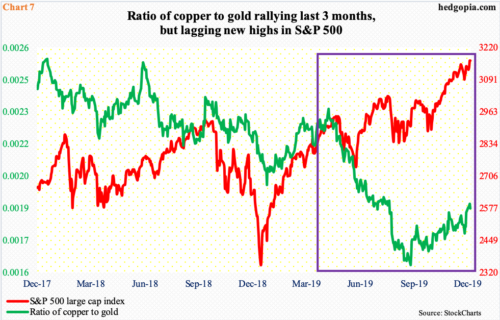
Speaking of macro, copper is an important base metal. Known as Doctor Copper, it is used as a barometer to take a pulse on the economy. Investors treat the metal as a risk-on indicator. In contrast, gold is treated as risk-off, as investors gravitate toward the metal when they are fleeing risky assets like equities. Because of this, a ratio of copper to gold can be used to gauge investor mood at any given point in time.
Most recently, the ratio bottomed early September, having peaked earlier in the middle of April (Chart 7). When copper began to lag gold, the S&P 500 followed. The latter soon stabilized – in early June – but not the ratio, which kept dropping until the aforementioned trough. This can be viewed as divergence, as either copper has not rallied enough or gold has not dropped enough to confirm the fresh high in the S&P 500.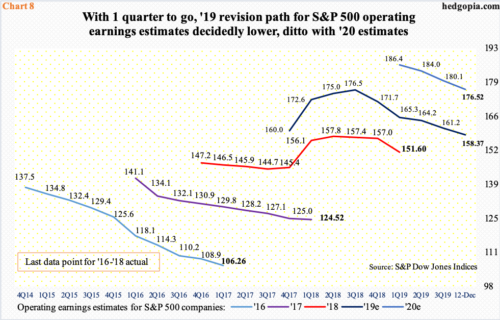
All along, because the sell-side’s optimism has not quite panned out, earnings estimates for both this year and next have continued lower.
In August last year, this year’s operating earnings estimates for S&P 500 companies were as high as $177.13. As of last Thursday, they stood at $158.37. For next year, estimates went from $186.36 in March this year to $176.52. This still assumes 2020 growth of 11.5 percent – hard to trust given the downward revision trend. A lot of things probably need to go right for this scenario to materialize, including continued rally in the 10-year yield and the copper-to-gold ratio. Else, stocks would have continued to diverge.
Thanks for reading!
