
A P/E of 17x on the S&P 500 large cap index cannot be called euphoric. A little above average, sure, but not euphoric. On forward operating earnings using next year’s estimates, that is what the index is currently trading at.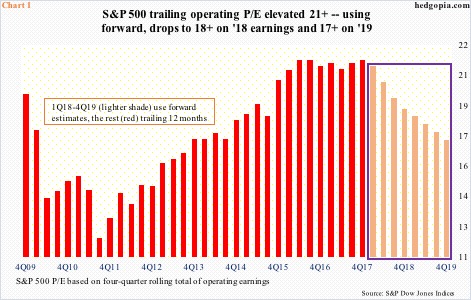
In all likelihood, now that 2018 has begun, the ‘markets not expensive on next year’s earnings’ meme will begin to float.
But how realistic are next year’s estimates, and by default the P/E derived thereof (Chart 1)?
In 2019, S&P 500 companies are expected to earn $160.03 in operating earnings, versus $145.80 this year and, with one quarter to go, $125 in 2017. If these estimates come through, earnings would have grown 9.8 percent in 2019, following 16.6 percent this year and 17.6 percent last year.
These are heady growth rates – well above average – and, among others, assumes the U.S. economy to kick into higher gear, which is what the Trump administration expects the recently enacted tax law to bring about.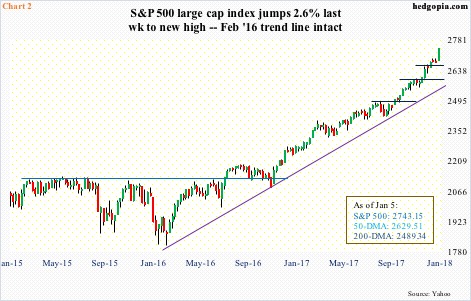
At least going by how U.S. equities have ushered in the new year, they are beginning to price in a better fundamental story. Technical breakouts have come hand in hand.
In the first four sessions this year, the S&P 500 already gained 2.6 percent, breaking out of short-term resistance at 2700, which the bulls will for sure try to defend the next time the index comes under pressure.
Particularly since the index broke out of 2100-plus in July 2016, the bulls have persistently defended broken resistance. That breakout was preceded by a low in February that year. A trend line drawn from that low has been tested a few times, and never lost (Chart 2).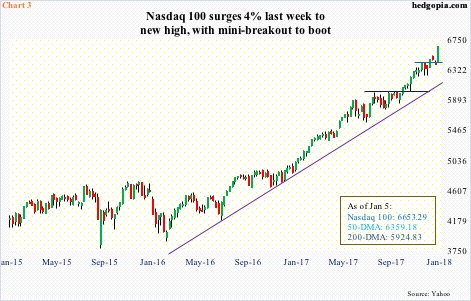
Over on the Nasdaq 100 index, it is the same story. It jumped four percent last week – the largest weekly rally since November 2015! Major moving averages are all on the rise – also the case with the S&P 500.
The February 2016 trend line is intact on the Nasdaq 100. Besides the breakout last week, its most recent decent breakout occurred in early October last year – out of 6000 (Chart 3).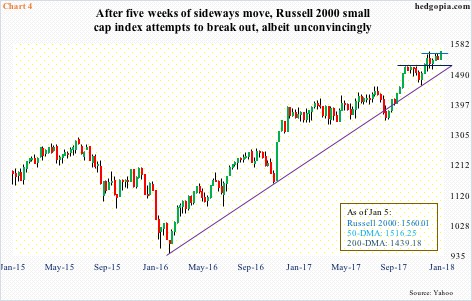
Along with several others including the Dow Industrials, both these indices have rallied to new highs. Ditto with the small-caps, but in an unconvincing manner.
The Russell 2000 last week rallied 1.6 percent, notching a new intraday high of 1560.84, just past the prior high of 1559.61 on the 4th last month. In essence, the index has gone sideways the past six weeks.
Before this, the index stalled at the 1515 level for several weeks (Chart 4). Resistance was expected considering a 161.8-percent Fibonacci extension of the June 2015-February 2016 decline lied at 1514.09.
But even after clearing that resistance, small-caps are struggling. Does this poke a hole in the tax cut story? Because they are domestically focused, small-caps inherently are perceived to be larger beneficiaries of tax cuts.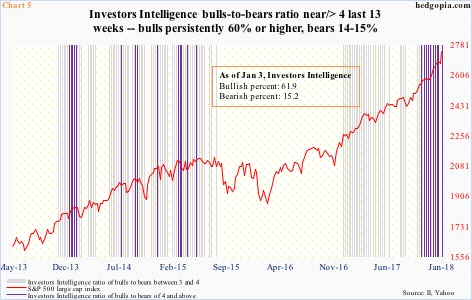
It is important to keep in mind that to get this far the bulls have expended a lot of energy.
American Association of Individual Investors’ (AAII) stock allocation in December rose three points to 72 percent, which was the highest since registering 77 percent early 2000 (courtesy of Dana Lyons).
In 3Q17, Charles Schwab clients held a historically low 11.1 percent in cash. This compares with 13.4 percent in 1Q00 and 13.5 percent in 3Q07. Could it go lower? Sure it could.
Or take the prevailing euphoria among newsletter writers. Investors Intelligence bulls have been 60 percent or higher for three months now, even as the bears are stuck in the 14-15 percent. In 12 of last 13 weeks, a ratio of bulls to bears has been four or higher, with the other two times 3.95 and 3.99 – essentially four. Chart 4 shows how rare this phenomenon is.
With that said, these writers deserve kudos in that they have been on the right side of the market.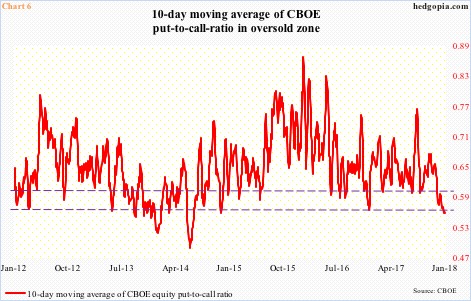
This is also true with those expressing their bullish bias in the options market.
In 25 of last 33 sessions, the CBOE equity put-to-call ratio produced readings in the .50s. The 10-day average last Tuesday was .554, with Friday at .556. That low was the lowest since November 2014 (Chart 6).
As rare as these readings are, could they still go lower? Absolutely. In fact, in June 2014 the 10-day average dropped to .485.
It is these kinds of excesses that probably lead shorts to get active. And active they have been on XLK (SPDR technology ETF), for instance (more here). Bulls see this, and stay put, hoping to squeeze. This, in turn, leads to more excesses.
The monthly RSI on the S&P 500 is north of 86, and remained north of 70 throughout 2017. On the Nasdaq 100, it is at north of 83; back in March 2000, it peaked near 90.
The lesson in all this is to learn to respect the price as the final arbiter, but be aware that signs of excesses abound.
For now, the nimble ones are probably watching shorter-term averages. For the bears to get any traction, the 10- and 20-day on the afore-mentioned indices need to at least stop going up, let alone roll over.
Thanks for reading!
