 Are we there yet? Have we yet reached the escape velocity? You know the 6.96 miles-per-second speed needed to break free from the gravitational pull of the earth. I am of course figuratively referring to the prevalent expectations that the U.S. economy would be able to reach escape velocity this year.
Nothing new. Since 2010, growth expectations at the beginning of the year have consistently been higher, only to see those ratcheted down as the year unfolds.
The wait has been long and painful.
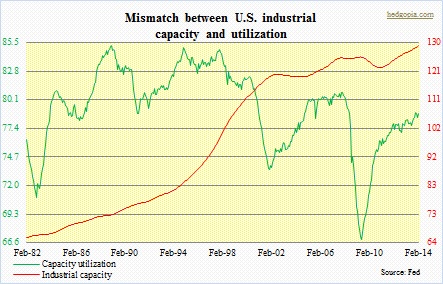
The so-called Great Recession ended June of 2009, yet several important metrics are still lagging pre-crisis levels. Non-farm employment peaked at 138.4mn back in January 2008, vs. 137.9mn in March this year. Industrial capacity utilization came in at 78.8 in February this year, a full two points lower than the December 2007 peak. Back in 4Q07, real GDP peaked at $14,996b; at $15,933bn, 4Q13 was higher, but we are talking about a recovery spanning five years. Not much to write home about.
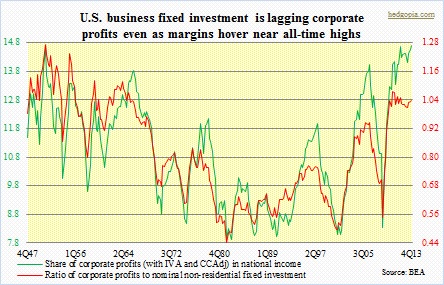
 The hope this year is that business capital spending picks up. The chart on the right shows how in the current cycle corporate margin expansion has not resulted in expansion in business investment. Corporations are wallowing in profit and have also levered up – non-financial corporate debt at $9.4tn, vs. $7.2tn in 4Q07 – with a good portion of that having gone toward stock buybacks and dividend payouts.
If they are not willing to commit to capex when profits are gushing and margins at all-time highs, one wonders if the capex-will-pick-up-this-year thesis has any validity to it. Corporate capex follows consumer spending, and the latter is flat on its back. Labor’s share of national income was 66.2 percent in 4Q08; by 4Q13, it was down to 60.7 percent. As the chart above shows, corporate share of national income has maintained a consistent upward bias.
The bond market surely does not buy the capex-to-the-moon thesis. Treasuries on the long end keep getting bid up.
In this context, is the recent selloff in equities a sign that equity investors are reaching the same conclusion? The selloff was quick and brutal, particularly for former high-fliers, including biotech, social, cloud software, 3-D printing, solar, and to a lesser extent, semi stocks. Momentum is out of these former darlings of momentum crowd, and there are footprints of institutional exit.
Two questions come to mind.
First, back in the day, when QE1 and QE2 ended, stock markets began to act like drug addicts denied of their daily dose. In 2010, the SPX fell 17 percent between April and June, and in 2011 by 22 percent between April and September. The economy followed suit. The Fed reacted, of course by announcing more stimulus. That at least stopped the routing in stocks, though the much-hoped-for ‘escape velocity’ in the economy remained exactly that – a hope.
So the question becomes, how would the Fed react if stocks do not stabilize soon? There has been some technical damage done already, but it is not something that cannot be rectified.
As was the case in 2010 and 2011, in 2012 there were two decent drops – 11 percent in 1H and nine percent in 2H – before QE3 was announced in September of that year. Let us assume a worse-case scenario in which stocks fail to stabilize, and the Fed decides to wait at least until the damage is equivalent to the 2012 drop, that will cause more technical damage. Technical sell signals will ensue.
 Margin debt is at such an elevated level that a maintenance-margin call has the potential to set off a chain reaction.
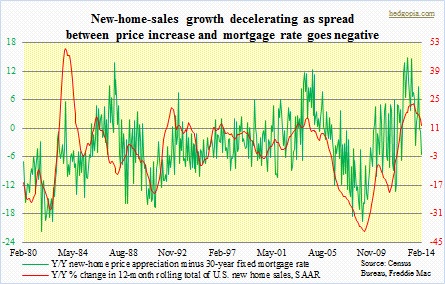
Will they be willing to wait that long? The Ben Bernanke Fed firmly believed in the ‘wealth effect.’ On a 60 Minutes interview in December 2010, he openly bragged how his policy resulted in higher stock prices. Higher home prices is another tool they have pursued. And even on that front, there are signs of trouble, as the combo of higher interest rates and price appreciation is impacting new sales.
Chair Janet Yellen is new to the job, but every indication is that she shares the view of her predecessor as regards to wealth effect.
 Under this scenario, they will act. Inside the Fed, there are not enough voices of reason. There is Charles Plosser (president of the Federal Reserve Bank of Philadelphia) and there is Richard Fisher (president of the Federal Reserve Bank of Dallas). Governor Jeremy Stein was another, but he is leaving by the end of May – after two short years. Doves are in the clear majority.
This then leads to the second question. How would traders/investors react to news of more stimulus? Hindsight is always 20/20, but every time one was announced, it would have been a good decision to go long. Buy-the-dip worked every single time.
Here is the thing. Between now and back then, things are a lot different on a whole host of levels. The federal debt currently stands at $17.4tn, vs. $9.4tn at the beginning of 2008. The Federal Reserve’s own balance sheet has grown from less than $900bn in August 2007 to $4.2tn now. The higher the leverage, the lesser the flexibility.
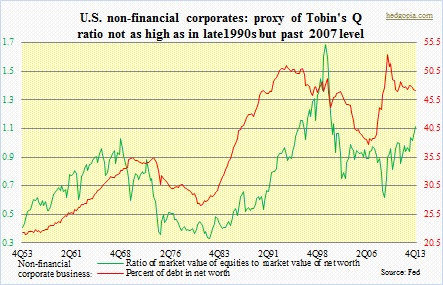
 Perhaps the most crucial difference between now and then is the fact that we now have five more years of data to compare and contrast – to see how anemic the recovery has been vs. in the past. Previously, every time there was more monetary stimulus, investors hoped/believed that it would work. Now, they have as many data points showing the outcome was anything but. In the meantime, Tobin’s Q ratio – not a fail-proof tool but worth a look – is over one.
So it is entirely possible that trader/investor reaction would be different this time. Or maybe not. We will find out when that day comes. The first signs would probably be revealed in what kind of rally/bounce we get. We are probably due one. This morning’s bounce is failing to hold.
Short-term, things are getting oversold. First-quarter earnings expectations have consistently trended lower throughout the quarter, so the bar is easy to hurdle. A trade could be developing here. A good tell would be which stocks rally and how, and if the big elephants decide to rejoin the party.

