
The top five stocks report this week. They have rallied massively since March lows. Investor reaction to their earnings will determine if major cap-weighted indices continue their five-week upward momentum or hit the wall.
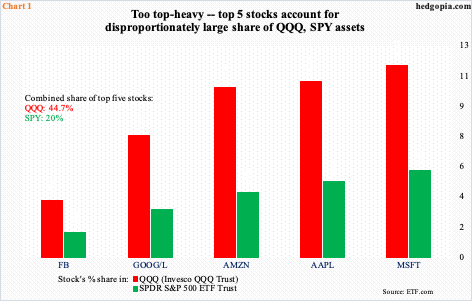
This week, the big five report. Big five meaning the five largest companies by market cap. In cap-weighted indices such as the Nasdaq 100 index and the S&P 500 large cap index, they will therefore have an outsize influence. This is even more so now as their combined share is disproportionately high (Chart1).
Microsoft (MSFT), Apple (AAPL), Amazon (AMZN), Alphabet (GOOG/L) and Facebook (FB) together account for 44.7 percent of QQQ (Invesco QQQ Trust) and 20 percent of SPY (SPDR S&P 500 ETF). This is very top-heavy. The significance of 1Q20 earnings – or, how they will be perceived in markets – cannot be overstated.
GOOG reports on the 28th, MSFT and FB on the 29th, and AAPL and AMZN on the 30th. Ahead of this, from March lows through recent highs they all rallied handsomely, with AMZN the most at 51 percent and GOOG the least at 28 percent.
Even as the top five are getting ready to report, major equity indices have rallied to crucial juncture themselves. As things stand, the odds of a breakout are as good as that of a rejection followed by a rollover.
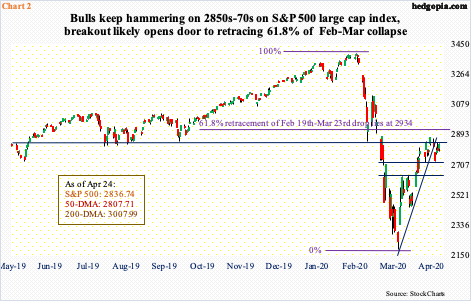
Last week, the S&P 500 (2836.74) breached a rising trend line from its March 23rd low (Chart 2). Through Tuesday’s low, the index at one time was down as much as 5.1 percent. But before this could spiral out of control, bulls stepped up in defense of 2720s. By Friday, they were once again eyeing resistance at 2850s-70s. A breakout likely opens the door to 61.8-percent retracement of the February-March collapse, which lies at 2934.
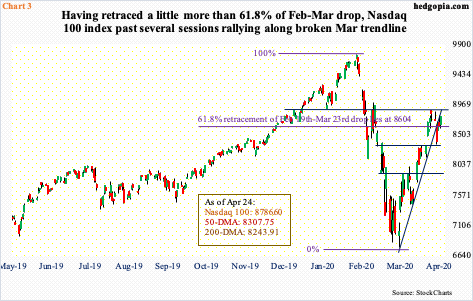
The Nasdaq 100 (8786.60) already retraced 61.8 percent of its February-March decline, which lies at 8604 (Chart 3).
But as is the case with the S&P 500, it too lost a rising trend line from March 23rd. This took place last Tuesday. The selloff in that session stopped at a confluence of the 50-day moving average and horizontal support at 8350s.
The last several sessions, the Nasdaq 100 rallied all along the broken trend line. Should this continue, bulls could be eyeing resistance at 8870s, which repelled breakout attempts six sessions ago. Post-earnings reaction to the top five this week will decide if bulls continue to carry momentum or it shifts bears’ way.
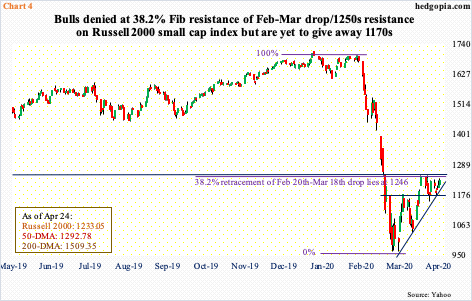
The story is the same with the Russell 2000 small cap index (1233.05). It rallied nicely off the March 18th low, but unlike its large-cap peers, it only managed to retrace 38.2 percent of its February-March crash, which lies at 1246. This approximates five-year horizontal resistance at 1250s (Chart 4). At least twice over the last 11 sessions, sellers showed up as soon as this level was hit. At the same time, bears have not been able to make much out of this. Bulls defended both straight-line support at 1170s and trend-line support from the March low. The deadlock will be broken by either a decisive breakout of 1250s or a breach of 1170s.
Just in case the bull-bear stalemate goes the former’s way, potential fuel for squeeze is there.
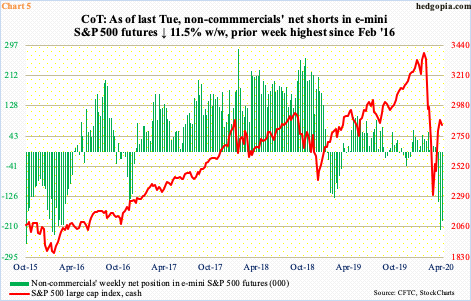
In the futures market, non-commercials as of last Tuesday were net short 192,656 contracts in e-mini S&P 500 futures. This was down from 217,781 contracts in the prior week, which was the highest since February 2016 (Chart 5). Stocks made a major low back then.
Should 2850s-70s convincingly fall, non-commercials have a decision to make – cover, stay put or add.
Elsewhere, SPY short interest surged from 124 million mid-February to 238.2 million at the end of March before dropping to 226.1 million mid-April. This is elevated.
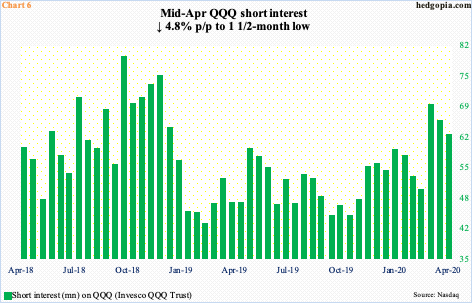
Speaking of short interest, it was 61.9 million shares on QQQ mid-April. This is down from 68.5 million from a month ago, but the mid-March tally was at a 15-month high. In ideal circumstances for bulls, there is room for the green bars in Chart 6 to continue lower.
Once again, for this scenario to come to pass, the Nasdaq 100 needs to take out 8870s. Results this week from the top five can act as a catalyst – or not.
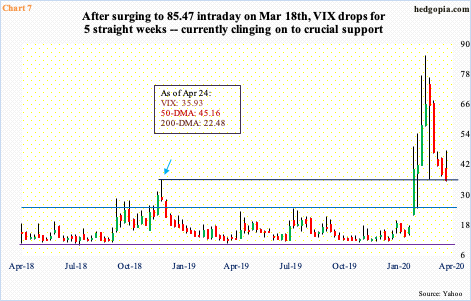
Perhaps not surprisingly, VIX (35.93) too closed last week clinging on to important support. Friday’s 5.45-point drop slightly undercut the March 24th intraday low of 36.24, which was a successful test of the December 2018 high of 36.20 (arrow in Chart 7). A breakdown opens the door to a test of mid-to high-20s, so volatility bulls need to step up here.
Since peaking at 85.47 on March 18th, VIX has suffered five consecutive weekly drops. Momentum is down and can accelerate should 36 conclusively give way. Results from the top five this week thus will have a bearing on volatility, which will then decide which way cap-weighted indices go.
Thanks for reading!
