
Bulls last week defended support at 2600-2630 on the S&P 500, which has rallied massively since bottoming on December 26. Daily conditions are deeply overbought, pricing in a dovish Fed. A two-day FOMC meeting begins Tuesday. A ‘buy the rumor, sell the news’ is possible.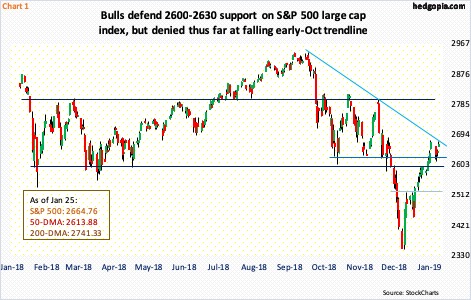
Equity bulls probably rejoice how trading evolved in a holiday-shortened last week.
The S&P 500 large cap index, for instance, was down big Tuesday, but there were bids waiting near the 50-day moving average, which also approximates major support zone at 2600-2630. Mid-December, bulls were unable to save this support, followed by acceleration in selling. The significance of this level is because for most of last year the index went back and forth between 2800 and 2600 (Chart 1). In the middle of this month, 2600 was recaptured, followed by 2630, so last week’s action can be construed as breakout retest. The question is, can bulls build on it?
From the Boxing Day low through the intraday high on January 18, the S&P 500 (2664.76) rallied 14 percent. This followed a 20.2-percent decline between October 3 and that low. Particularly on the daily chart, things are way extended. The index is also right at a falling trend line from early October. A breakout here has the potential to self-fulfill – at least near term. Immediately ahead, the daily upper Bollinger band lies at 2704.53.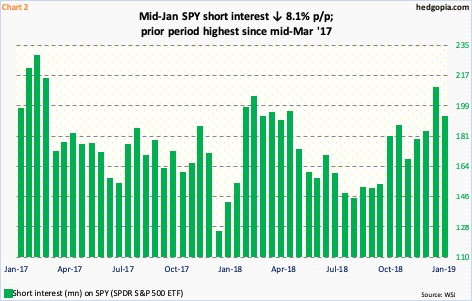
If longs prevail and the aforementioned trend line falls this week, shorts can provide a tailwind. It is possible a mini-squeeze already took place last week.
In the January 15 period, short interest on SPY (SPDR S&P 500 ETF) fell 8.1 percent period-over-period to 192.1 million shares. The prior period was the highest since mid-March 2017 (Chart 2). Shorts, who began to add as October rolled around, got aggressive in the second half last month as the S&P 500 lost 2600 and selling accelerated. But in the first half this month, the index rallied 4.1 percent. Short-covering likely helped. Since the 15th, the S&P 500 is up another 2.1 percent, raising the possibility that more shorts likely left. If the aforementioned trend line is retaken, even more are likely to do so.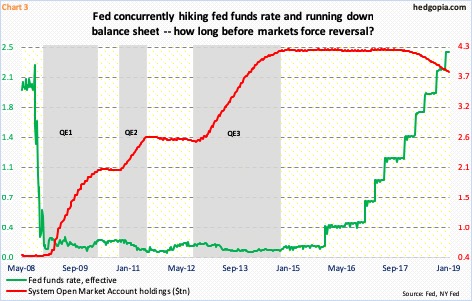
This week, bulls will try to ride on the coattails of at least a couple of things.
Tuesday, the FOMC meets and concludes the next. It is the year’s first meeting. The fed funds rate is expected to remain unchanged at a range of 225 and 250 basis points. Until just a few months ago, the Fed was on an aggressive tightening mode. It started raising rates in December 2015 when rates were between zero and 25 basis points. In 2018, fed funds went up by a full percentage point. Until not too long ago, the FOMC dot plot expected three more 25-basis-point hikes this year. Not anymore.
As stocks began to sell off early October and as selling deepened, several FOMC members, including Chair Jerome Powell, began to change their tune. In the dying weeks of last year, his speeches had decidedly taken on a dovish turn. So, come Wednesday, a lot will depend on whether or not he comes across as even more dovish than he has been in the past several weeks. More so if he opines that members are flexible about the ongoing balance-sheet reduction.
In the wake of the financial crisis of a decade ago, after three iterations of QE, the Fed’s SOMA (System Open Market Account) holdings went from under $500 billion in December 2008 to $4.24 trillion in April 2017. In October that year, it began to run down its balance sheet. As of last Wednesday, these assets were $3.83 trillion. Last year, the S&P 500 lost 6.2 percent – the first annual drop since 2008.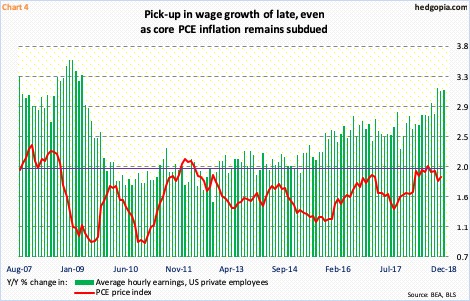
Because the Phillips Curve is all but dead in the current cycle, the Fed has room for flexibility, should it so choose.
January’s employment report comes out Friday. In eight of the nine months in the latter three quarters last year, the unemployment rate came in sub-four percent. For all of 2018, the economy created a monthly average of 220,000 non-farm jobs, for a total 2.6 million – the highest pace in three years.
Concurrently, wage growth has picked up speed, albeit moderately. In the last three months, the year-over-year increase in average hourly earnings of private-sector employees was north of three percent. Prior to this, the last time this metric grew with a three handle was in April 2009. Come Friday, should January show deceleration, this could end up helping stocks – or at least bulls will try to spin it that way.
This is because core inflation remains subdued. In the 12 months ended last July, core PCE inflation – the Fed’s favorite measure of consumer inflation – rose 2.04 percent. This was the first time since April 2012 it grew with a two handle. November was only up 1.88 percent (Chart 4).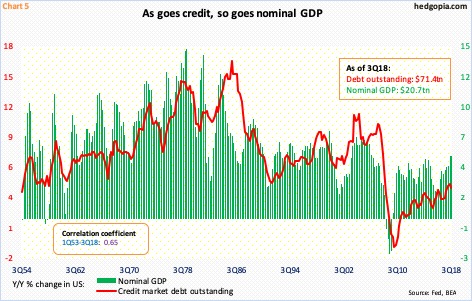
Increasingly going forward, the Fed likely focuses on inflation. It took a mere 20-percent decline in the S&P 500 for all this to occur. The balance sheet remains bloated (Chart 3). And even after nine 25-basis-point hikes since December 2015, the fed funds rate is essentially on par with inflation. This highlights the pickle the Fed is in – particularly at a time when the economy’s reliance on debt is persistently increasing.
Chart 5 plots the year-over-year change in nominal GDP and credit market debt outstanding. They correlate pretty well with each other. Longer term, this is a problem – for the economy, and by default, equities. Near term, stocks will dance to the beat of a sundry list of variables, of which the Fed is one. This week’s FOMC meeting, therefore, is important not only because what Powell says but also how markets react to it. As mentioned earlier, the S&P 500 has had a phenomenal rally in the past month. A ‘buy the rumor, sell the news’ is entirely possible.
In the event of a pullback, what transpires at 2600-2630 will continue to be a tell.
Thanks for reading!
