
With momentum on their side, equity bulls hope metrics such as money-market funds, margin debt and even foreign buying of US stocks begin to cooperate better. In this scenario, volatility, already suppressed, is vulnerable to another leg lower. Non-commercials are positioned for this with their record net shorts in VIX futures. Else, odds grow that grossly overbought conditions get unwound sooner than later.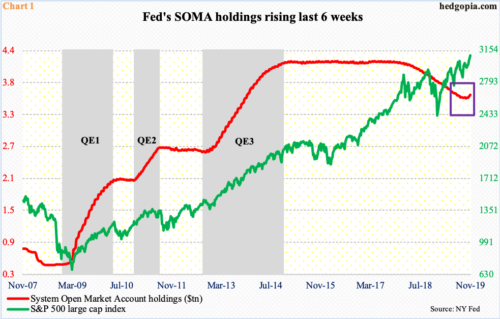
The Fed’s balance sheet is growing – again. System Open Market Account (SOMA) holdings last week stood at $3.62 trillion, up from $3.55 trillion six weeks ago (Chart 1). These holdings were as high as $4.24 trillion in April 2017, dropping as the central bank began to scale back the massive portfolio of bonds it accumulated post-financial crisis of 2007-2009.
The latest increase in SOMA holdings owes to the bank’s capital injections to solve money-market stresses that arose toward the end of September, causing a spike in short rates. The Fed currently owns $66 billion in Treasury bills, up from $3 billion two months ago.
This has coincided with three quarter-point reductions in the fed funds rate in July/September/October to a range of 150 to 175 basis points. Liquidity has gone up.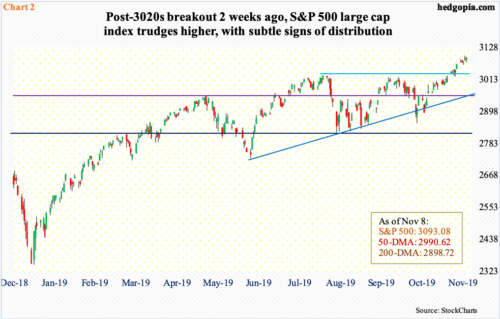
It is tough to argue this is the only reason US stocks rallied the past five weeks, but it probably did not hurt. From a low early October to last Thursday’s intraday high of 3097.77, the S&P 500 large cap index (3093.08) jumped 8.5 percent, breaking out of 3020s two weeks ago.
It is easy to get tempted to go long. Seasonally, November-December are strong months. With the sharp rally over the past five weeks, conditions are grossly overbought, but bulls continue to hold the momentum ball. Issues such as Brexit and US-China trade tensions, which previously caused massive uncertainty, have cooled off. Of late, there is some stability in global macro data.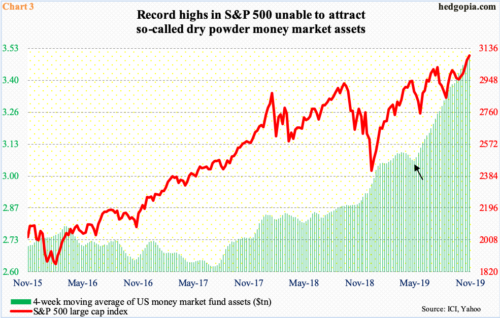
Ideally, bulls are hoping the so-called dry powder begins to light a new round of fire under equities. There is massive cash sitting on the sidelines.
As of last Wednesday, US money-market assets were $3.56 trillion, up $42.5 billion week-over-week. This was the highest total since February 2009. The ongoing buildup is reflected well in Chart 3, which uses a four-week average. The green bars have persistently risen for over two years now, even as the S&P 500 has trended higher. Since May in particular, these funds have had a parabolic rise (arrow).
The persistent rally in the S&P 500, and other major indices, has yet to induce outflows from money-market funds. From bulls’ perspective, the good thing is that they have managed to reach new – and newer – highs without this tailwind. Hence the question, ‘what if’?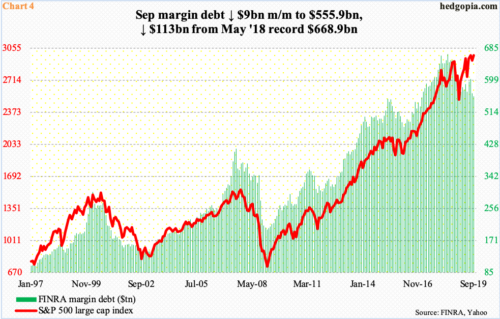
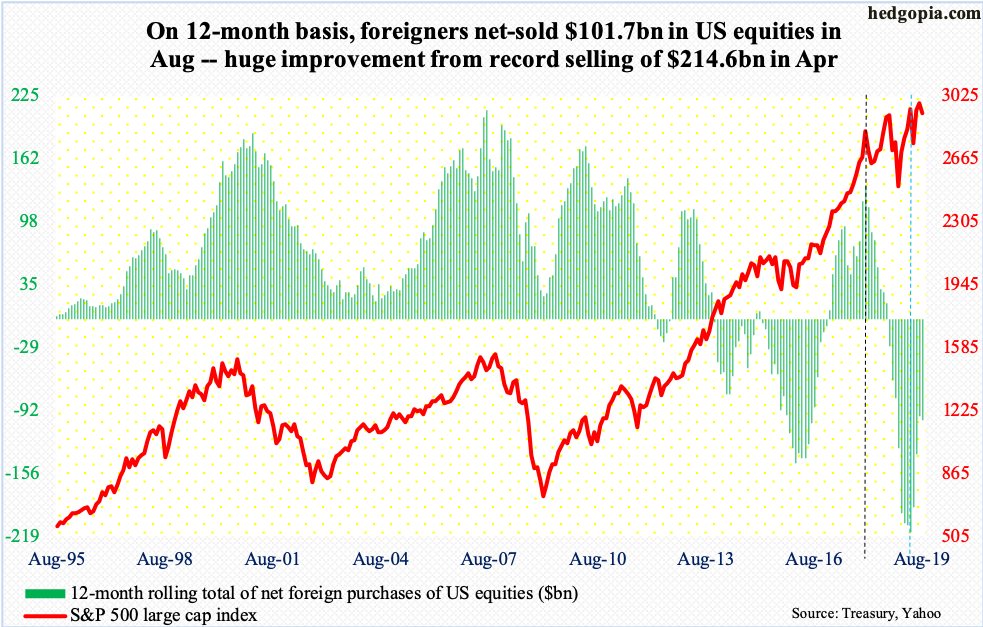
What if cash starts moving out of these funds, and into equities, among others? That for sure will help things get crazy – in fact, crazier – near term. All the better if foreigners start aggressively purchasing US stocks. The trend has been improving on this front. In the 12 months to August, foreigners sold $101.7 billion worth, but this is massive improvement from net selling of record $214.6 billion in April. Historically, foreigners’ buying – or a lack thereof – tends to move in tandem with the S&P 500 (chart here).
And even better if margin debt starts to behave favorably. In September, FINRA margin debt dropped $9 billion month-over-month to $555.9 billion. It peaked as far back as May last year at $668.9 billion. During all this, the S&P 500 had its share of ups and downs, but the overall trend has been up. From this perspective, margin debt has diverged (Chart 4).
In both 2000 and 2007 cycles, margin debt led the S&P 500. This could very well be occurring now, unless the metric reverses sharply higher. Should this occur, the bullish scenario could not have evolved any better.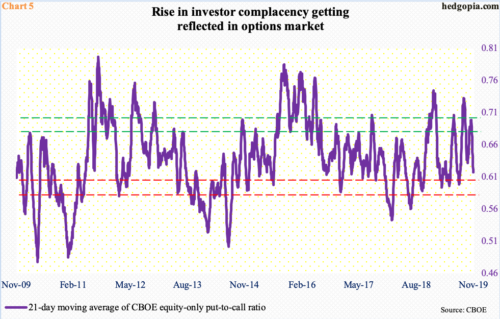
In this scenario, the 21-day moving average of the CBOE equity-only put-to-call ratio can still push lower. The ratio ended last week at 0.618, down from 0.699 on October 18. Investors were seeking protection back then, the unwinding of which led to the prevailing rally in stocks. Now, the pendulum has swung the other way.
Historically, the ratio tends to reverse higher from high 0.50s to low 0.60s. In March, April and July, it bottomed just under 0.60 – and still lower prior to that. Currently, greed has overtaken fear. In eight of the last 11 sessions, the daily ratio registered readings of 0.50s. This is as close as frothy can get. Equity bulls hope this gets frothier near term before unwinding sets in.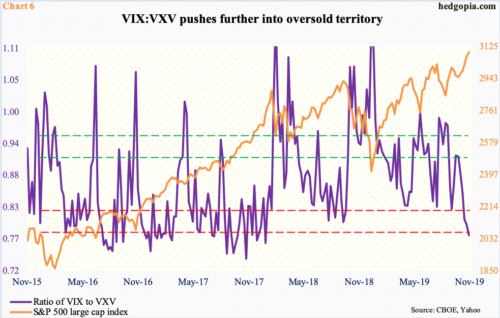
Similar dynamics are in play elsewhere in the options market.
From an intraday high of 21.46 on October 2 to a low of 12 last Friday, VIX (12.07) has come a long way to the downside. The 10-day moving average, which has provided resistance for nearly three weeks now, continues to fall, although the trajectory is not as steep. There is support at 10-11. VIX has not broken 10 since January last year. But if the lower end of this 10-11 support is tested, there is room for the ratio of VIX to VXV to further push into oversold territory.
VIX measures market’s expectation of 30-day volatility using S&P 500 options as inputs. VXV does the same except it goes out to three months. When stocks are rallying, which has been the case for several weeks, premium comes out of shorter maturity faster. This pushes VIX:VXV lower. Last week, the ratio closed at 0.78 – the lowest since early January last year. This is deep oversold territory. It is a matter of when, not if, it reverses higher.
Here is the thing. Several times in the past, the ratio enters oversold territory, but only to then go sideways, and stocks continue higher. This is what equity bulls are hoping for.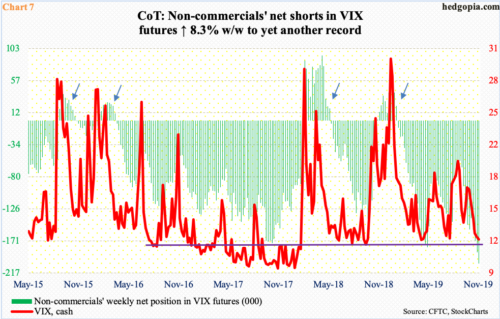
In the futures market, non-commercials are positioned for exactly this outcome – and aggressively so. As of last Tuesday, these traders were net short VIX futures up to the gills. In fact, last week’s 203,598 contracts set a new back-to-back record (Chart 7). Nothing says it cannot continue higher.
As far as equity bears are concerned, fun begins once these net shorts get unwound. Historically, VIX (cash) does not peak until these traders are either net long or have substantially reduced their net shorts (arrows in Chart 7). But just because their holdings are in uncharted territory, the unwinding process does not have to begin right away. At least equity bulls hope so.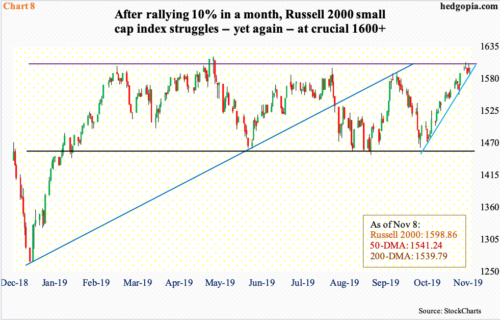
Bulls would also like small-caps to begin to lead their large-cap brethren. Conventionally, investors gravitate toward small-caps when they are in a mood to take on risk. From this yardstick, the Russell 2000 small cap index (1598.86) peaked in August last year at 1742.09. It recently broke through a falling trend line from that high, which is encouraging, except the fact that bulls now have to deal with a bigger roadblock.
Resistance just north of 1600 goes back to January last year. After stocks bottomed last December, the subsequent rally stopped right at that ceiling in February. There have been four more unsuccessful attempts (Chart 8), even as the S&P 500 went on to post new highs (Chart 2). The latest attempt was last week – 1608.80 on Tuesday and 1607.41 on Thursday.
The problem bulls have is that the Russell 2000 is hitting this resistance in the wake of a 10 percent rally in a month. Conditions are overbought – daily for a while and weekly quickly getting there. Hence the need to watch the Russell 2000. It is possible a decisive breakout enables Charts 5 and 6 to continue in overbought territory and cause a rise in margin debt (Chart 4) as well as begin to attract money on the sidelines (Chart 3). This is the best-case scenario for equity bulls. A lack thereof raises the odds of unwinding. Chart 7 awaits that eventuality.
Thanks for reading!
