
If the Fed moves in September and December, the fed funds rate will be in excess of core inflation. In a leveraged economy, that should begin to bite. The FOMC dot plot expects three more hikes next year. This is increasingly hard to swallow.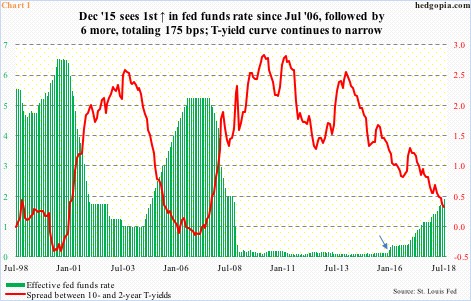
Later today, the FOMC concludes its two-day meeting – the year’s fifth. Three more meetings are scheduled after this – September (25-26), November (7-8) and December (18-19). No hike is expected in this week’s meeting, and they are not going to surprise the markets. There is no need to.
This year, rates went up 25 basis points each in March and June to a range of 175 to 200 basis points. Markets expect another hike in September, with odds of 92 percent – pretty much a slam dunk. December odds are 65 percent, but have been rising in recent weeks. If the Fed moves in both these meetings, by year-end the fed funds rate would have stood at between 2.25 percent and 2.5 percent.
Rates have come a long way from December 2015, when the Fed began raising after keeping them suppressed at the zero bound for seven long years (arrow in Chart 1). Despite this, rates are still accommodative. This is probably why a 175-basis-point increase thus far in the cycle has not put a dent in economic activity.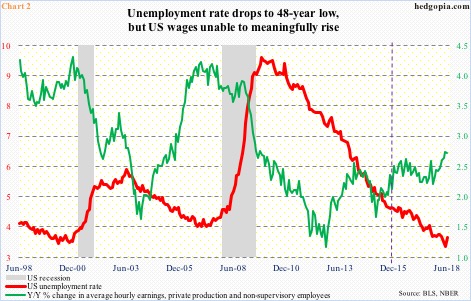
The US unemployment rate in June rose two-tenths of a percentage point month-over-month. May’s 3.8 percent was the lowest since 3.5 percent in December 1969. That is right – nearly a 49-year low. Post-Great Recession, unemployment peaked at 10 percent in October 2009. Things have come a long way since. And in December 2015 when the Fed began its current tightening cycle the unemployment rate was five percent (dashed vertical line in Chart 2). The rise in rates has had no impact.
The same is true with consumer credit.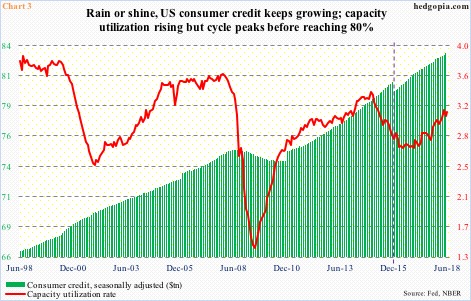
Consumer credit has been like an energizer bunny. Over time, the green bars in Chart 3 have more or less persistently moved from the lower left to the upper right. This paused during and immediately after the 2008 financial crisis. Otherwise, the trajectory has been up.
In May, seasonally adjusted consumer credit rose $24.6 billion m/m to $3.9 trillion. When Great Recession ended in June 2009, it was $2.6 trillion, and $3.4 trillion in December 2015 (latter represented by dashed vertical line).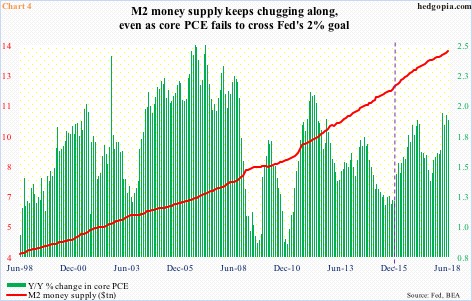
M2 money supply is the same way. Chart 4 pits it against year-over-year change in core PCE (personal consumption expenditures). In June, M2 grew $85.4 billion m/m to $14.1 trillion. Once again, in June 2009 it was $8.4 trillion and $12.3 trillion in December (dashed vertical line).
In recent months, the rate of growth in M2 has decelerated, with June rising 4.2 percent y/y, versus 7.5 percent in October 2016, but on an absolute basis it has been nothing but up.
Here is the thing. In each of these charts, while one variable points to how the suppressed rates did wonders to the economy – to a point of even building excesses in some corners – the other highlights factors that gave the Fed leeway to do so.
Take Chart 2. Despite the nearly-five-decade-low unemployment rate, wage growth is subdued. In January, average hourly earnings of private-sector production and non-supervisory employees increased 2.7 percent y/y. The last time this metric grew with a three handle was in May 2009.
Or take Chart 3. Capacity utilization in June rose 0.4 percent m/m to 78 percent, up from 75 percent in November 2016. That said, utilization is still below the cycle high 79.6 percent in November 2014, and even that one, unlike in past cycles, retreated before hitting 80 percent.
Or take Chart 4. On an annual basis, core PCE – the Fed’s favorite measure of consumer inflation – rose 1.9 percent in June. The last time it cracked two percent – which is what the Fed aims to achieve – was in April 2012. At 1.96 percent, this past March came close, but no cigar.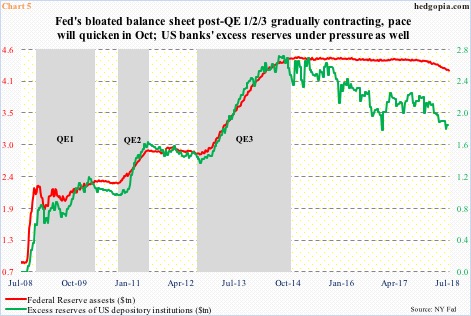
Hence the significance of an imminent hike in September, and maybe also in December. Assuming the Fed also moves in December, the fed funds rate would start 2019 in excess of core inflation. In a leveraged economy, this can begin to bite. Forget the fact the FOMC dot plot shows members would like to move three more times next year. Not to mention the fact that the Fed has already been reducing its bloated balance sheet. After three iterations of quantitative easing (QE), it held $4.52 trillion in assets in January 2015. Last week, this had dropped to $4.28 trillion (Chart 5). By October this year, the pace of reduction will reach up to $50 billion/month.
The balance-sheet reduction is accompanied by a reduction in banks’ excess reserves, which has dropped from a peak of $2.72 trillion in September 2014 to $1.84 trillion now. These reserves sit there earning 1.95 percent in interest, so banks are not in a hurry to push it out into the system. With rates not as accommodative as in the past, even if they wanted to, demand becomes an issue. The Treasury yield curve is warning as much, with the spread between 10- and two-year yields merely 29 basis points on the last day of July (Chart 1).
Bottom line: the post-meeting message later today likely continues to lean hawkish, but as the year-end nears, odds are this softens.
Thanks for reading!
