In the right circumstances, U.S. stocks have room to rally – at least in the near-term. After the recent pullback, U.S.-based stock funds attracted $14.1 billion in the week ended July 8 – biggest inflows since mid-December (courtesy of Lipper). Funds specializing in U.S. shares drew $12.6 billion. SPY, the SPDR S&P 500 ETF, attracted $6.7 billion – its biggest week this year. Bulls sure hope this continues. In addition, major U.S. stock indices remain oversold near-term, heading into Monday’s session. Last but not the least, the second-quarter earnings season begins in earnest this week – where the bar is low.
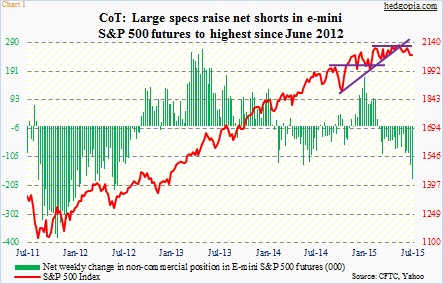
Should Greece cooperate, odds are in bulls’ favor. This is not the outcome non-commercial futures traders are hoping for. They are positioned to benefit from an opposite scenario. Last week, they raised net shorts in S&P 500 e-mini futures to 180,464 contracts – the highest since June 2012 (Chart 1). Nonetheless, this is also something equity bulls can use to their advantage. A rally here can potentially force these traders to unwind their holdings.
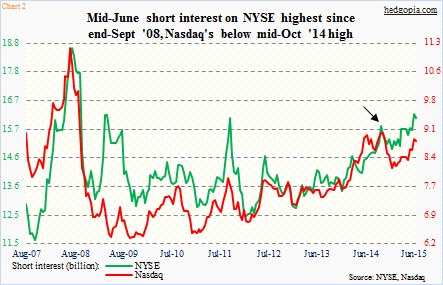
A similar potential tailwind awaits in the form of short interest. At the end of June, NYSE short interest fell 0.9 percent from the prior period, but mid-June was the highest since end-September 2008 (Chart 2). The mood is not uniformly bearish across indices or sectors or industries. On the Nasdaq, short interest remains below the mid-October 2014 level.
In U.S. stocks, the last major pullback took place during September-October last year. The S&P 500 Index came a hair’s breadth away from losing 10 percent, before bottoming in the middle of October and rallying strongly, as did other indices. That low therefore is a good reference point for comparison purposes.
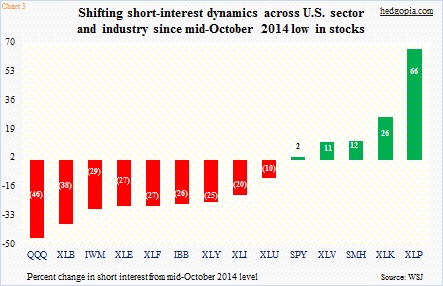
Chart 3 compares current short interest on various sectors/industries with what it was when stocks bottomed mid-October last year. Back then, the subsequent rally squeezed the heck out of shorts. Short interest declined on both the NYSE and Nasdaq (arrow in Chart 2), acting as a tailwind for the rally that followed.
Do we have the same ingredients in place currently? While this looks to be the case at first glance – particularly considering the elevated level of short interest on the NYSE – a deeper look reveals a slightly different picture. Of the 13 sectors/industries in Chart 3, nine have short interest smaller now versus in the middle of October last year – including QQQ, the PowerShares QQQ ETF, and IWM, the iShares Russell 2000 ETF.
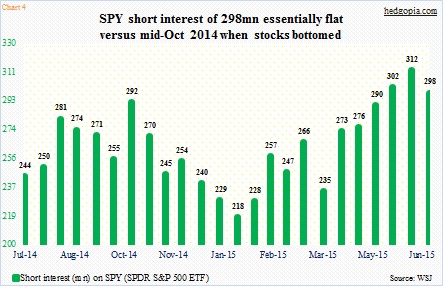
This tells us one thing. On these ETFs, the potential for a squeeze the like of which we saw last October is substantially less versus back then. Even on SPY, short interest is essentially unchanged now versus then – 298 million versus 292 million; it has not gone up despite a 15-percent rally since then. With that said, at least on SPY, it then dropped to 218 million in the next three months. Bulls sure hope a repeat of that. But can they deliver?
Thanks for reading!
Please keep in mind that this article was originally published yesterday (July 13th) by See It Market, where I am a contributor.

