
- Setback in orders for business-capex proxy; down four consecutive months
- Inventory-to-order ratios, nowhere near previous peaks, trending higher
- Zero-bound suppressed rates probably impacting incentive to borrow
The much-anticipated capex boom in the U.S. will just have to wait a while longer. Since the July spike, orders for durable goods have dropped 23 percent, to $230.5bn – a 10-month low. Month-over-month, orders fell 3.4 percent in December. Ex-transportation, the drop looks a lot better, down 0.8 percent. Both transportation and defense tend to be lumpy. Non-defense capital goods ex-aircraft, widely considered a proxy for business capital expenditures, is no different either (Chart 1). December was down 0.6 percent – the fourth consecutive m-o-m drop. In 10 out of the last 12 months, the category has shrunk. It peaked in June at $72.9bn, and December was nearly four percentage points lower.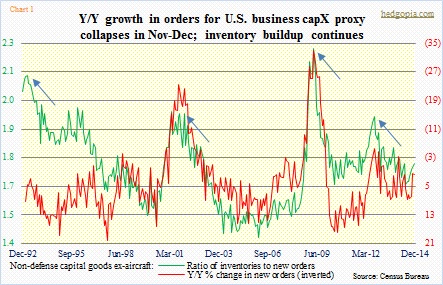
The point is, the trend is not going in the right direction. We are in the midst of 4Q earnings season, and multinationals are missing left and right. A lot of them, including CAT, DD, PG, MSFT and PFE, were blaming the dollar. True, for a U.S. multinational, a strong dollar does not help. In the second half last year, the U.S. dollar index (94.26) surged a little under 14 percent, and is up another four percent year-to-date. But it is not just the dollar. That is just scapegoating! The dollar was also strong in the second half of the 90s, but the economy did just fine. That is an understatement. Tech was booming, and so was overseas. Not so now. Everywhere one looks outside the U.S., things are decelerating. Disinflation is sticking, with the specter of deflation rising.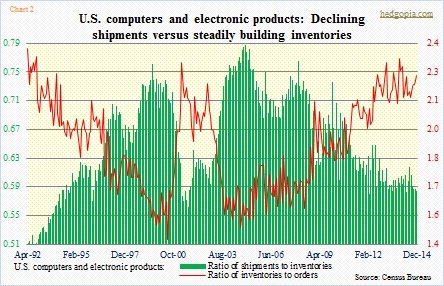
When expectations are high and demand fails to materialize, inventory is a logical canary in the coal mine. A rise means growth will be muted in the future. And that is what is going on. The green line in Chart 1 – ratio of inventories to orders – has been inching up since June after hitting a six-plus-year low. The good thing is, it is nowhere near past peaks (blue arrows in Chart 1). However, this ratio also has a tendency to trend. Once it gets going, momentum can last a while. In the computers and electronic products category, the story is the same (Chart 2). Inventories are highest since April 2002. In the tech land, AAPL yesterday comfortably hit it out of the park. But it is a different animal. What other company can grow 30 percent y-o-y from $57bn? Other heavyweights including INTC, MSFT, and most notably, IBM have been a disappointment.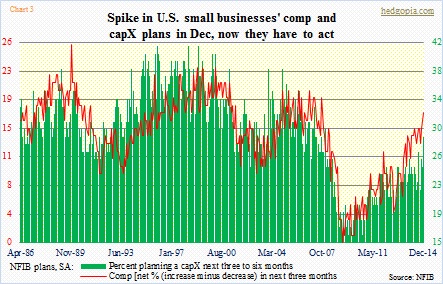
If we go by small businesses’ capex plans, it is only a matter of time before things improved. First of all, we have been hearing this meme for a while. Secondly, let us give the green bars in Chart 3 the benefit of the doubt. They represent the percent of National Federation of Independent Business members with a capex plan in the next three to six months. The December reading was at a seven year high (29 now versus 30 in December 2007). Incidentally, the previous cycle peaked in December, before Great Recession began. (These businesses also say they plan to increase compensation in the next three months.) Thirdly, by nature they are domestically oriented. This is good in the sense that they are not impacted, let us say, by currency dynamics as much as multinationals. But if the latter suffers from overseas malaise, the impact will be felt throughout the economy. Small businesses will not be spared.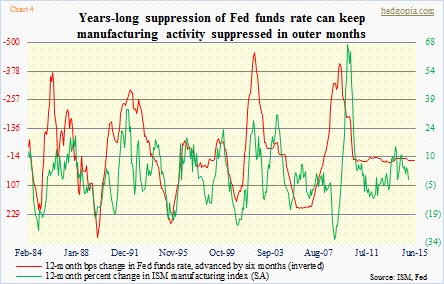
Here is the problem. If the relationship between the two variables in Chart 4 holds, U.S. manufacturing at best goes sideways. By keeping short rates as low as they are for as long as they have been, the Fed, with all its good intentions, has probably managed to adversely impact lending/borrowing dynamics. In normal times, a drop in interest rates gives borrowers an incentive to lock in. If rates have stayed at zero bound for six years, there is no incentive. This raises the odds of stagnant activity, and that is what Chart 4 shows. The two lines track each other, with the green line moving inversely to the change in Fed funds. Short rates cannot go any lower. Hence the conundrum.
Capex bulls need to pull in their optimistic horns.
