
There is something interesting going on in the land of put-to-call ratios. Of late, the CBOE put-to-call ratio has diverged from the ISEE index, all equity. In Chart 1, the latter is inverted, as it is a call-to-put ratio.
First a brief primer.
Unlike the CBOE put-to-call ratio, the ISEE index excludes trades from market makers and broker/dealers. As well, it only uses opening long trades. So from the perspective of sentiment reading, the latter is a clean number.
Market makers, for instance, need to hedge exposure all the time. Retail traders on the other hand bet on direction.
Further, an increase in put volume, for instance, may suggest retail traders are expecting a move lower, but they might very well be selling what they bought earlier. Or, they might be deploying short puts, or bull put spreads. Often, information can be gleaned from whether a trade is done at the bid or the ask, or from the way open interest has changed, but once again one large order can distort the picture.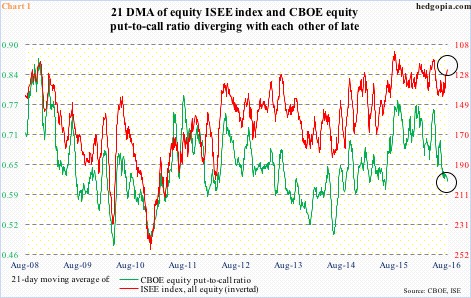
With that as a background, take a look at Chart 1, which uses a 21-day moving average of the CBOE equity put-to-call ratio and the ISEE index, all equity. The former has been under pressure. Most recently, it stood at .764 on May 19th and .699 on July 6th. (Post-Brexit, stocks bottomed on June 27th.) Yesterday, the green line dropped to .613. This is unfolding as expected, as stocks have been grinding higher. Since that post-Brexit low through Tuesday’s high, the S&P 500 large cap index rallied 10 percent.
The red line, however, is going the other way. Once again, this is a call-to-put ratio and is inverted in the chart. As is evident, for the most part the two lines tend to move together. This time around, the red line has diverged. On July 26th, it was 143.1, and 124.1 yesterday.
While the CBOE put-to-call ratio tells us that at present call buyers are outweighing put buyers, the ISEE index is sending the opposite message. On the CBOE put-to-call ratio, yesterday’s reading of .613 was the lowest since June 26th last year, even as the ISEE index dropped to the lowest since May 31st this year.
At the risk of oversimplification, excessive put buying can signal a bottom in stocks, while excessive call buying can signal a top.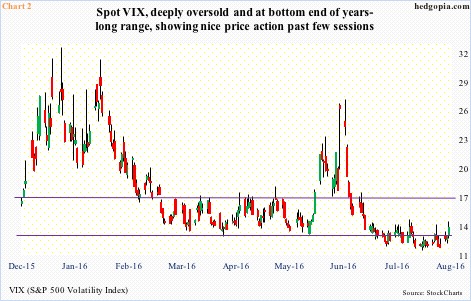
Intuitively, with major U.S. indices having broken out to new highs but having gone sideways in the past month, traders may be trying to hedge with long puts, which in due course can be bullish for stocks as these positions get unwound. But except for the last few sessions, this is not what is reflected in spot VIX. It rallied in the past three sessions, but prior to that languished in 11-12 and was at the bottom end of years-long range (Chart 2).
Now it is entirely possible that at least some of the CBOE longs are on the short side. Covered calls come to mind. Which, if true, kind of supports the message coming out of the ISEE index. But for now, the green line in Chart 1 has significantly unwound the oversold condition it was in, and has reached a level from where it has rallied in the past. Should this scenario unfold, stocks should come under pressure.
Thanks for reading!
