
Kudos to equity bulls for having cashed in on last Tuesday’s CPI report, which was just a tad better than expected. With three up weeks in a row, the S&P 500 – as overbought as it is on the daily – began this week with another solid performance on Monday. Concurrently, the major equity indices are approaching, or at, crucial resistance, even as VIX is nearing five-month support.
In a seasonally favorable period for equities, bulls successfully spun October’s CPI report to their advantage last week. Consumer inflation – both headline and core – was respectively unchanged and up two-tenths of a percentage point month over month. From a year ago, they were 3.2 percent and four percent higher, in that order. On both headline and core basis, numbers were one-tenth of a percentage point lower than the consensus.
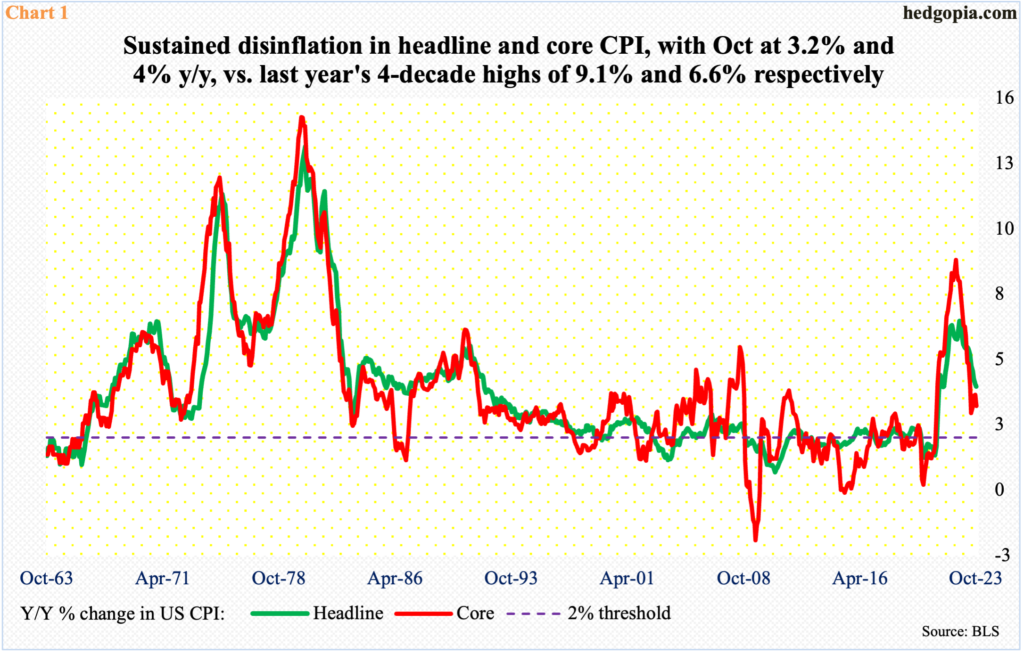
The beat was nothing earth-shattering. It merely confirmed an underlying trend that has been in place for a while. Last year, in June and September respectively, headline and core inflation peaked at an annual rate of 9.1 percent and 6.6 percent (Chart 1). Since then, it has been under sustained pressure, although the core remains elevated versus where the Federal Reserve wants it. It has a two percent goal on core inflation, with its favorite core PCE (personal consumption expenditures) having risen 3.7 percent in the 12 months to September, down from the 5.6 percent peak reached in February last year; October numbers are due out on the 30th.
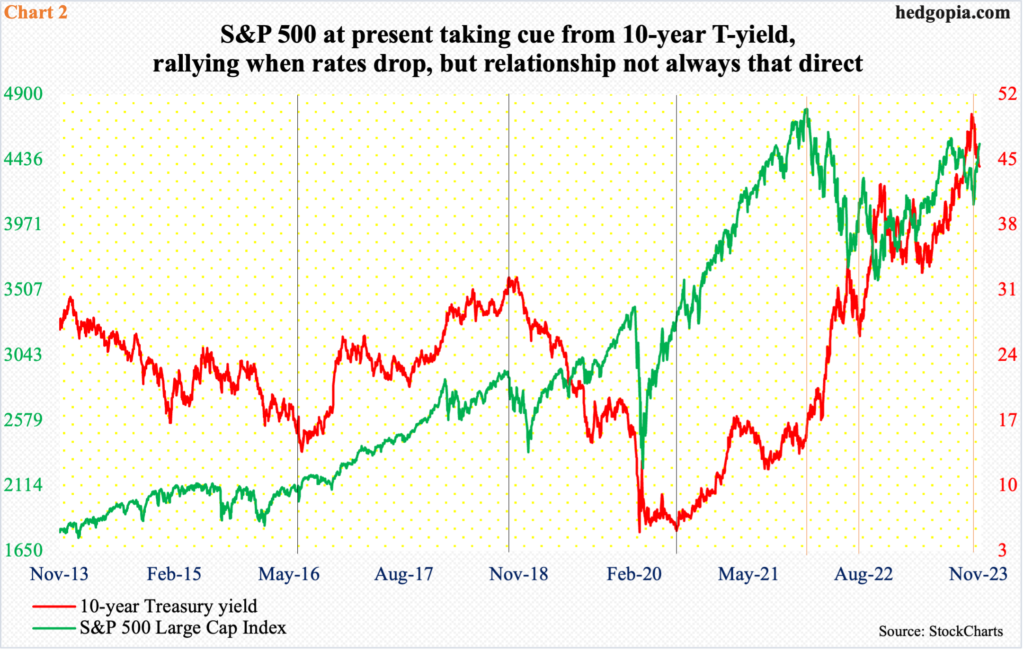
Last Tuesday, when the CPI was reported, the 10-year treasury yield dropped 19 basis points to 4.44 percent. This acted as a tailwind for equities, with the S&P 500 rallying 1.9 percent. For a while now, stocks have taken a cue from the long end of the yield curve, but the relationship between the two is not always this simple. In Chart 2, the orange vertical lines denote times when the 10-year yield and the S&P 500 went in opposite directions, while the black lines represent the times when they moved hand in hand.
Yields have been under pressure since peaking at five percent last month. For three consecutive sessions in October, the 10-year tried to unsuccessfully take out that level, with the high of 4.997 percent recorded on the 23rd. This was the highest print since July 2007. Rates peaked at 5.32 percent in June back then, before coming under sustained pressure to eventually bottom at 0.40 percent in March 2020. In 2007, the 10-year peaked just before the onset of the global financial crisis.
Stocks will do well in a low interest rate environment in a goldilocks environment. The fed funds rate currently stands at a range of 525 basis points to 550 basis points, up from zero to 25 basis points in March last year. The Fed is also reducing its bloated balance sheet. The last hike in the fed funds rate took place this July. It is probable the economy is yet to absorb all of the 16-month tightening, which only means growth deceleration in the months/quarters to come. In this environment, stocks are likely to then respond to a probable hit to earnings than merely to lower rates.
Stocks have rallied feverishly this month. After three straight months of decline, the S&P 500 is up 8.4 percent month-to-date. The large cap index bottomed at 4104 on October 27th. In the 16 sessions since, it only has two down sessions and three gap-ups, the latest of which came last Tuesday post-CPI.
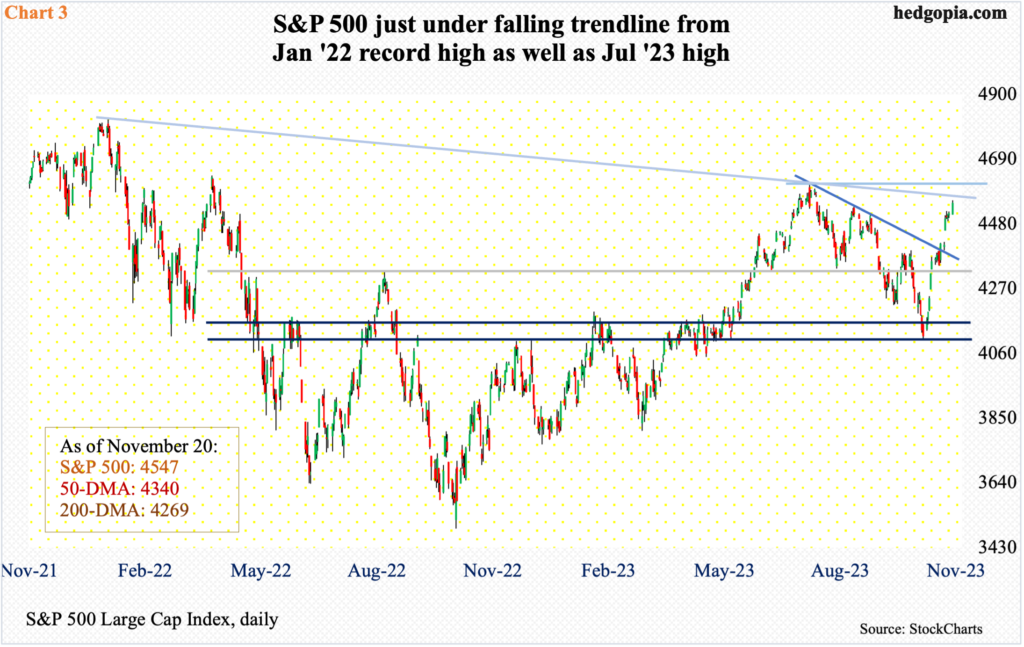
Yesterday, there was a mini-breakout, bolting out of 4520s to 4547. Just above lies trendline resistance from January last year when the S&P 500 peaked at 4819. Then, there is the high from July when it hit 4607 before it lost 500 points in the next three months (Chart 3).
Bulls have the momentum, particularly considering that they have seasonality in their favor, but this also raises the risks of getting caught in crowded trades. The daily RSI on the S&P 500 ended Monday at 71.56. The last time this metric hit the 70s was July.
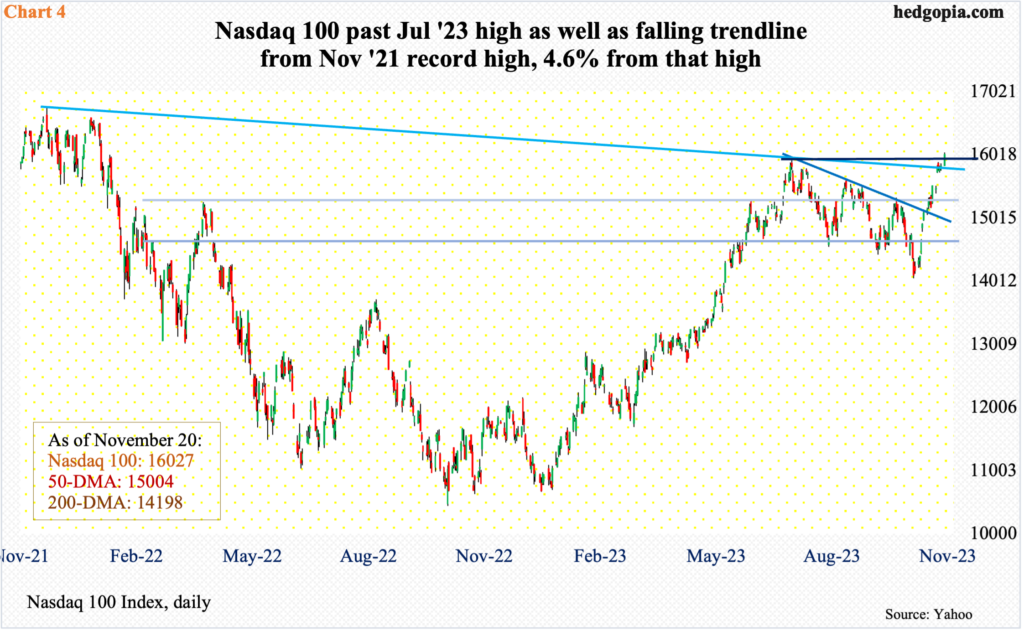
This also holds true for the Nasdaq 100, where the daily RSI finished Monday at 72.14. Momentum has not been this strong since July, which is when the tech-heavy index tagged 15932 and then came under sustained pressure. That high was taken out yesterday, when the index rallied 1.2 percent. It is also above a falling trendline from November 2021 when the Nasdaq 100 peaked at 16765, which is now merely 4.6 percent away (Chart 4).
Nvidia (NVDA) reports its October quarter later today. Positive numbers – real or perceived – can help Nasdaq 100 bulls decisively go after the November 2021 high.
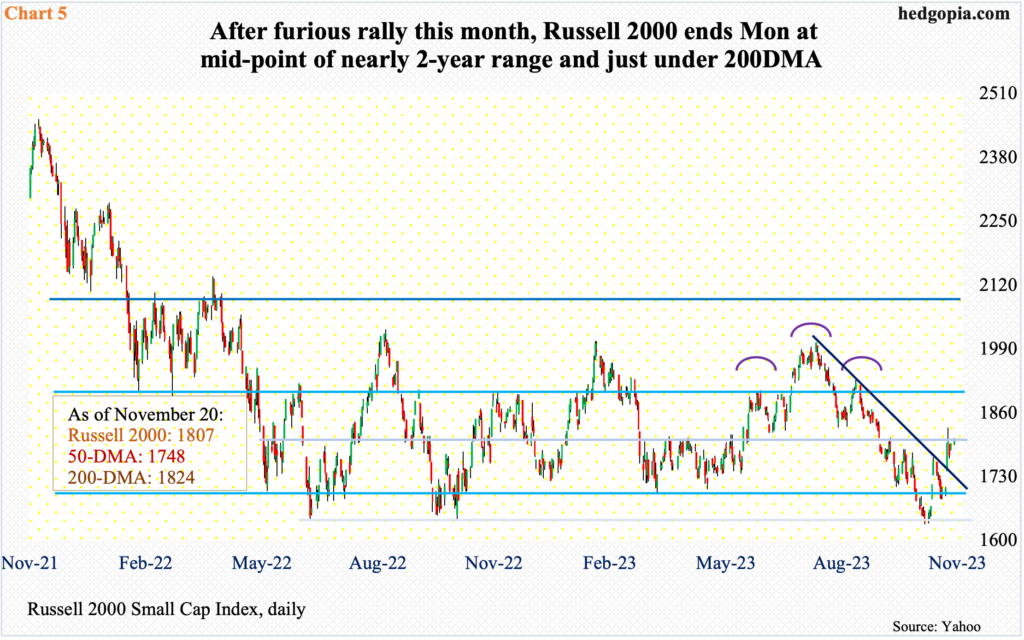
The Russell 2000, too, peaked in November 2021, but its performance post-October 2022 bottom is sub-par compared to what the Nasdaq 100 has achieved, with the latter having recouped nearly all the losses.
The small cap index peaked at 2459 and bottomed in June and October last year at 1640s, which was defended late last month and early this month. But the small cap index continues to struggle breaking out of a range it has been in since January last year (Chart 5).
On Monday, it rallied 0.5 percent to 1807, with 1800 representing not only the mid-point of the range but also the neckline of a head-and-shoulders pattern.
Small-cap performance does not speak very highly of economic prospects next year.
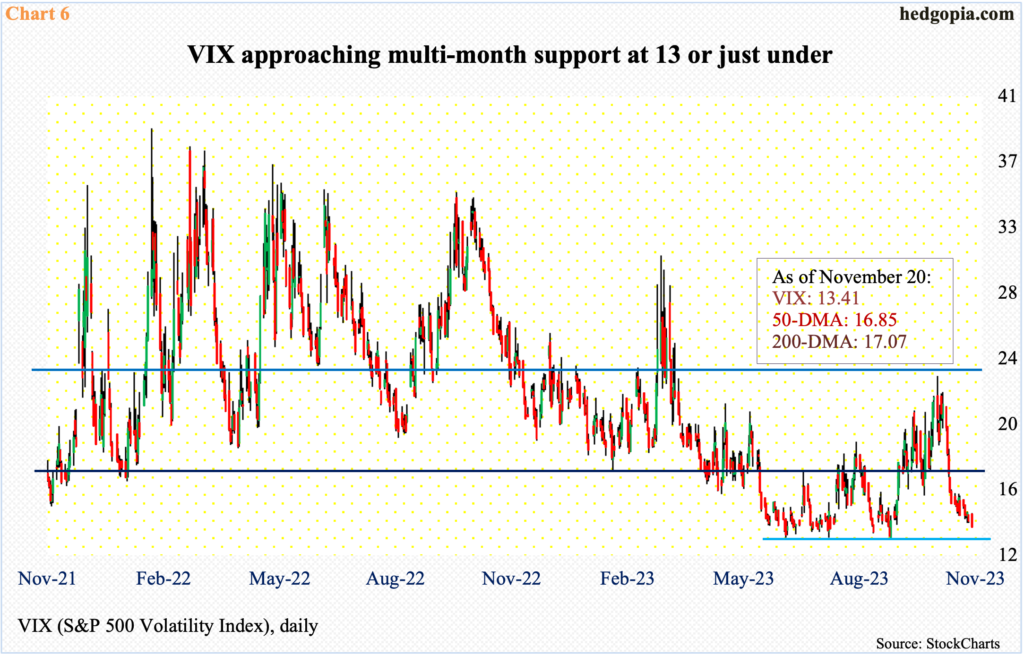
Amidst all this, the VIX volatility index is approaching a level that has held like a rock the past five months.
Four weeks ago, VIX formed a massive bearish marubozu on the weekly, preceded by a weekly spinning top, peaking at 23.08. Before that, VIX bottomed just under 13 in September. This is a level volatility bears have struggled since June to penetrate.
Once again, VIX is closing in on this support, closing Monday at 13.41. At a time when complacency is running very high, this is likely to attract contrarian traders.
Thanks for reading!
