
Following futures positions of non-commercials are as of December 10, 2019.
10-year note: Currently net short 178.9k, down 43k.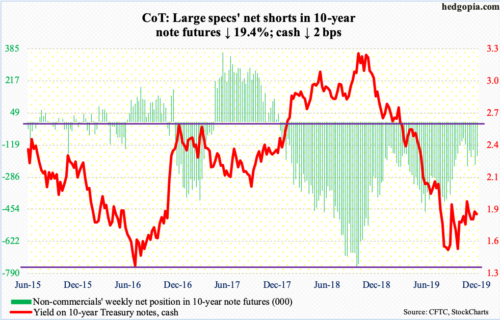
As expected, the Fed stood pat. This week’s FOMC meeting – the year’s eighth and last – left the fed funds rate unchanged at 150 to 175 basis points. This year, the benchmark rate was reduced three times in 25-basis-point increments. The last easing was late October.
Next year, it is not until November the odds in the futures market of a quarter-point cut rises above 50 percent. By December, this rises to north of 60 percent. This runs in contrast with what the FOMC dot plot showed this week, with the median member expecting rates to remain between 150 and 175 basis points by the end of next year.
Be that as it may, historically, the Fed tends to cave in to market demands. As far as macro is concerned, anything could happen between now and the next 12 months, meaning these odds are obviously not set in stone. For markets to be on the right side of this – that is, for rates to head lower – the US economy should at least continue to send mixed signals. In this scenario, the 10-year Treasury yield (1.82 percent) will be unable to rally much.
The 10-year rate dropped all the way to 1.43 percent early September. The rally since that low ended November 7 at just under two percent. Nevertheless, there has been a pattern of higher lows the past three months, but no higher highs yet. For that to happen, the 10-year has to eclipse 1.97 percent.
30-year bond: Currently net short 107.1k, up 16.6k.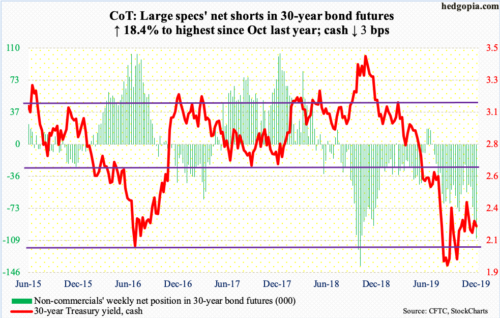
Major economic releases next week are as follows.
The NAHB housing market index (December) and Treasury International Capital (TIC) data (October) are due out Monday.
Home builder optimism fell a point month-over-month in November to 70. The index has dropped from the cycle high 74 reached in December 2017 but hovers near that high.
In September, the 12-month total of foreigners’ net purchases of US stocks was minus $76 billion. This is an improvement considering they were selling as much as $214.6 billion worth as recently as April.
Tuesday brings housing starts (November), industrial production (November) and JOLTS job openings (October).
October housing starts jumped 8.5 percent year-over-year to a seasonally adjusted annual rate of 1.31 million units. The cycle high 1.38 million units was reached in August.
Capacity utilization shrank 3.2 percent y/y in October to 76.7 percent. The current cycle peaked at 79.6 percent in November last year.
Non-farm job openings dropped 277,000 m/m in September to 7.02 million. The metric hit record high 7.63 million in November last year.
Existing home sales (November) are scheduled for Thursday. October sales rose 1.9 percent m/m to 5.46 million units (SAAR). The cycle high 5.72 million units was reached in November 2017.
GDP (3Q19, final), personal income (November) and the University of Michigan’s consumer sentiment index (December, final) will be published Friday.
The second estimate showed real GDP grew 2.1 percent in 3Q19.
In the 12 months to October, core PCE (personal consumption expenditures), which is the Fed’s favorite measure of consumer inflation, rose 1.59 percent – a five-month low. The Fed has a two percent objective.
Preliminarily, consumer sentiment in December rose 2.4 points m/m to 99.2 – a seven-month high.
WTI crude oil: Currently net long 688.3k, up 76.8k.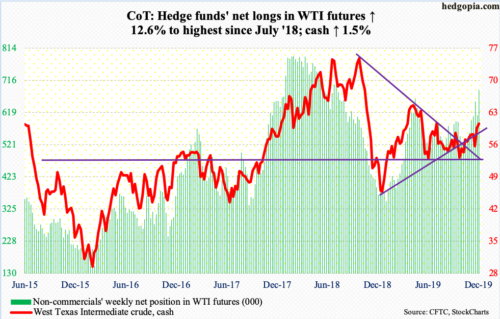
Last week, on the back of an OPEC+ deal to raise production cuts to 1.7 million barrels per day in the first quarter next year, oil bulls rallied the cash ($60.07/barrel) 7.3 percent. The enthusiasm subsided this week, with the crude up 1.5 percent. OPEC stopped short of pledging action beyond March. Seasonally in the first quarter, demand is less for refined products and for crude oil. These producers are also facing increased output from US shale.
In the week to December 6, US crude production fell 100,000 b/d from record 12.9 mb/d. In January 2017 when OPEC+ first agreed to a cut of 1.2 mb/d, the US was pumping 8.9 mb/d. The EIA report also showed a buildup in stocks of crude, gasoline and distillate – up 822,000 barrels, 5.4 million barrels and 4.1 million barrels to 447.9 million barrels, 234.8 million barrels and 123.6 million barrels, in that order. Crude imports rose as well, up 898,000 b/d to 6.9 mb/d. Refinery utilization dropped 1.3 percentage points to 90.6 percent.
Bulls this week defended $58.70s. Friday’s intraday high of $60.48 kissed the falling trend line from October last year when WTI peaked at $76.90. Should bulls pull this off, it will be an important breakout.
E-mini S&P 500: Currently net short 18.7k, down 20.3k.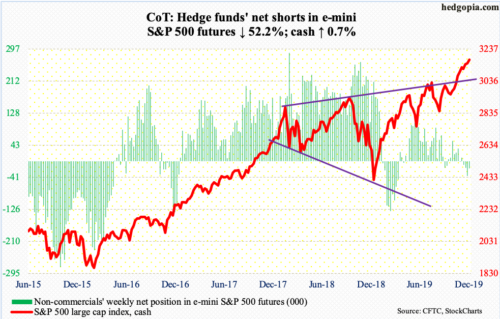
As opposed to combined inflows of $10.5 billion into SPY (SPDR S&P 500 ETF), VOO (Vanguard S&P 500 ETF) and IVV (iShares Core S&P 500 ETF) in the prior two weeks, these ETFs only attracted $469 million in the week to Wednesday (courtesy of ETF.com). In the same week, US-based equity funds bled $7.1 billion, versus inflows of $5.2 billion in the prior two (courtesy of Lipper).
If there is any consolation to bulls, the outflows took place before Thursday’s 0.9-percent rally in the cash (3168.80), which rose to a new all-time high of 3182.68 Friday. That said, bulls were unable to hang on to Friday’s early gains, with the session ending with a daily spinning top. The S&P 500 is now up in nine of last 10 weeks, so fatigue is natural. The weekly is in overbought territory, but no serious breakdown in momentum just yet.
Euro: Currently net short 67.6k, down 1.4k.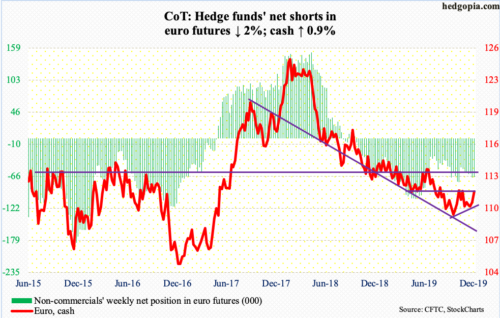
At ECB President Christine Lagarde’s first policy meeting, the deposit rate was left at the historic low of -0.5 percent. Markets expected this. The bank now expects the euro-area economy to grow 1.2 percent this year, up from September’s forecast of 1.1 percent, while 2020 was lowered from 1.2 percent to 1.1 percent. Asset purchases of €20 billion/month that started in November will continue “as long as necessary.”
In response, the cash ($111.59) see-sawed Thursday, trading within a range of $111.79 and $111.03, in the end closing near the session high, which just stopped short of the November 1st high of $111.82. This area has been a place of interest for both bulls and bears since March this year. A higher high will have strengthened bulls’ hand. After bottoming at $108.85 on October 1, the euro has made higher lows, with the 50-day ($110.69) now curling up; it is likely the average gets tested near term.
Gold: Currently net long 270.9k, down 19.9k.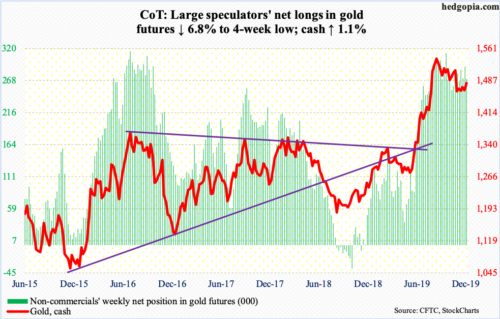
Early September, the cash ($1,481.20/ounce) peaked at $1,566.20. A falling trend line from that high resisted rally attempts several times this month, including both Wednesday and Thursday this week. The 50-day ($1,483.14) approximates this resistance. Down below, a rising trend line from mid-November was tested early this week as well as Friday at $1,460s. In essence, gold is trapped between these trend lines, with major support at $1,440s-50s.
A rally past $1,480s – likely – opens the door to a test of $1,520s, and hopefully for gold bugs, the September high. For that to happen, flows need to improve. In the week to Wednesday, IAU (iShares Gold Trust) took in $106 million, while GLD (SPDR Gold ETF) lost $97 million (courtesy of ETF.com).
Nasdaq 100 index (mini): Currently net long 12.2k, down 9.9k.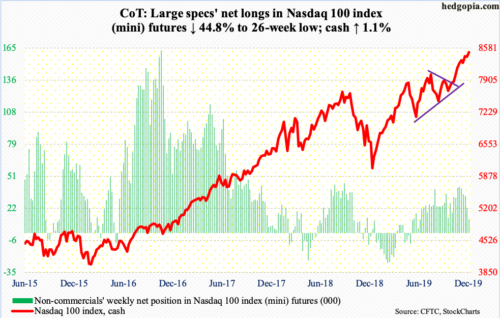
Yet another week, yet another high in the cash (8487.71)! Thursday, the Nasdaq 100 staged a mini breakout, with Friday rallying to a new all-time high of 8517.52. Leading up to this, in the week to Wednesday, QQQ (Invesco QQQ Trust) took in $1.1 billion (courtesy of ETF.com).
Thursday’s rally took place even as both the 10- and 20-day looked like they were itching to at least flatten out. The odds of this occurring near term are still decent, unless bulls continue to build on overbought momentum.
Russell 2000 mini-index: Currently net long 37.4k, up 6.5k.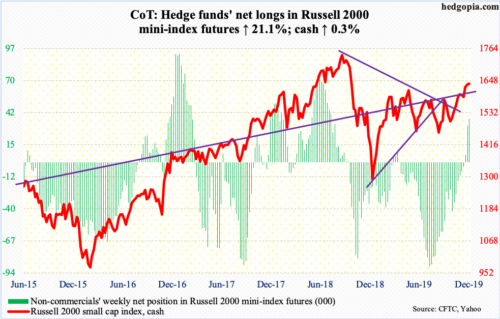
The cash (1637.98) Thursday broke out of short-term resistance at 1630s, although bears forced a retest in the next very session. This preceded a major breakout three weeks ago when the Russell 2000 took out 1600+, followed by a successful retest a week later.
In the week to Wednesday, $1.2 billion moved into IWM (iShares Russell 2000 ETF), while IJR (iShares Core S&P Small-Cap ETF) shed $105 million (courtesy of ETF.com). Non-commercials are now net long. These traders had been cutting back net shorts for a while, with net long the last three weeks. The recent breakout in the cash likely helped them get aggressive.
For several months, the Russell 2000 traded within a range. If the breakout is genuine, traders in due course could be eyeing to test the all-time high of 1742.09 from August last year. There is a long way to go before that happens. Near term, bears likely force another retest of 1600+ breakout.
US Dollar Index: Currently net long 22.3k, down 1.6k.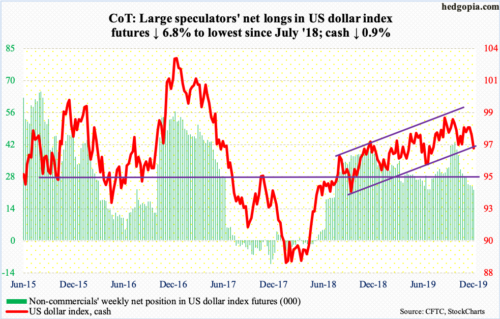
The cash (96.75) fell in all five sessions this week, with a loss of the 200-day Thursday and a test of a rising trend line from September last year. The latter test was successful, although risks are rising of a breach.
There is room for the weekly to continue lower. A loss of 96.30s will accelerate the downward momentum. Immediately ahead, there is resistance just under 97.
VIX: Currently net short 183k, down 16.3k.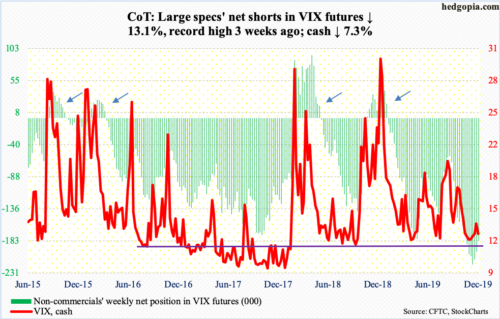
Volatility was volatile this week. The cash (12.63) opened the week with an intraday print of 12.25 on Monday and a high of 16.90 in the very next session. That high represented yet another lower high since VIX retreated after tagging 24.81 early August. Soon, it proceeded to lose both the 200- and 50-day. Near term, the daily has room to head lower still. There is decent support at 12, and at 10-11 after that.
Thanks for reading!
