
Following futures positions of non-commercials are as of January 7, 2020.
10-year note: Currently net short 179.2k, down 55.5k.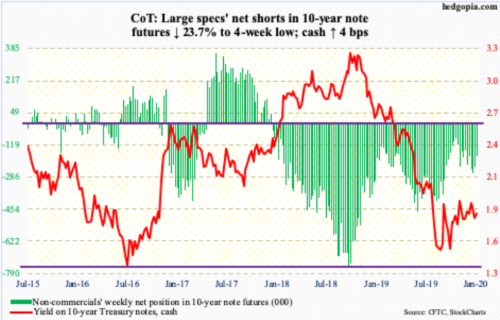
The 10-year Treasury yield (1.83 percent) was rejected at 1.95-1.97 percent in both November and December. The drop since found support at a rising trend line from early September when rates bottomed at 1.43 percent; that low essentially matched the July 2012 trough of 1.39 percent and the low four years after that of 1.34 percent. Hence its significance and possibly of the trend line emanating from that low.
Thus far, there is no breach. Bond bears (on price) put foot down the last couple of weeks. The problem they might face going forward is the weekly, which seems to be itching to go lower. The 50-day moving average (1.84 percent) is now flat. Should a breach of the September trend line occur, a lot will depend on how non-commercials, who still hold decent-size net shorts in 10-year notes, might react. Declining rates will not help their bearish cause.
30-year bond: Currently net short 98.7k, up 1.6k.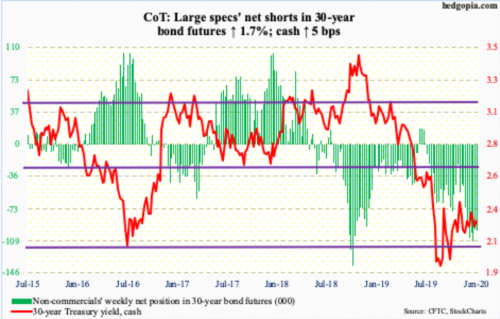
Major economic releases next week are as follows.
The NFIB optimism index (December) and the consumer price index (December) will be published Tuesday.
Small-business optimism rose 2.3 points month-over-month in November to 104.7. The index has remained north of 100 since December 2016.
November CPI and core CPI inched up 0.3 percent and 0.2 percent m/m respectively. In the 12 months to November, they respectively rose 2.1 percent and 2.3 percent.
The producer price index (December) comes out Wednesday. Producer prices were unchanged in November m/m while year-over-year they gained 1.1 percent. Over the same time period, core PPI was unchanged and up 1.3 percent, in that order.
Retail sales (December), Treasury International Capital data (November) and the NAHB housing market index (January) are due out Thursday.
Retail sales increased 3.4 percent y/y in November to a seasonally adjusted annual rate of $528 billion – a new high.
In the 12 months to October, foreigners sold $58.1 billion in US stocks, which is an improvement from last April when they were selling a record $214.6 billion worth.
Builder optimism rose five points m/m to 76 in December. This was the highest since June 1999.
Friday brings housing starts (December), industrial production (December), JOLTS job openings (November) and the University of Michigan’s consumer sentiment index (January).
Housing starts in November surged 13.6 percent y/y to 1.37 million units (SAAR), within striking distance of last August’s cycle high 1.38 million units.
Capacity utilization in November shrank 2.8 percent y/y to 77.3 percent. This was the eighth straight y/y decline. The cycle high 79.6 percent was hit in November 2018.
Non-farm job openings rose 235,000 m/m in October to 7.27 million. The all-time high of 7.63 million was recorded in November 2018.
December consumer sentiment rose 2.5 points m/m to 99.3 – a seven-month high. Except for last August when it printed 89.8, sentiment has remained north of 90 since November 2016, four of which were 100 or higher.
WTI crude oil: Currently net long 764.5k, up 6k.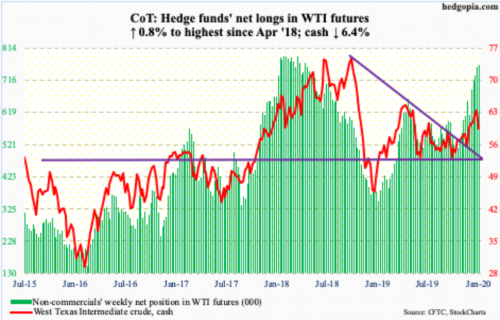
Wednesday was wild. After getting denied at $63-64 in the prior few sessions, the cash ($59.04/barrel) had a very volatile session, with a high of $65.65 and a low of $59.15, closing at $59.61. Thursday, the 50-day ($58.70) was tested. Inability to take out that resistance likely swings near-term odds in favor of bears. The 200-day is right underneath at $57.88, followed by a rising trend line from early October which lies between the averages.
Also Wednesday, the EIA report for the week to January 3 showed US inventory accumulated in crude, gasoline as well as distillates – respectively up 1.2 million barrels, 9.1 million barrels and 5.3 million barrels to 431.1 million barrels, 251.6 million barrels and 139.1 million barrels. Refinery utilization fell 1.5 percentage points to 93 percent. Crude imports rose 378,000 barrels/day to 6.7 million b/d. Crude production remained unchanged at 12.9 mb/d – a record.
E-mini S&P 500: Currently net long 40.8k, down 19.5k.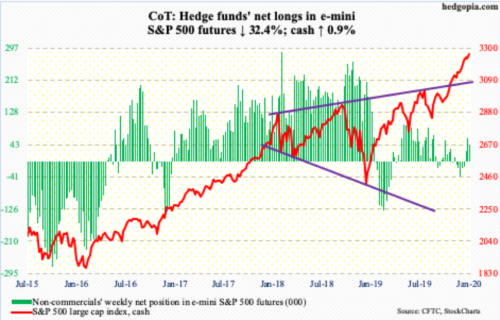
Last week’s potentially bearish spinning top was not confirmed. This week, the cash (3265.35) rallied 0.9 percent. Bears had several opportunities last week and early this week to reclaim the 10-day (3246.13), but bulls held their ground. Momentum remains with the latter.
That said, bears may have some opening here, as Friday’s small reversal took place right at the daily upper Bollinger band. At 67.7, the daily RSI has dropped back below 70.
At least until Wednesday, US-based equity funds were not in confirmation. In the week ended that session, $9.2 billion was withdrawn. This came after a $1.3-billion loss in the prior week (courtesy of Lipper). In the same week, SPY (SPDR S&P 500 ETF), VOO (Vanguard S&P 500 ETF) and IVV (iShares Core S&P 500 ETF) took in $1.7 billion (courtesy of ETF.com).
Euro: Currently net short 61.7k, down 12.7k.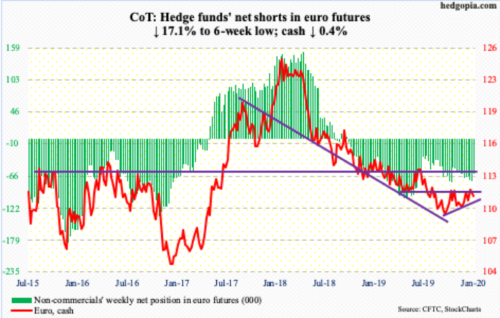
Resistance at $111.80s proved tough after all. Last week, euro bulls rallied the cash ($111.21) to an intraday high of $112.41 but that proved fleeting. Monday this week, the currency again tagged $12.05 intraday but had no staying power. By Wednesday, the 200-day ($111.44) was gone and the now-flattish 50-day ($110.96) was getting tested. A trend-line from early October will be tested at $110.70; Friday’s low was $110.85.
Gold: Currently net long 322.3k, down 5.6k.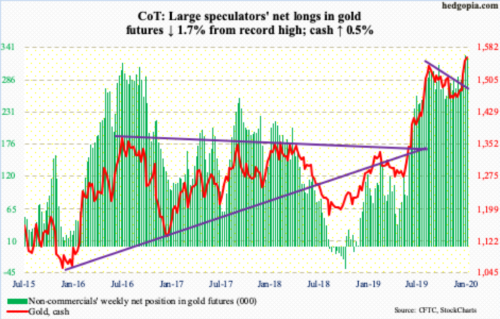
In November last year, the cash ($1,560.10/ounce) bottomed at $1,440s-50s and took off in the second half of December after breaking through a falling trend line from early September when it peaked at $1,566.20. Tensions between the US and Iran helped. The September high was taken out early this week, followed by Wednesday’s wild session when gold vacillated between a high of $1,613.30 and a low of $1,553.40. Resistance at $1,550s-60s, which goes back to April 2011, is massive. Apparently, bears are putting up a good fight around this level.
In the week to Wednesday, GLD (SPDR Gold ETF) lost $328 million, while IAU (iShares Gold Trust) took in $158 million (courtesy of ETF.com). Non-commercials are heavily exposed on the long side and remain the wildcard. They must be keenly watching if support levels will hold going forward. Nearest support rests at $1,520s, then $1,480s. The latter approximates the 50-day ($1,491.38).
Nasdaq 100 index (mini): Currently net long 16.7k, down 9k.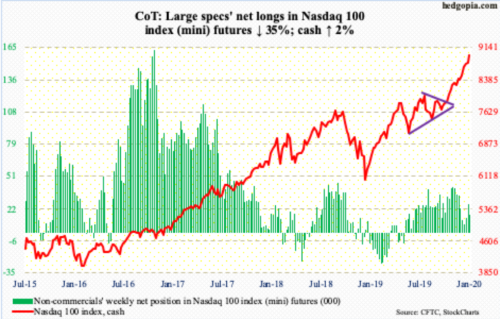
In the week to Wednesday, QQQ (Invesco QQQ Trust) gained $388 million, reversing a loss of $722 million in the prior week (courtesy of ETF.com).
The cash (8966.64) rose to a fresh high Friday, before reversing slightly for a 0.3-percent down session. The daily RSI ended the week at 74.4 and has been north of 70 for nearly a month now; the weekly RSI ended the week at 78.4. Conditions are crazy overbought, but bears continue to struggle to make a dent in bulls’ momentum. Several times in the last couple of weeks, bulls ably defended the 10-day. For a month now, the 20-day has not been tested. Both these averages are still sharply rising. Immediately ahead, the 10-day (8844.35) needs watching.
Russell 2000 mini-index: Currently net long 45.9k, down 5.9k.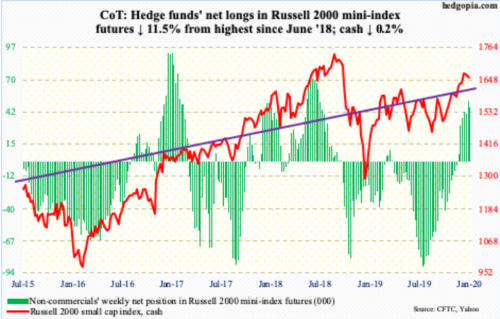
Since the cash (1657.64) retreated after tagging 1681.68 on December 27, small-cap bulls have struggled to regain momentum.
In the week to Wednesday, IWM (iShares Russell 2000 ETF) and IJR (iShares Core S&P Small-Cap ETF) respectively lost $172 million and $260 million (courtesy of ETF.com).
The Russell 2000 fell 0.2 percent for the week, its third straight weekly decline. The 10/20-day is on the verge of a cross-under. Of the major US indices, the index is the only one not to have rallied to a new high. Its all-time high of 1742.09 is yet to be surpassed. The only solace bulls have is that the index remains above 1600-plus, which it broke out of late November.
US Dollar Index: Currently net long 12.5k, up 414.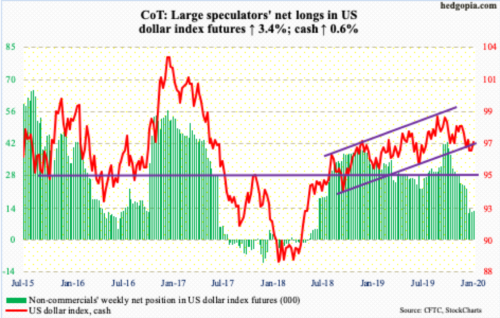
Bulls stepped up right where they needed to. On New Year’s Eve, the cash (97.08) dropped to 96.02 intraday to briefly lose a rising trend line from September 2018. The trend line was again lost in the early part of this week, but only to attract bids. Resistance at 96.80s quickly fell. Both the 50- and 200-day (97.39 and 97.43 respectively ) lie above. They are the ones to watch, as they approximate resistance at 97.50s.
VIX: Currently net short 144.9k, down 8k.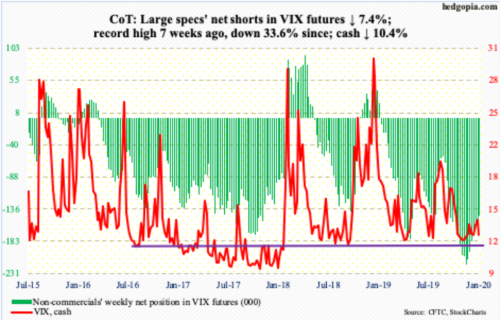
Once again, trend-line resistance from last August came in the way. Back then, the cash (12.56) peaked at 24.81, before progressively making lower highs. Monday’s intraday high of 16.39 kissed that trend line and headed lower. Several times over the last couple of weeks, the 200-day (14.97) was recaptured intraday, but not by close. The 50-day (13.15) was lost Thursday. Several times last month, VIX lost 12 intraday but was saved by close. This level needs watching.
Volatility bulls’ inability to take out the aforementioned trend line comes in the midst of aggressive buying of calls in the options market. Three out of five sessions this week, the CBOE equity-only put-to-call ratio came in 0.40s and the other two in 0.50s. The 21-day moving average of the ratio ended the week at 0.521, which is the lowest since July 2014. Investor optimism is dangerously high, but kudos to the optimists, they have been on the right side of this trade for over three months now. Unwinding of this optimism is bound to inflict pain.
Thanks for reading!
