
Following futures positions of non-commercials are as of March 24, 2020.
10-year note: Currently net short 212k, down 39.1k.
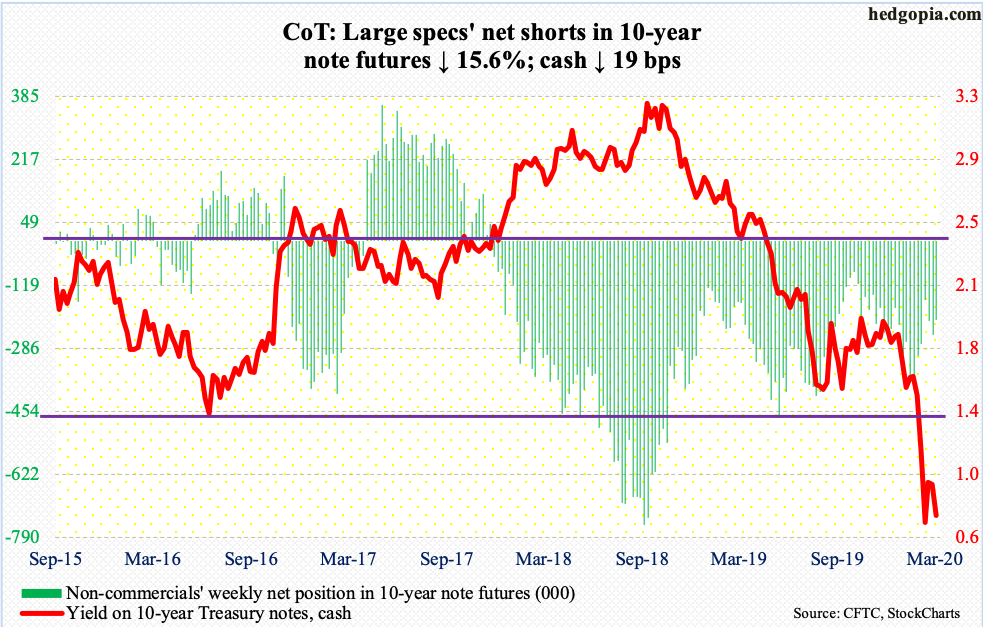
Monday, the Fed went all in – essentially. It now has an open-ended QE program in place. There is no set amount. The balance sheet has no limits. For the first time, it is also moving into corporate bonds, with plans to buy investment-grade securities in both primary and secondary markets and through ETFs. Both the European Central Bank and the Bank of Japan already buy corporate bonds; the latter also buys equity ETFs.
This marked a third emergency announcement in as many weeks.
On March 3, the fed funds rate was cut by 50 basis points. Then on the 15th, the policy rate was cut by another 100 basis points to a range of zero to 25 basis points; it also committed to purchase $500 billion in Treasuries and another $200 billion in mortgage-backed securities over coming months. None of these intra-meeting moves soothed investor nerves.
The Fed – and other major central banks – wants markets to stabilize, animal spirits to kick in and wealth effect to begin to reverberate through the global economy. This is precisely how things unfolded in the wake of the 2007-2009 financial crisis; central bank activism worked. But at the same time, central banks were now interfering with the natural ups and downs of economic cycles. Their balance sheets ballooned, and overall debt continued to accumulate in the system.
This is probably why markets’ reaction function has been different this time. It is too soon to say if they have decided to challenge the ‘do not fight the Fed’ adage, but if that is indeed the case, then central banks are out of ammo.
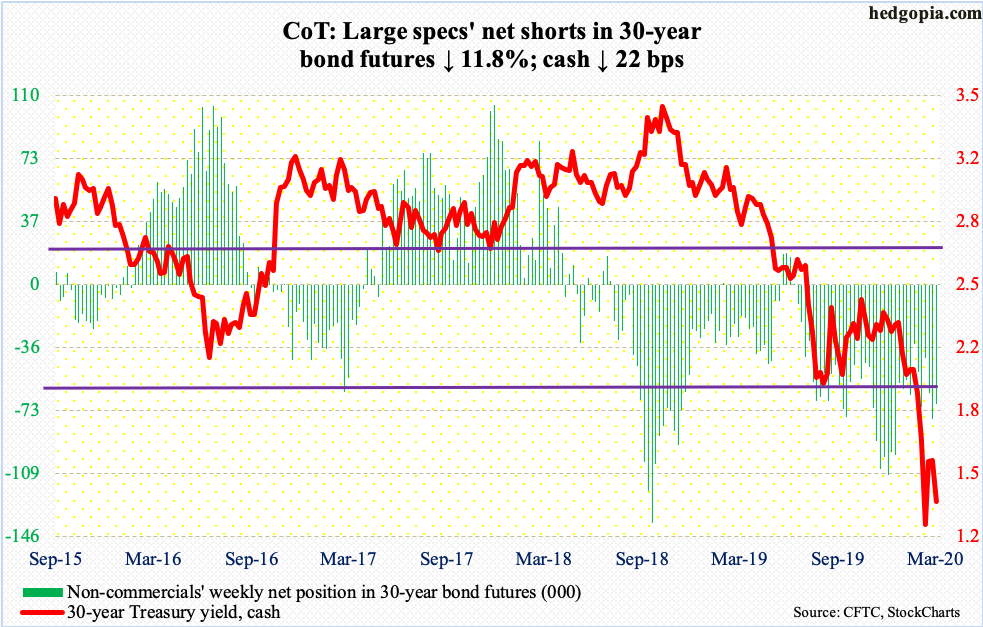
30-year bond: Currently net short 68.9k, down 9.2k.
Major economic releases next week are as follows.
The S&P Case-Shiller home price index (January) is due out Tuesday. Nationally, home prices rose 3.8 percent year-over-year in December.
Wednesday brings the ISM manufacturing index (March). Manufacturing activity in February dropped eight-tenths of a point in February to 50.1. For five months through last December, activity was sub-50.
Durable goods orders (February, revised) are scheduled for Thursday. Preliminarily, orders for non-defense capital goods ex-aircraft – proxy for business capex plans – fell 0.6 percent y/y to a seasonally adjusted annual rate of $68.8 billion. The all-time high of $70 billion was reached in July 2018.
Employment (March) and the ISM non-manufacturing index come out Friday.
In both January and February, the economy produced 273,000 non-farm jobs. This is much better than last year’s monthly average of 178,000 but is set to deteriorate fast, thanks to the coronavirus.
Services activity rose 1.8 points m/m in February to 57.3 – a 12-month high.
WTI crude oil: Currently net long 603.5k, up 11.4k.
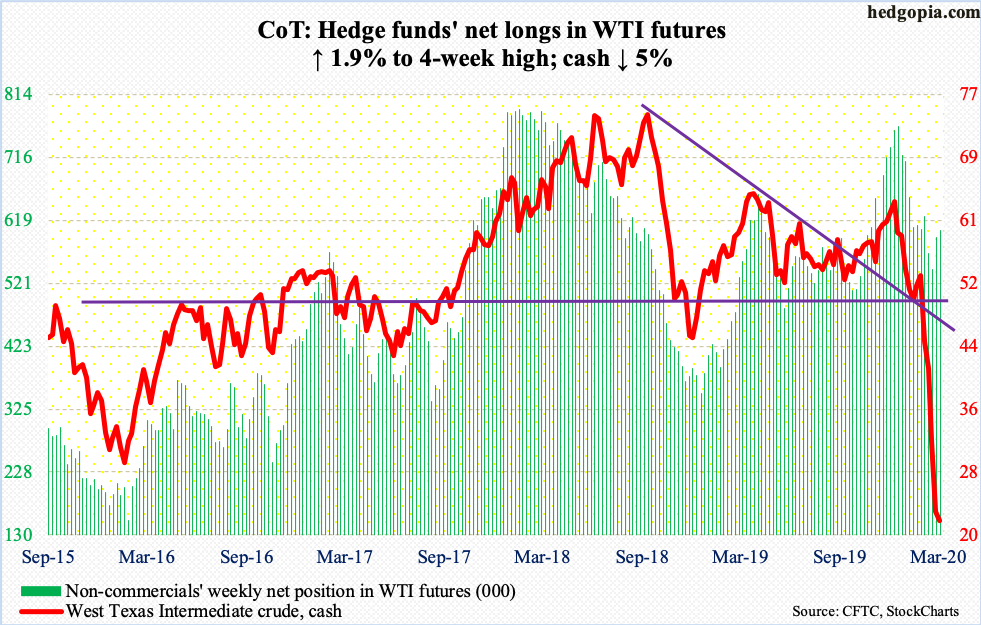
With two more sessions to go this month, the cash ($21.51/barrel) is down an astounding 51.9 percent. As a matter of fact, using the March 18th intraday low of $20.52, WTI crashed 54.2 percent, and 68.7 percent from the January 8th high of $65.65.
Last week’s low was tested this week – successfully. The crude has more or less gone sideways the last several sessions, with some signs of stability. There were two daily spinning top candles this week. At the same time, rally attempts are pushed down by the still-falling 10-day moving average. If WTI cannot rally soon, breach risks of $20.50s rise.
Traders were essentially indifferent to the EIA report for the week of March 20. U.S. crude production fell 100,000 barrels/day from record 13.1 million b/d. Crude imports dropped 422,000 b/d to 6.1 mb/d. As did stocks of gasoline and distillates – respectively down 1.5 million barrels and 678,000 barrels to 239.3 million barrels and 124.4 million barrels. Refinery utilization rose nine-tenths of a percentage point to 87.3 percent. Crude stocks, however, increased 1.6 million barrels to 455.5 million barrels.
E-mini S&P 500: Currently net long 12.7k, down 4.3k.
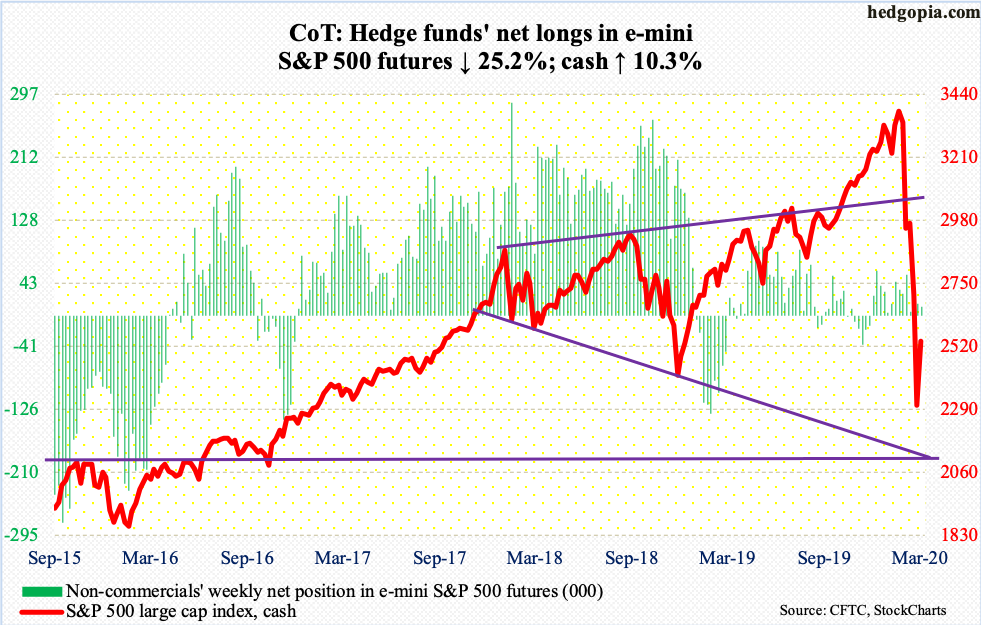
Monday’s intraday low of 2191.86 marked a crash of 35.4 percent in merely 24 trading sessions. The cash (2541.47) made that low just above crucial support – both horizontal and trend line – just north of 2100 (more on this here). From that low through Thursday’s high, the S&P 500 then surged 20.3 percent!
The preceding selloff drove many indicators into deep oversold territory. Even after this week’s rally, merely 1.8 percent of S&P 500 stocks are above their 50-day moving average. Investor sentiment is at multiyear lows (more on this here) and a growing amount of cash is sitting idle in the money market.
In the week to Wednesday, money-market assets jumped $285.7 billion week-over-week to $4.22 trillion – a new record (courtesy of ICI). In the same week, SPY (SPDR S&P 500 ETF), VOO (Vanguard S&P 500 ETF) and IVV (iShares Core S&P 500 ETF) lost $2.5 billion, while $27.1 billion left U.S.-based equity funds – sixth consecutive weekly outflows for a loss of $90.5 billion (courtesy of Lipper).
On the daily, Thursday’s rally pushed several indicators such as the RSI toward the median. Odds favor they turn back down from here. The 10-day lies at 2430s.
Euro: Currently net long 61.3k, up 28.8k.
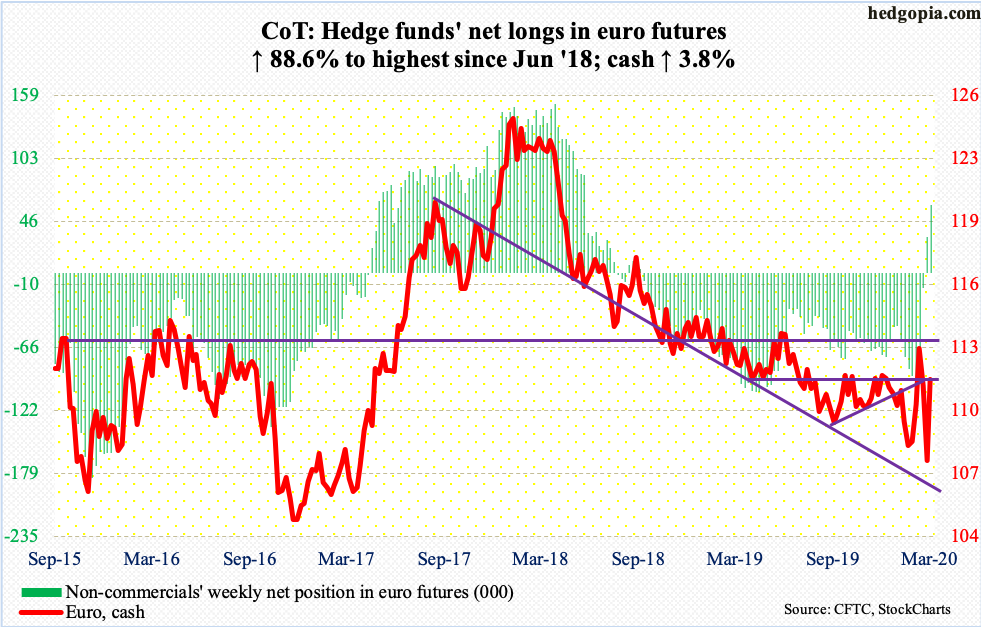
Last week, euro bulls defended support at a falling trend line from July 2017. This preceded a drop of over seven percent in 10 sessions intraday. From last Friday’s low of $106.35, the cash ($111.53) quickly rallied to $111.49 intraday this Friday.
These are not normal moves – not for a major currency like the euro, or the greenback for that matter. At the same time, these are also signs of the times. Coronavirus-spurred volatility has picked up across assets, and currencies are not immune.
There is decent resistance at $111.80s.
Gold: Currently net long 288.4k, up 6.5k.
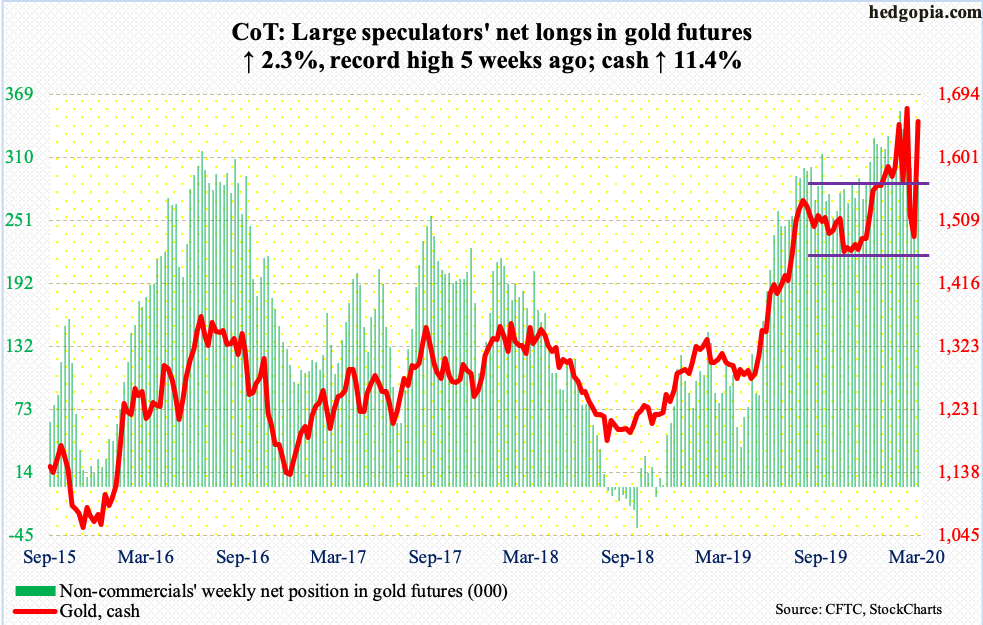
The cash ($1,654.10/ounce) went from $1,704.30 15 sessions ago to $1,450.90 10 sessions ago to $1,699.30 three sessions ago. That is volatile – not befitting a safe-haven asset. But that is how markets have behaved the last five weeks, gold including.
After defending $1,450s two weeks ago, the metal shot up – past both the 50- and 200-day and into $1,700. Gold bugs have been hammering on this resistance the last five weeks. A decisive breakout will be massive.
This week’s rally had full support from fund flows. In the week to Wednesday, IAU (iShares Gold Trust) gained $109 million and GLD (SPDR Gold ETF) $1.3 billion (courtesy of ETF.com).
Nasdaq 100 index (mini): Currently net long 27.4k, up 5k.
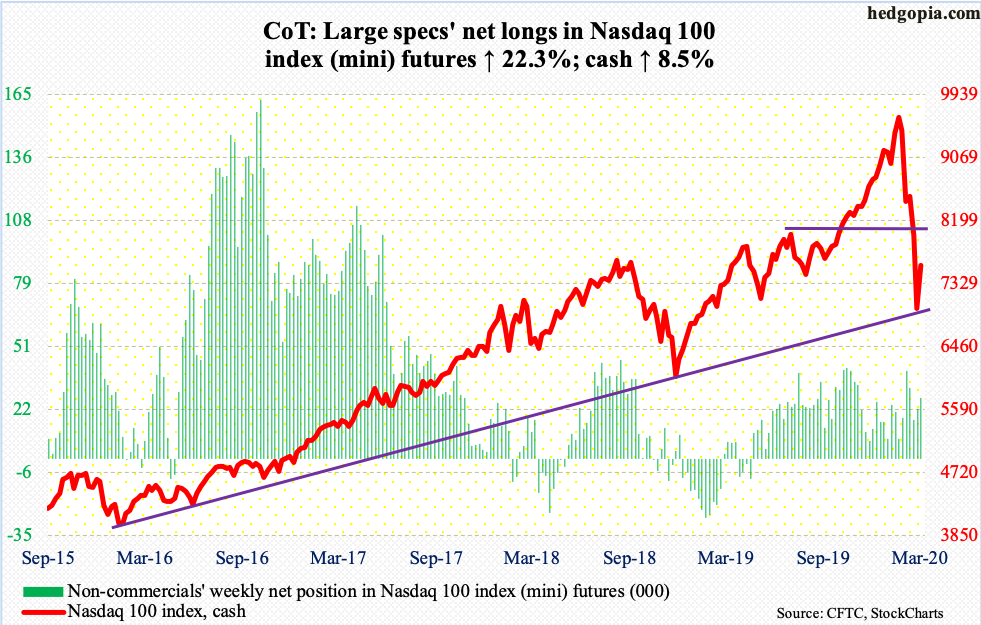
From its record intraday high of 9736.57 on February 19 through Monday’s low of 6771.91, the cash (7588.37) collapsed 30.4 percent in 24 sessions. That low successfully tested a rising trend line from February 2016. The Nasdaq 100 then surged 16.9 percent through Thursday’s high!
Flows cooperated, with QQQ (Invesco QQQ Trust) gaining $4.4 billion in the week to Wednesday (courtesy of ETF.com).
Shorts, too, likely helped. Mid-March, Nasdaq short interest was the highest since October 2015 (more on this here). At one time, the Nasdaq 100 was down 20 percent this month. After seeing the February 2016 trend line defended, it is possible shorts covered. They are likely to reappear around 8000. Thursday’s intraday high was 7913.11.
Russell 2000 mini-index: Currently net short 19.7k, up 3.9k.
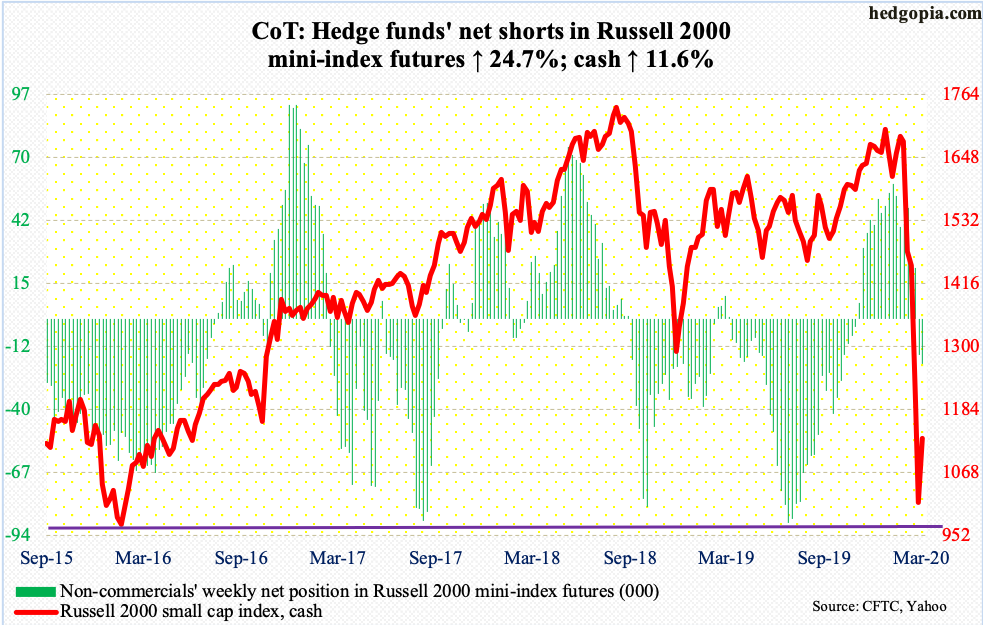
In the week to Wednesday, IWM (iShares Russell 2000 ETF) took in $1.7 billion, while IJR (iShares Core S&P Small-Cap ETF) lost $395 million (courtesy of ETF.com).
In the last several sessions, small-cap bulls aggressively defended the lows of February 2016, including this Monday. By then, the cash (1131.99) was down 43 percent from its February 20th high, and 44.5 percent from August 2018 when it peaked at 1742.09.
From last week’s low through Thursday’s high, the Russell 2000 then jumped 22.2 percent! This is a massive move in such a short period of time. Digestion of these gains is the path of least resistance near term. On IWM ($112.56), there was gap-down resistance at $120, with Thursday tagging $117.60 intraday.
US Dollar Index: Currently net long 12.5k, up 5.4k.
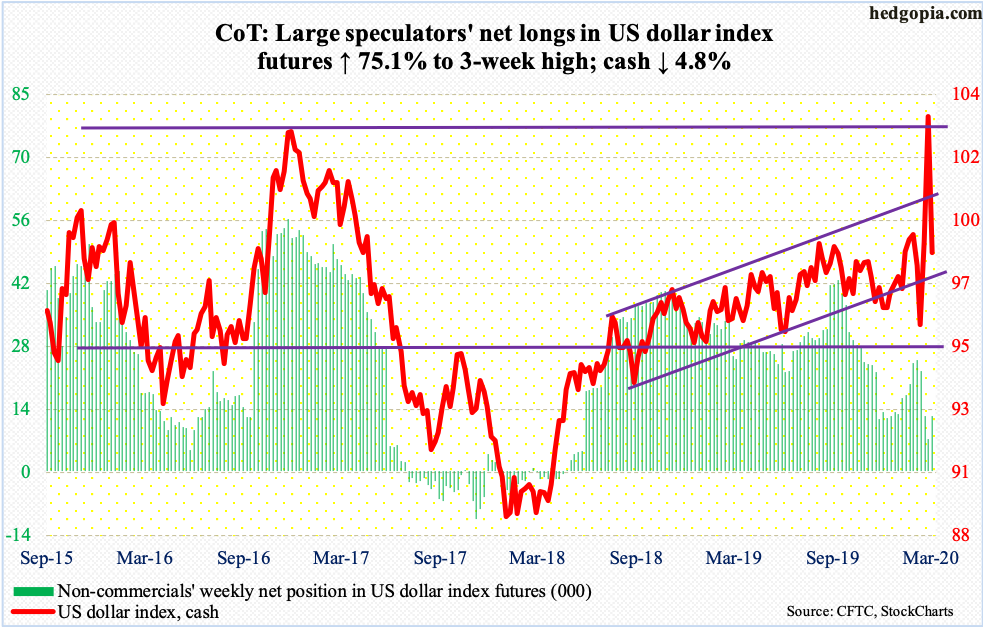
Having rallied just under 10 percent intraday in the prior two weeks, the cash (98.54) tumbled 4.8 percent this week.
In January 2017, the US dollar index retreated after tagging 103.82. Last week, it hit 103.83, before pulling back ever so slightly. This week, in Monday’s spinning top session it hit 103.96 before coming under pressure and then quickly unraveling in the next four sessions. It essentially closed Friday on the 50-day (98.57). The 200-day is at 97.77, which also approximates horizontal support at 97.50s.
VIX: Currently net short 18.7k, down 60.8k.
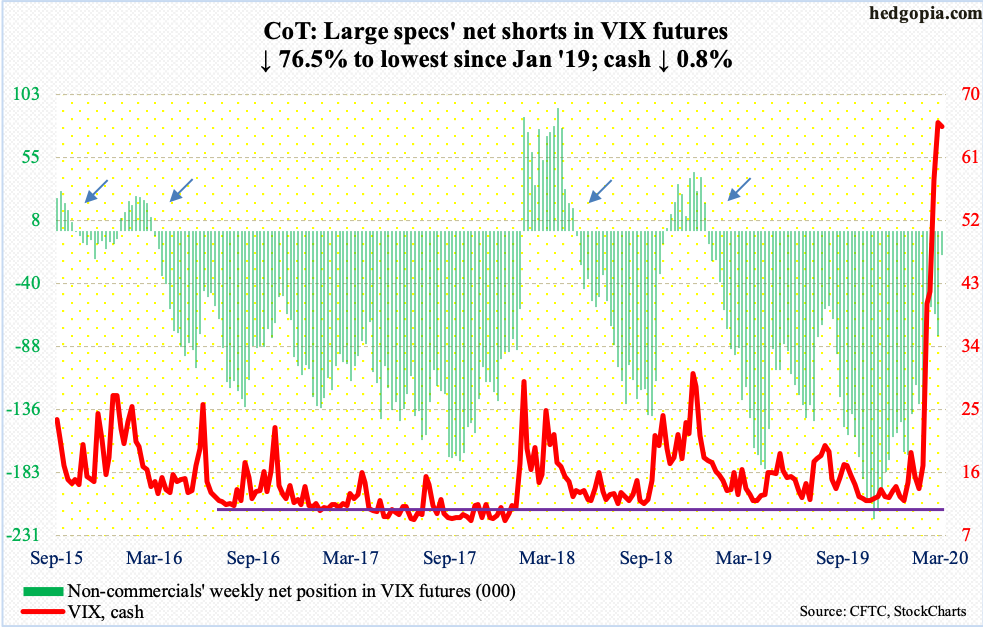
Volatility itself is quite volatile.
On March 18, the cash printed 85.47, which was the highest since October 2008 when VIX surged to an all-time high of 89.53. By Tuesday, it dropped to 36.24 intraday, before closing out the week at 65.54. Last week’s low was a test of the December 2018 high when VIX peaked at 36.20. Defense of that high is perhaps an indication that we could be in for sustained volatility for some time to come.
Non-commercials reduced their net shorts to 18,708 contracts – the lowest since January last year. In the past, the cash has shown a tendency of sustainably going lower once these traders go net long. Unwinding, however, either begins shortly afterward or can take a while.
Immediately ahead, volatility could be itching to perk up. VIX held up strongly this week – only down 0.8 percent against powerful rally in equities.
Thanks for reading!
