
Following futures positions of non-commercials are as of April 7, 2020.
10-year note: Currently net short 61k, up 8k.
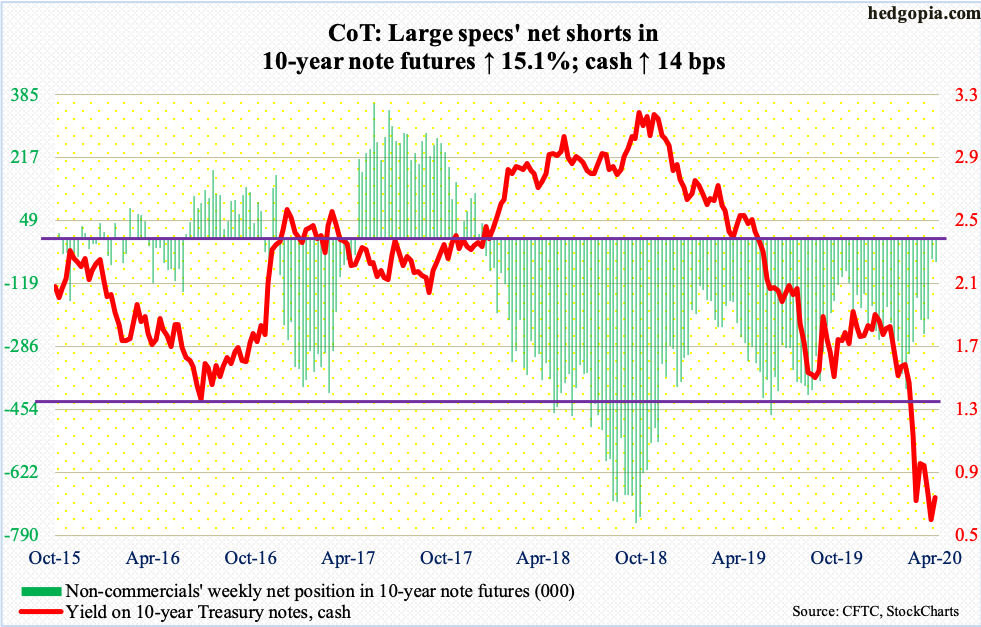
The Fed continues to spread its policy tentacles. During the financial crisis of 2007-2008, it began to aggressively purchase Treasury securities and mortgage-backed securities, bringing its balance sheet to $4.52 trillion by January 2015. In a planned reduction, its assets then fell to $3.76 trillion by last August. From that low, the balance sheet expanded by $2.32 trillion in less than eight months, and by $1.92 trillion in just the past six weeks, to $6.08 trillion! It is not done going up.
On March 15th this year, the Fed ventured into investment-grade corporate bonds, and into junk and municipal debt this week. Thursday, it announced up to $2.3 trillion in loans to support local governments and small and mid-size businesses. It can now buy HYG. It is a junk ETF. The Fed is simply trying to preempt where things are headed. In the months/quarters ahead, billions of dollars of corporate debt risk a downgrade to junk. Until recently, Ford (F) was investment-grade, which has now been downgraded to junk.
It increasingly feels like it is just a matter of time before the central bank begins buying equities. As a matter of fact, Janet Yellen, Chair Jerome Powell’s predecessor, kind of tested the waters this week, saying the Fed currently is not in a position where it needs to buy equities but that lawmakers should give it more leeway for the future. This was Monday. Stocks could not have rejoiced at the thought any better. They rallied strongly this week.
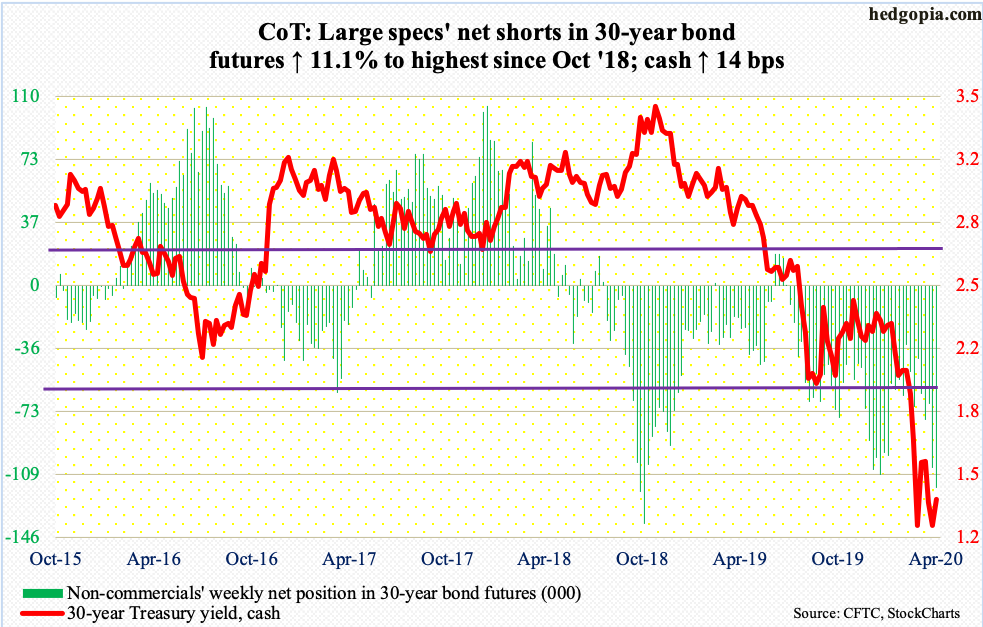
30-year bond: Currently net short 117.5k, up 11.8k.
Major economic releases next week are as follows.
Retail sales (March), industrial production (March), the NAHB housing market index (April) and Treasury International Capital data (February) are due out Wednesday.
Retail sales in February increased 4.4 percent year-over-year to a seasonally adjusted annual rate of $528.1 billion. January’s $530.9 billion was a record.
Capacity utilization fell 1.9 percent y/y in February to 77 percent. This was the 11th consecutive y/y contraction. The cycle high 79.6 percent was reached in November 2018.
March builder sentiment fell two points month-over-month to 72. Last December’s 76 was the highest since June 1999.
In the 12 months to January, foreigners purchased $30.1 billion in U.S. stocks. This was the first positive month in 17 months. Last April, they sold $214.6 billion worth – a record – before the trend reversed to the upside.
Housing starts (March) come out Thursday. Starts dropped 1.5 percent in February from January’s 1.62 million units (SAAR), which was the highest since December 2006.
WTI crude oil: Currently net long 642.7k, up 36k.
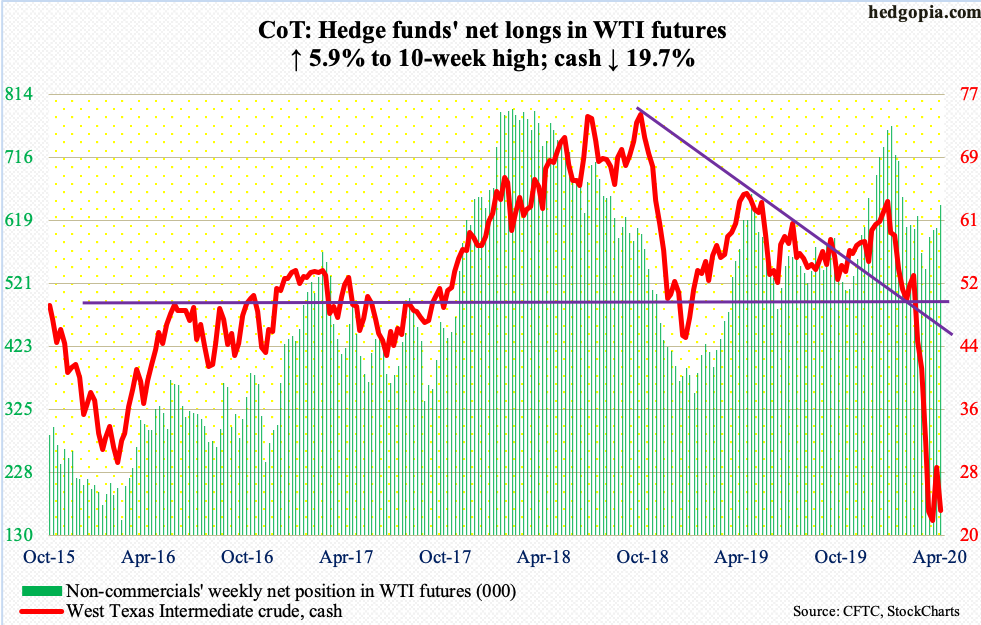
The OPEC+ meeting ended without a deal on Thursday, with plans to meet again on Monday. Mexico is reluctant to cut its share of oil. Otherwise, OPEC plus other countries including Russia have agreed to cut about 10 million barrels per day. Demand destruction due to the coronavirus is much higher than that, which means supply will continue to rise. Markets were hoping for a bigger cut. Plus, the two-month cuts would not begin until May. Additionally, Friday’s G20 meeting of energy ministers concluded without finalizing specific production numbers.
On Thursday, the cash ($22.76/barrel) tumbled 9.3 percent – and 19.7 percent for the holiday-shortened week. After a massive two-session rally on Thursday and Friday last week, rally attempts this week were sold at $28.20s. On March 30th, the crude fell to $19.27, which was the lowest since February 2002, with decent support at $20-21. Bears are again eyeing this level.
As far as U.S. crude production was concerned, it dropped 400,000 b/d in the week to April 3 to 12.4 mb/d. Crude imports fell as well, down 173,000 b/d to 5.9 mb/d. Stocks of crude, gasoline and distillates all increased – by 15.2 million barrels, 10.5 million barrels and 476,000 barrels respectively to 484.4 million barrels, 257.3 million barrels and 122.7 million barrels. Refinery utilization dropped 6.7 percentage points to 75.6 percent.
E-mini S&P 500: Currently net short 140k, up 111.2k.
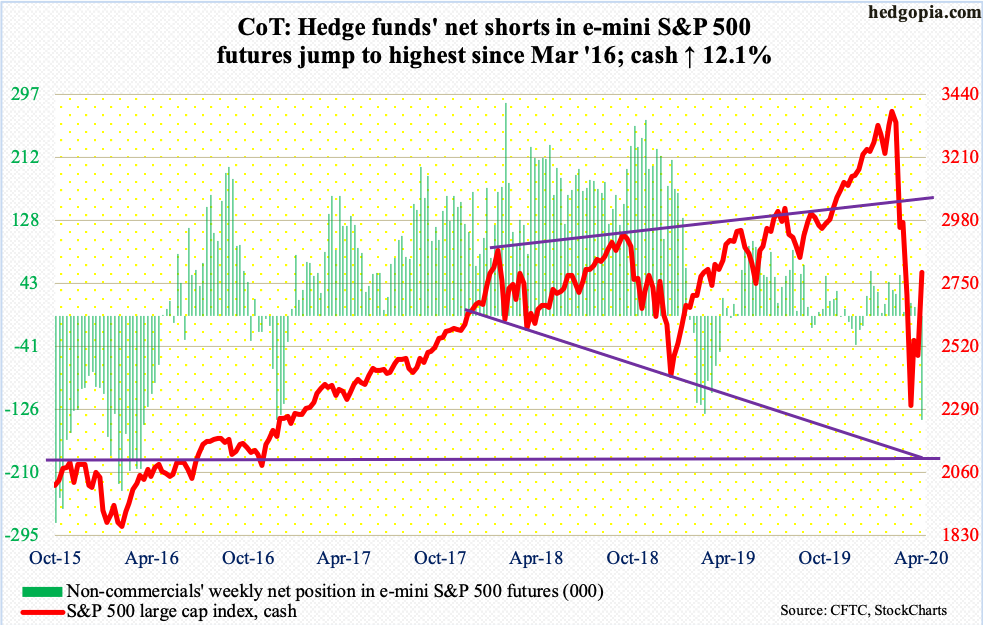
The Fed is doing all it can to backstop Wall Street and “Main Street”. Longs are convinced of a V-shaped economic recovery ahead. Off the March 23rd intraday low through Thursday’s high, the cash (2789.82) surged 28.6 percent. The reality is otherwise. In the months/quarters to come, there will be tons of bankruptcies, and unemployment will soar, among others.
Yes, several sentiment metrics reached washout levels three weeks ago, and this needed to unwind. With this, the S&P 500 has reached a crucial juncture. Thursday’s high of 2818.57 ran into two-year horizontal resistance at 2800-2850. Shorts likely will get active here.
Even after the rally of the last three weeks, money-market assets continued to swell, reaching record $4.47 trillion in the week to Wednesday (courtesy of ICI). In the same week, $62.3 billion came out of U.S.-based equity funds (courtesy of Lipper), even as SPY (SPDR S&P 500 ETF), VOO (Vanguard S&P 500 ETF) and IVV (iShares Core S&P 500 ETF) collectively gained $7.9 billion (courtesy of ETF.com).
Euro: Currently net long 79.6k, up 5.4k.
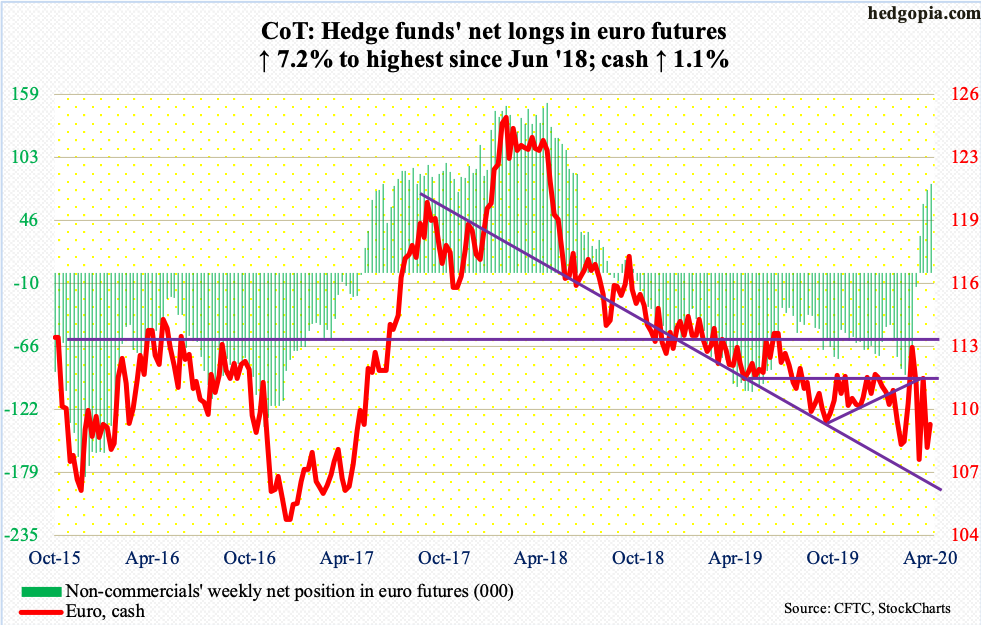
In a long-legged doji session Monday, bulls defended support at $107.80s. The cash ($109.25) has been on a roller coaster ride for a month and a half now. This is the fourth straight week of alternating between positive and negative. This week, the euro rallied 1.1 percent. Should the uptrend continue, the upper bound of a two-year descending channel lies around $111.
Gold: Currently net long 248.9k, down 9.9k.
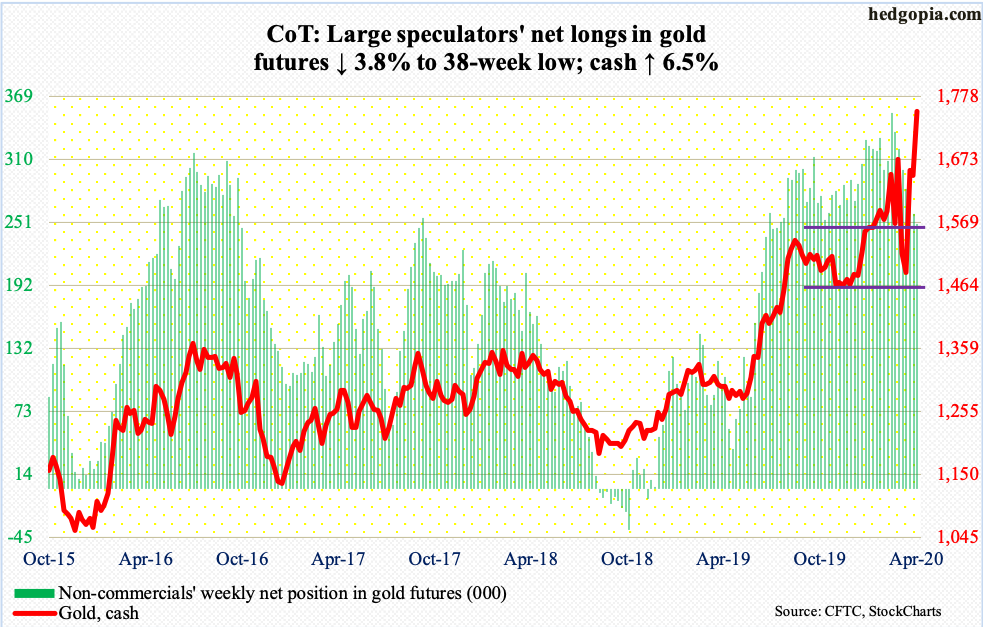
On a day in which the Fed’s reach was further broadened to now include junk debt, the cash ($1,752.80/ounce) Thursday jumped 4.1 percent. Since late February, gold had been persistently denied at $1,700. Gold bugs nevertheless continued to defend support – $1,450s mid-March and $1,550s-60s early this month. Now, they have a breakout; $1,700 should now act as support. The metal is now at the highest level since November 2012. In September 2011, it peaked at $1923.70.
Flows continued to be positive. In the week to Wednesday, IAU (iShares Gold Trust) gained $358 million and GLD (SPDR Gold ETF) $1 billion (courtesy of ETF.com). In the past three weeks, the two combined drew $4.2 billion.
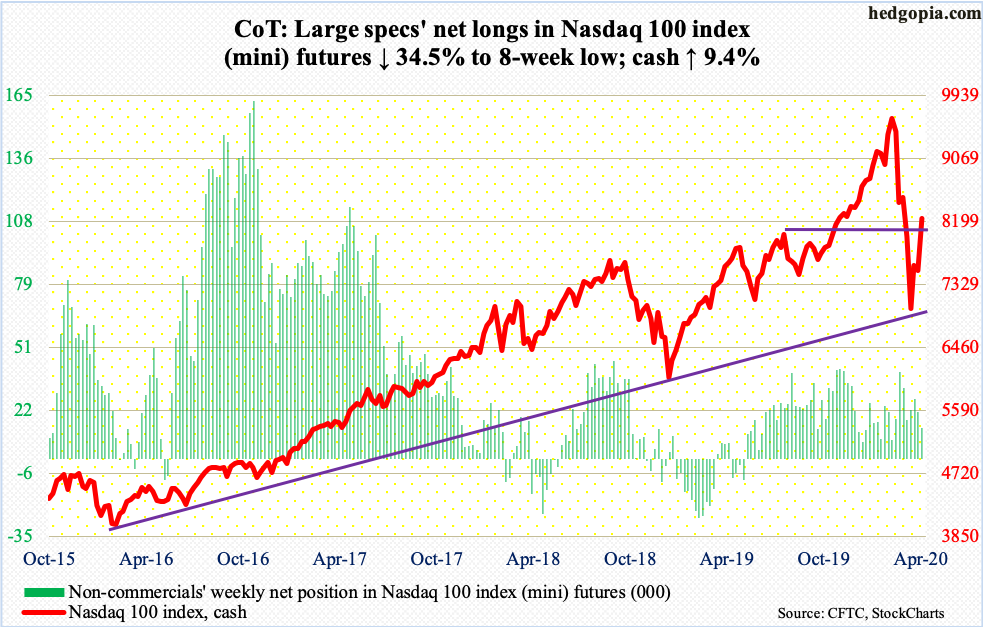
Nasdaq 100 index (mini): Currently net long 14k, down 7.4k.
In the week to Wednesday, QQQ (Invesco QQQ Trust) took in $2.1 billion (courtesy of ETF.com).
The cash (8238.53) managed this week to eke out a close above the 200-day moving average (8200.45). Otherwise, on a relative basis, it was an underperformer – up 9.4 percent versus up 12.1 percent for the S&P 500.
Rather revealingly, the Nasdaq 100 is yet to fulfill the technical definition of a bull market. On a closing basis, between March 23rd and this Thursday, it rallied 17.5 percent. In contrast, the S&P 500 is up 24.7 percent during the period (more on this here). Typically, a bull market is defined as a 20 percent rise from the prior low. One of the indices is lying, the other is telling the truth. Time will tell.
As things stand, the Nasdaq 100 faces resistance at 8300s, with the 50-day at 8448.16.
In the meantime, Nasdaq shorts covered big in the second half of March, when short interest fell 7.6 percent period-over-period to a 10-month low (chart here). April-to-date, the index is up 5.9 percent, and short-covering has likely continued, reducing potential fuel for squeeze.
Russell 2000 mini-index: Currently net short 11.1k, down 2.1k.
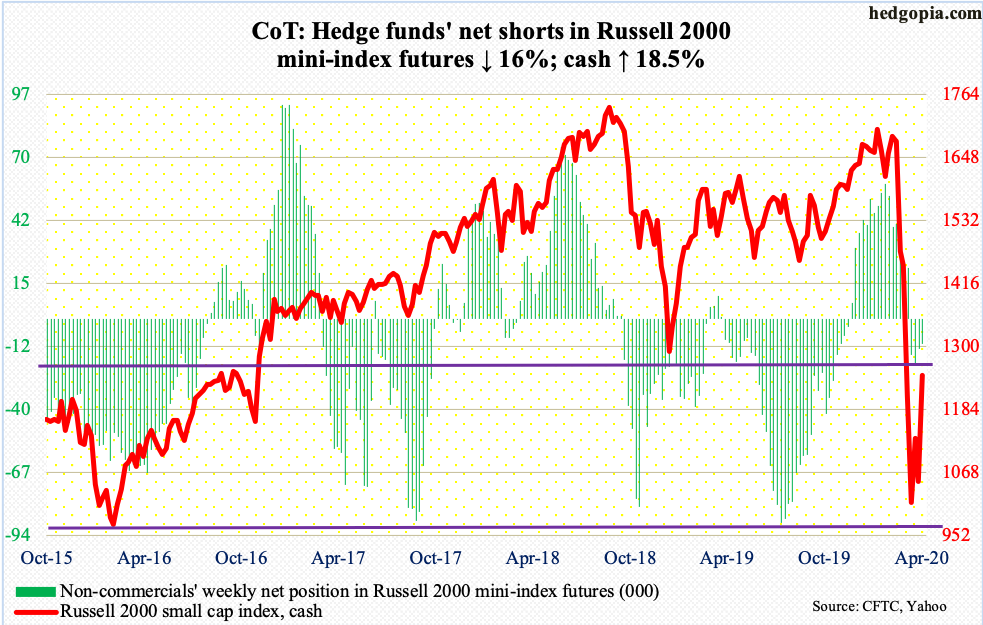
Reversing last week’s 7.1 percent decline, the cash (1246.73) shot up 18.5 percent this week. This was a strong vote of confidence by investors, who were otherwise increasingly risk-averse (more on this here). The question is if this will be followed by a follow-through.
As far as flows were concerned, news was not very encouraging. In the week to Wednesday, $1.1 billion came out of IWM (iShares Russell 2000 ETF), even as IJR (iShares Core S&P Small-Cap ETF) lost $7 million (courtesy of ETF.com).
Technically, the Russell 2000 sits right underneath five-year horizontal resistance at 1250s. In December 2018, the index bottomed at 1266.92 before rallying to 1715.08 by January 17th this year. There are a lot of trapped bulls around this level. They may very well be tempted to exit at breakeven.
US Dollar Index: Currently net long 15k, up 959.
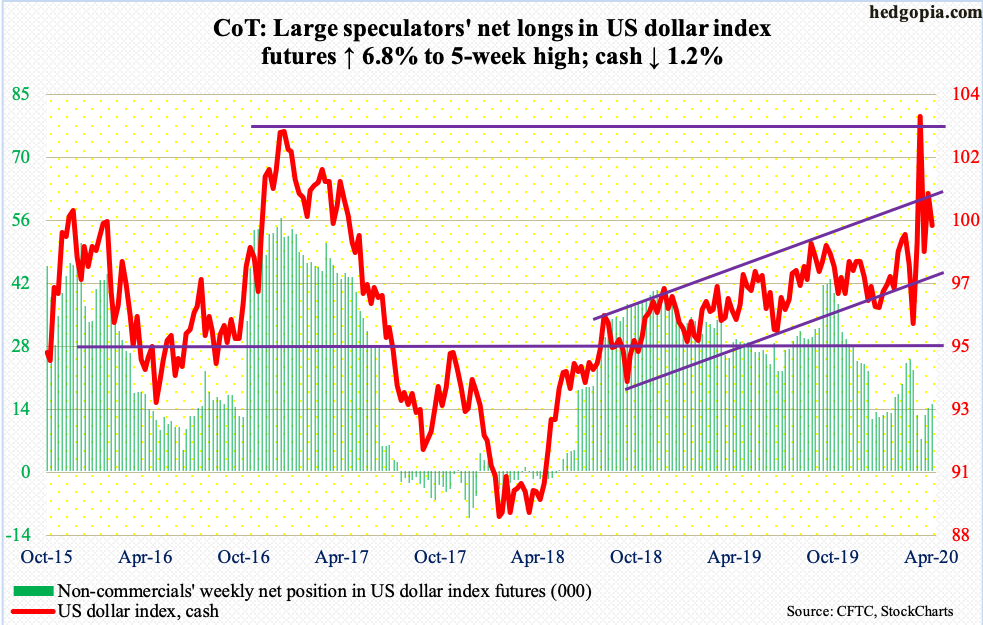
For the second straight week, dollar bulls were denied at the upper bound of an ascending channel from August/September 2018.
Last Friday, the cash (99.50) tagged 100.97. This was followed this Monday by a rally to 101.03 before selling picked up speed. The lower bound of the channel rests at 97.20s.
VIX: Currently net short 30.6k, up 12.2k.
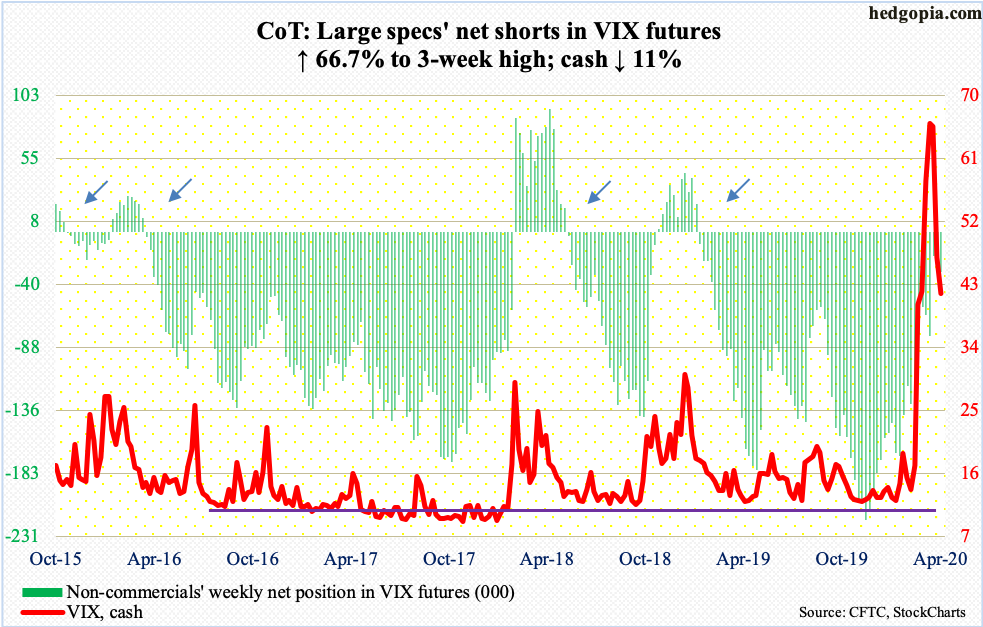
After inflating to 85.47 on March 18th, which was the highest print since the record high 89.53 from October 2008, the cash (41.67) has had three negative weeks. Since that high, VIX has made lower highs, although the pace of decline has moderated. The 50-day at 40.18 is right underneath, even as the daily is getting oversold. The volatility index remains above the December 2018 high of 36.20, which was defended 13 sessions ago. The downtrend from the March 18th high gets broken at 45.
Thanks for reading!
