
Following futures positions of non-commercials are as of August 10, 2021.
10-year note: Currently net long 108.8k, up 21.1k.
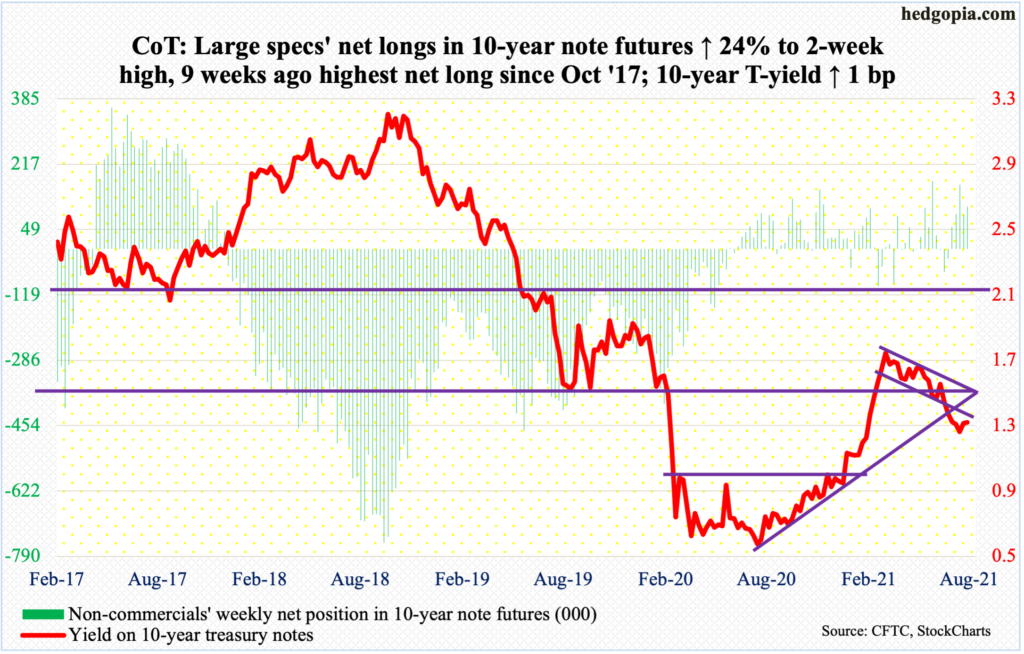
FOMC minutes for the July 27-28 meeting are due out on Wednesday. In that meeting, it was stated that progress has been made towards the economic goals the Fed hopes to achieve before slowing down its bond buying. Previously, it had said it wanted to see substantial progress.
Prior to this, during the June 15-16 meeting, members brought forward their projections for interest rate hikes into 2023, with 11 of them penciling in at least two quarter-point increases for 2023.
In recent weeks and months, the number of FOMC members calling for tapering to begin has gone up, although they continue to be in the minority. Add Vice-Chair Richard Clarida to this list. Early this month, he said rate increases could come as soon as early 2023. The other two important voices – Chair Jerome Powell and John Williams, New York Fed president who has a permanent voting seat – continue to lean dovish but may be looking for reasons to soften their stance.
This week, the doves got something to hang their hat onto. Consumer inflation softened in July, with core CPI rising 4.3 percent year-over-year, down from June’s 4.5 percent pace. In the months ahead, inflation will probably continue to moderate. Even amidst this, the odds of tapering to begin later this year are high. At some point, hawks such as James Bullard, St. Louis Fed president, will probably begin to focus on asset bubbles caused by the so-called Fed put.
The Fed continues to print, with the balance sheet having gone up $4 trillion from early March last year to $8.26 trillion. Plenty of liquidity is sloshing around in the system, finding a home in equities, in housing, and what not. This is likely to be the new focus, with rising odds of tapering to begin later this year.
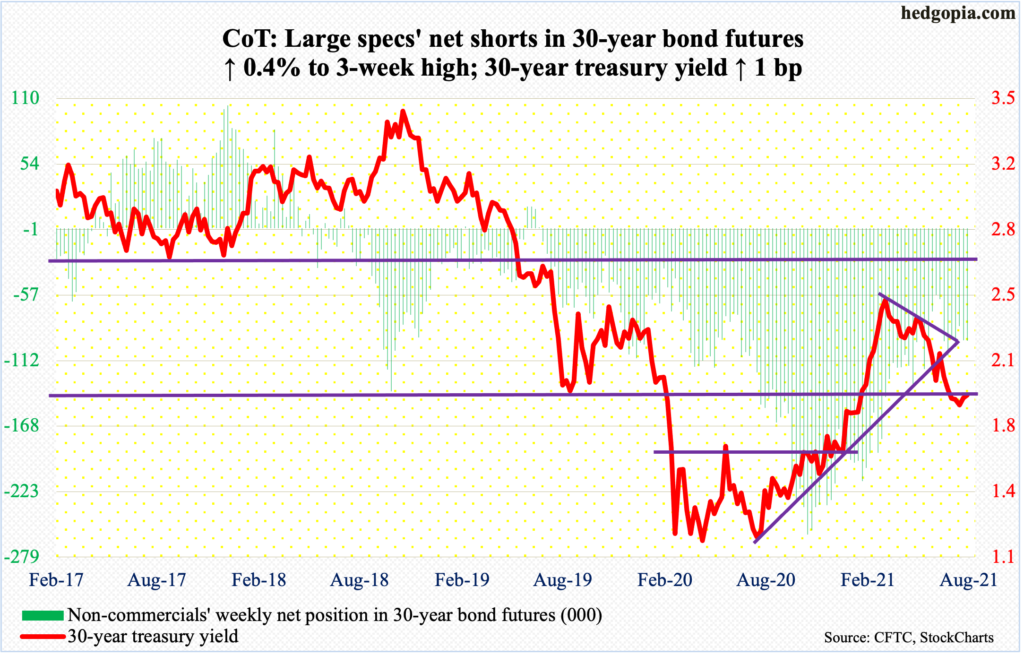
30-year bond: Currently net short 95.6k, up 402.
Major economic releases for next week are as follows.
Monday brings Treasury International Capital data (June). In the 12 months to May, foreigners purchased $316.3 billion in US stocks. This is a massive amount, although the pace is softer than $398.1 billion in April and $405.9 billion in March, with the latter a record.
Retail sales (July), industrial production/capacity utilization (July) and the NAHB Housing Market Index (August) are due out on Tuesday.
Retail sales in June jumped 18 percent year-over-year to a seasonally adjusted annual rate of $621.3 billion. As heady as this growth rate is, this is still much lower than April’s 53.4 percent pace when sales posted record $628.8 billion.
Capacity utilization increased 0.4 percent month-over-month in June to 75.4 percent – a 16-month high.
Homebuilder optimism dropped a point m/m in July to 80. Last November, the metric hit record 90, which was three times the post-pandemic low of 30 from April last year.
Housing starts (July) will be published on Wednesday. In June, starts rose 6.3 percent m/m to 1.64 million (SAAR) – a three-month high.
WTI crude oil: Currently net long 391.5k, down 40.2k.
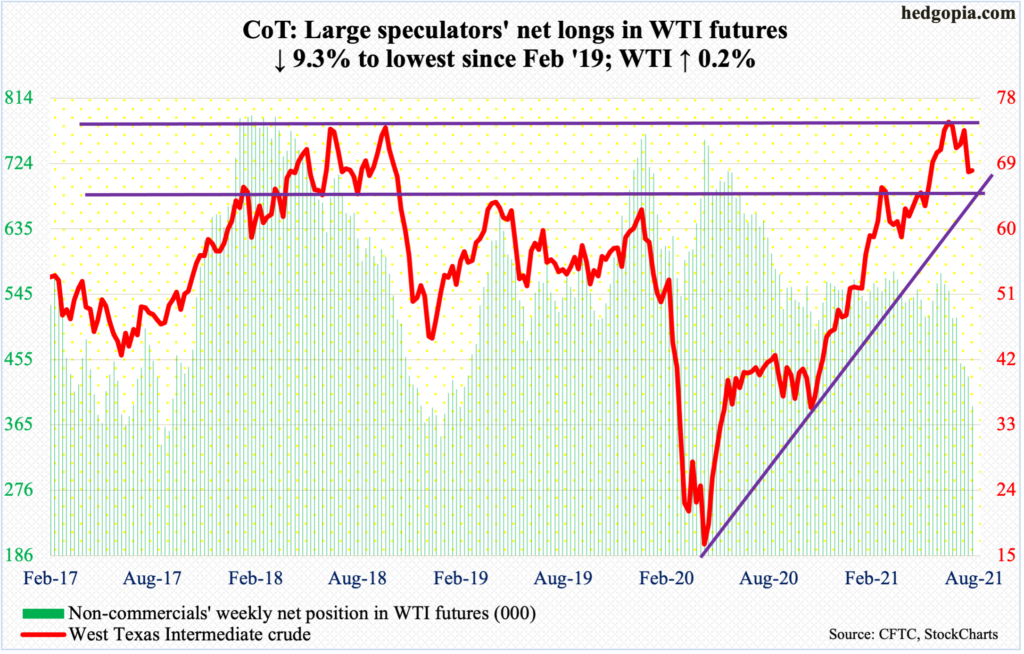
Support at $66-$67 was once again breached on Monday but only to attract bids just above $65, successfully testing the low from July 20.
Longer-term, WTI ($68.44/barrel) has tons of room to head lower. Near term, so long as $66-$67, or this week’s low, is not breached, bulls have hope. The 50-day moving average lies at $71.45. Above, around $72.50 lies resistance from a falling trend line from July 6 when the crude peaked at $76.98. In October 2018, WTI retreated sharply after ticking $76.90. Thus, last month’s high has the potential to be an important top.
In the meantime, US crude production in the week to August 6 increased 100,000 barrels per day to 11.3 million b/d. Distillate stocks also rose, up 1.8 million barrels to 140.5 million barrels. Stocks of crude and gasoline, however, fell – down 448,000 barrels and 1.4 million barrels to 438.8 million barrels and 227.5 million barrels respectively. Crude imports fell as well, down 36,000 b/d to 6.4 mb/d. Refinery utilization rose five-tenths of a percentage point to 91.8 percent.
E-mini S&P 500: Currently net long 23.1k, down 18.2k.
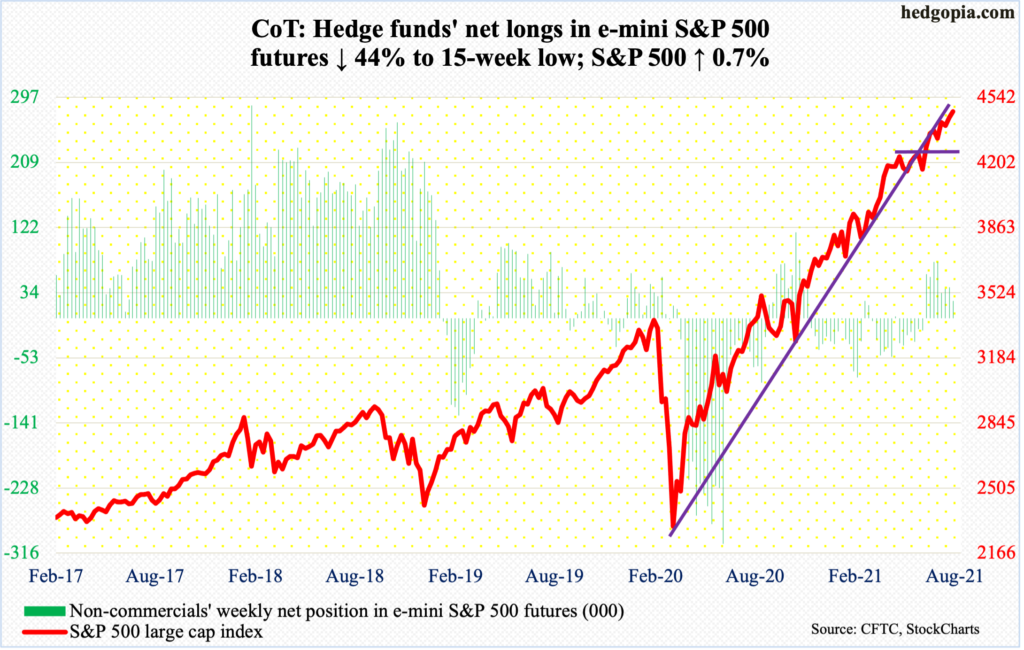
Bids showed up this week around last week’s breakout point at 4420s. The breakout was rather lackluster, as was this week’s action. But price is the final arbiter, as they say – until it is not. When it was all said and done, the S&P 500 (4468) was up 0.7 percent for the week.
In the week to Wednesday, US-based equity funds attracted $4.2 billion (courtesy of Lipper), even as SPY (SPDR S&P 500 ETF), VOO (Vanguard S&P 500 ETF) and IVV (iShares Core S&P 500 ETF) took in $818 million (courtesy of ETF.com). This marked a third week of inflows in a row, with US-based equity funds having gained $10.7 billion and the three ETFs $1.5 billion in the prior two weeks.
In the event of downward pressure, 4420s is the one to watch for now. Worse, the 50-day is three percent away. Going back to May last year, the average has been saved nine times, with the latest having taken place on July 19. From that low, the index has rallied 5.5 percent.
Euro: Currently net long 33.9k, down 4.2k.
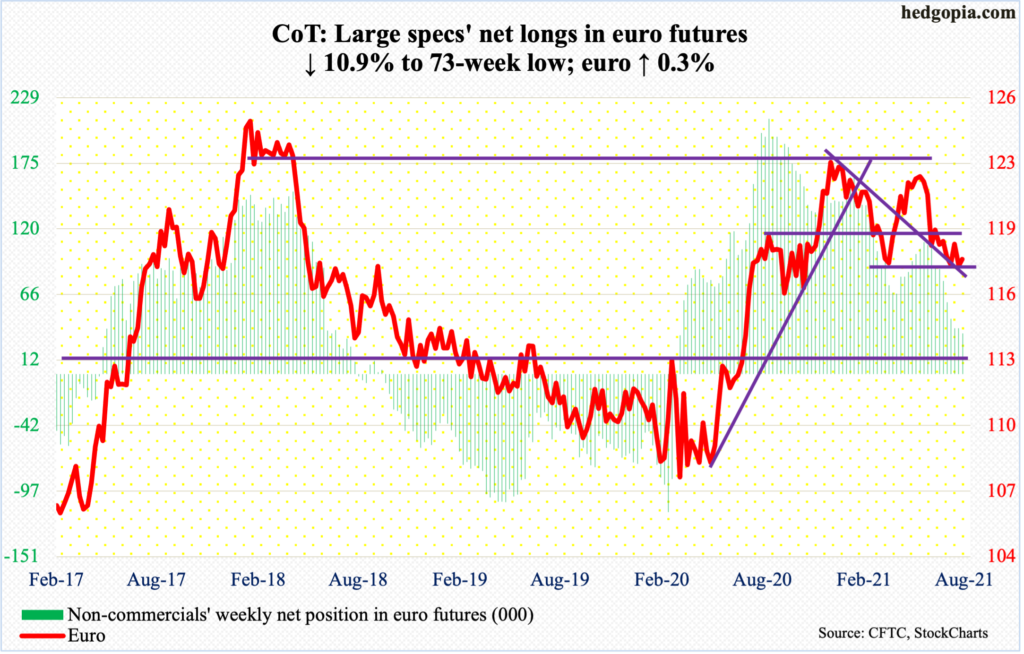
On Tuesday, the euro ended up undercutting the March 30 low of $1.1712 by $0.02. This is an important level to watch. A breach opens the door toward $1.16 first and then $1.15.
The currency has been in a downtrend since January when it ticked $1.2345, followed by $1.2268 in May. A falling trend line thereof extends to $1.22. That is a long way from here.
Euro bulls first need to clear major resistance at $1.19-$1.20, which has proven to be an important level going back 18 years. Most recently, the euro tagged $1.1901 intraday on August 4 before sharply reversing lower.
Should a rally ensue near term, $1.18 is where bulls and bears are likely to butt heads – which is where the euro ($1.1797) closed the week at. On the daily, there is room to rally.
Gold: Currently net long 168.4k, down 27.9k.
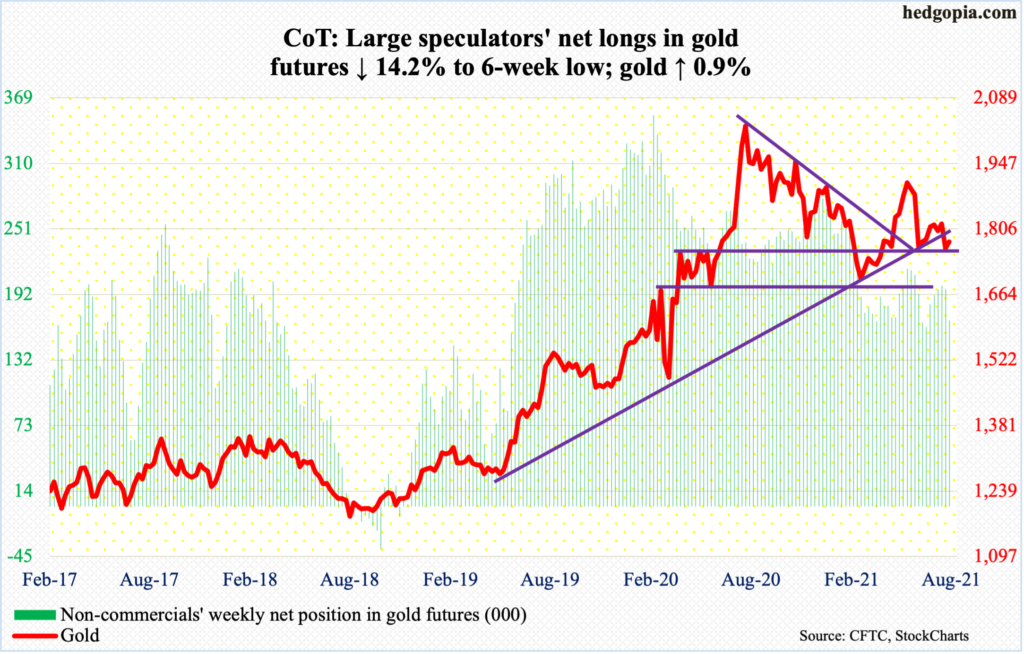
On Monday, gold sliced through major support at $1,760s-$1,770s to successfully go test $1,670s, closing the session at $1,727, thereby leaving behind a long lower shadow – potentially a bullish hammer. Support at $1,670s goes back to March last year.
Gold has been under pressure for a year now. On August 7 last year, it reached an all-time high of $2,089.20. A couple of weeks before that, it recaptured the prior high of $1,923.70 from September 2011. But gold bugs could not keep up the momentum.
Several times in the first half of June (this year), they were denied at $1,920s. Hence the significance of this week’s defense of $1,670s. A decisive breach exposes the yellow metal to $1,560s and then $1,450s.
On Friday, gold ($1,778.20/ounce) reclaimed $1,760s-$1,770s. Right now, the bias is decidedly up (more on this here). Nearest resistance lies at $1,800, followed by the 50- and 200-day ($1,808 and $1,817 respectively). A falling trend line from last August’s high extends to $1,875.
Nasdaq 100 index (mini): Currently net short 13.3k, up 11.8k.
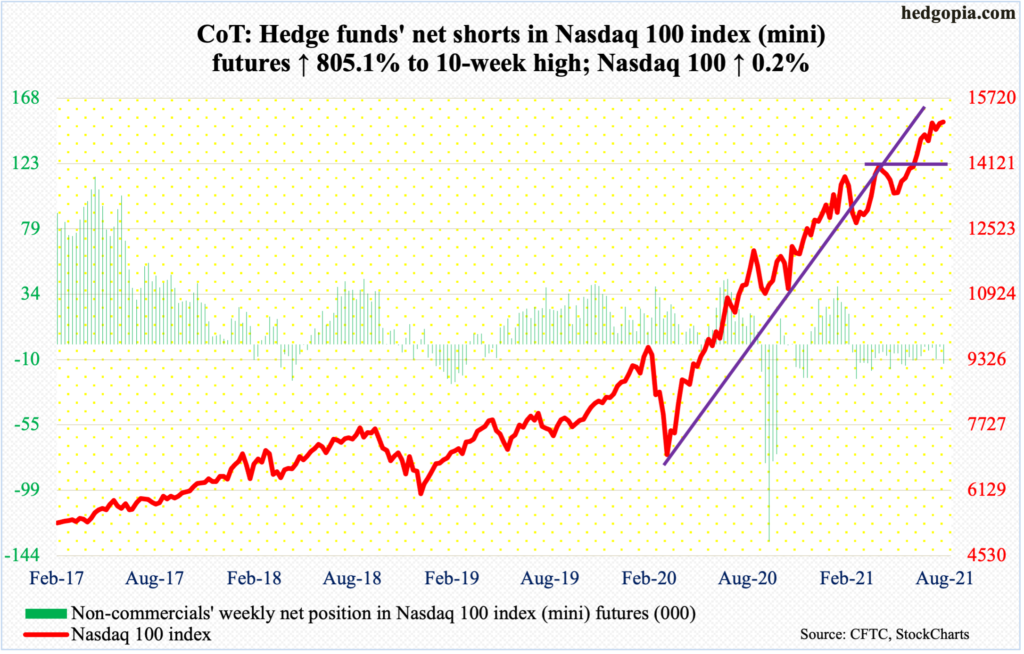
The Nasdaq 100 continues to go sideways around 15100s. This has gone on for 16 sessions now. Four weeks ago, the tech-heavy index charted out a weekly bullish engulfing candle. Bulls since have kept on hammering on that resistance with higher lows, albeit with not much vigor.
Last week saw a new high of 15194, but also formed a weekly spinning top. This week, the index inched up 0.2 percent to close at 15137, forming a weekly dragonfly doji.
A breakout is bound to add to gains. But in a seasonally tough period, it is anyone’s guess if momentum would last much longer.
Down below, there is support at 14550s.
Russell 2000 mini-index: Currently net short 57.5k, down 1.7k.
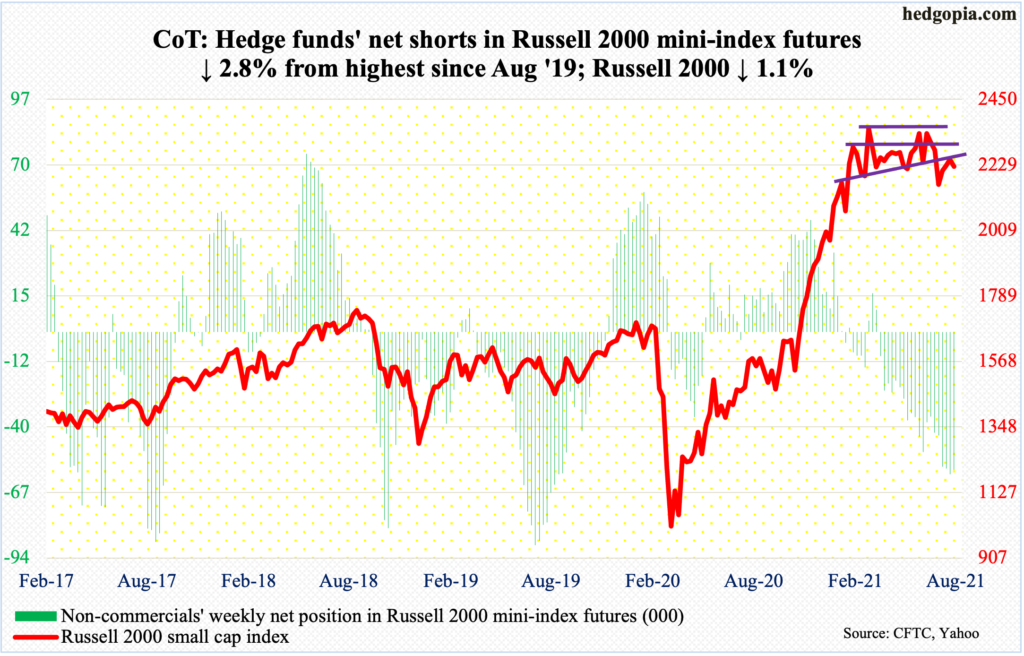
The Russell 2000 (2223) continued to go sideways just under the 50-day (2260). On Thursday, the small cap index managed to post an intraday high of 2251, and that was it. For the week, it dropped 1.1 percent.
For five months now, the Russell 2000 has gone back and forth within a rectangle between 2350s and 2080s. The lower end was just about tested on July 19. The subsequent rally has not even managed to test 2280s, let alone the upper bound of the range (more on this here).
The daily is overbought.
US Dollar Index: Currently net long 19.3k, up 445.

On Wednesday, the US dollar index (92.51) surpassed the July 21 high of 93.20 by a penny but bulls were unable to hang on to it. July’s high came just outside the daily upper Bollinger band; in the subsequent couple of weeks back then, the index dropped to test the lower band. This time, too, Wednesday’s high was posted just below the upper band. In the sessions ahead, the lower bound, at 91.85, likely gets tested. This also approximates support just north of 92.
VIX: Currently net short 74.3k, up 17.7k.
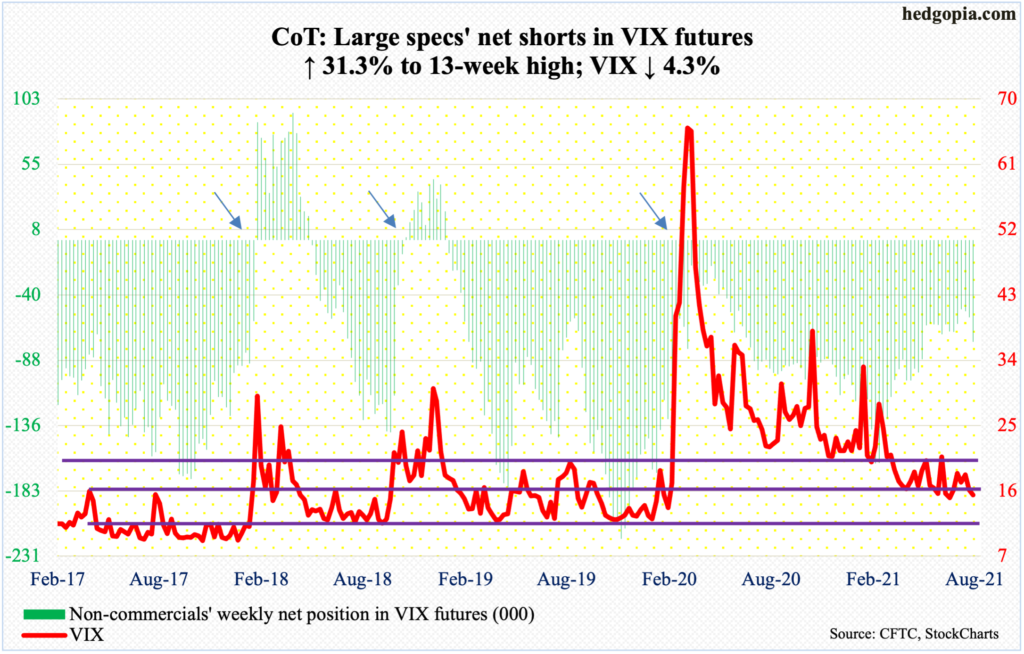
After last Thursday’s breach of a month-and-a-half rising trend line, VIX came under more pressure this week, ticking 15.19 intraday Friday, closing at 15.45.
On the daily, volatility is already very suppressed. But in the right circumstances for volatility bears, a 14 handle is possible. On June 29, VIX tagged 14.10 to successfully test a rising trend line from November 2017 when it dropped to a record low 8.56. That trend line gets tested around 14.40ish, and should hold.
Thanks for reading!
