
Following futures positions of non-commercials are as of April 19, 2022.
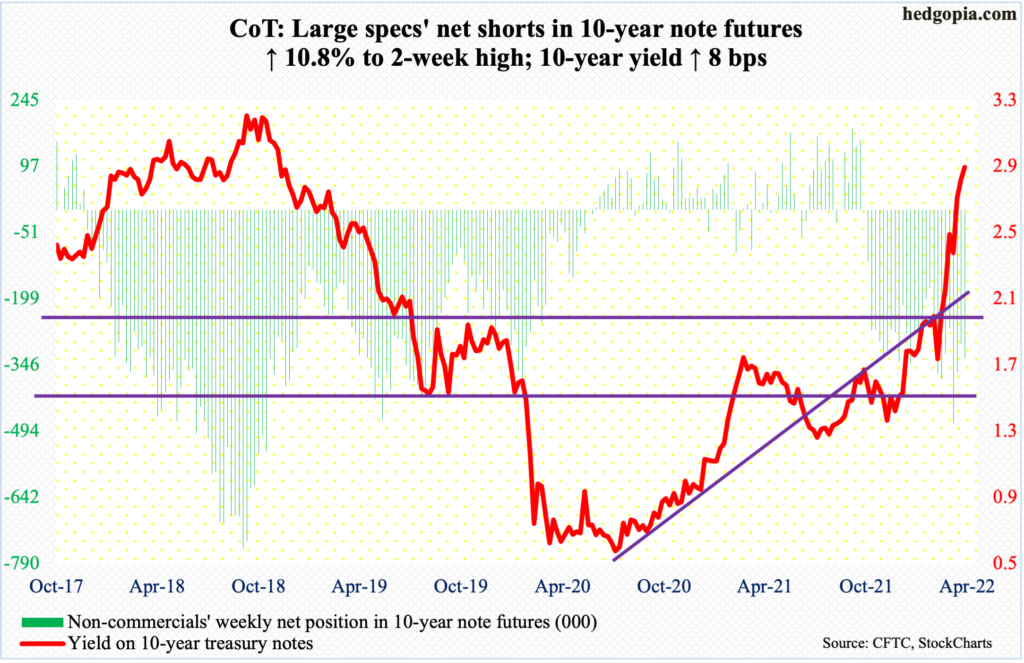
10-year note: Currently net short 332.3k, up 32.4k.
A 50-basis-point increase in the fed funds rate is pretty much sealed in the May 3-4 meeting. Jerome Powell, Federal Reserve chair, on Thursday said the central bank is determined to bring inflation down and that aggressive rate hikes are possible as soon as next month. Last month, the benchmark rates were raised by 25 basis points to a range of 25 basis points to 50 basis points.
As far as markets’ expectations were concerned, Powell was not saying anything earth-shattering. In the futures market, traders had already priced in a 50-basis-point move in the upcoming meeting. This will now be followed by a 75-basis-point increase in the June 14-15 meeting and another 50 in July (26-27) – if we are to go by how traders are positioning themselves in futures.
The Fed is looking to front-load. Markets are going along, expecting three more 25-basis-point hikes to end 2022 at 275-300 basis points and at 350-375 by July next year. This is of course a roadmap as of now and subject to change given how inflation, growth and the stock market evolve.
If the fed funds rate indeed gets to a range of 3.5 percent to 3.75 percent by July next year, a significant deceleration in economic growth is only a matter of time, raising recession odds meaningfully.
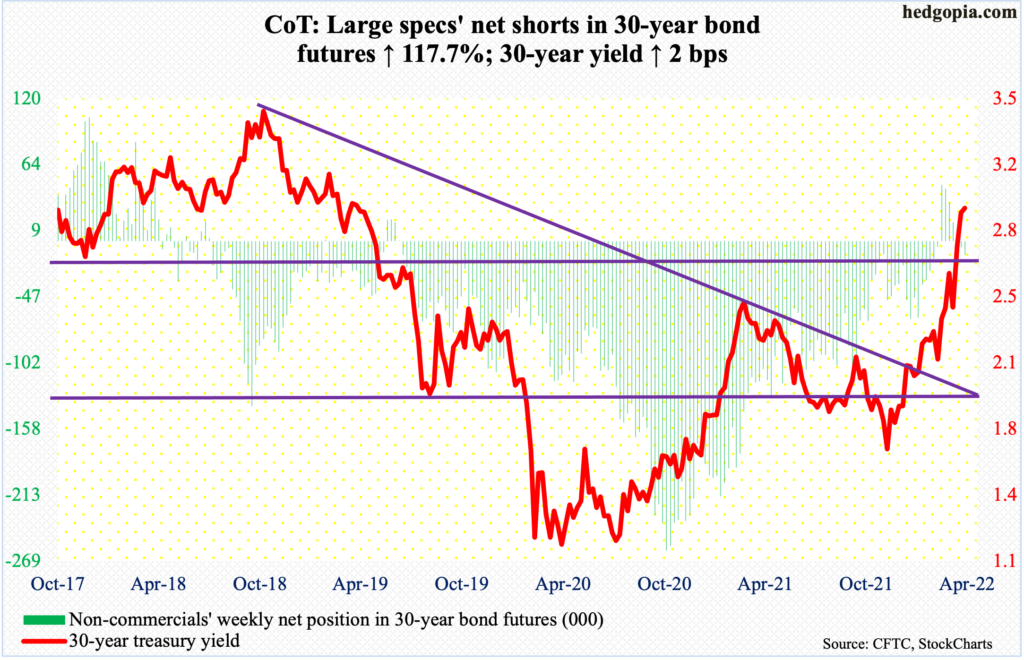
30-year bond: Currently net short 11.2k, up 6.1k.
Major economic releases for next week are as follows.
Durable goods orders (March), the S&P Case-Shiller home price index (February) and new home sales (March) are scheduled for Tuesday.
Orders for non-defense capital goods ex-aircraft – proxy for business capex plans – dropped 0.2 percent month-over-month in February to a seasonally adjusted annual rate of $80.1 billion. This was the first m/m decline in a year. January’s $80.3 billion was a record.
Nationally, US home prices increased 19.2 percent year-over-year in January. Last August, prices rose at a record 20 percent.
Sales of new homes in February fell two percent m/m to 772,000 units. Sales have weakened after hitting a 14-year high 993,000 in January last year.
Thursday brings GDP (1Q22, first estimate). In 4Q21, real GDP jumped at an annual rate of 6.9 percent. The Atlanta Fed’s GDPNow model forecasts growth of 1.3 percent in the opening quarter of this year.
On Friday, the employment cost index (1Q22), personal income/spending (March) and the University of Michigan’s consumer sentiment index (April, final) will be published.
In 4Q21, private-sector compensation grew 4.4 percent y/y. As recently as 3Q20, it was increasing at a rate of 2.4 percent.
In the 12 months to February, headline and core PCE (personal consumption expenditures) jumped 6.4 percent and 5.4 percent respectively. This was the fastest rate of inflation since January 1982 and April 1983, in that order.
Preliminarily in April, consumer sentiment grew 6.3 points m/m to 65.7. March’s 59.4 was the lowest since August 2011.
WTI crude oil: Currently net long 325.3k, down 7.5k.
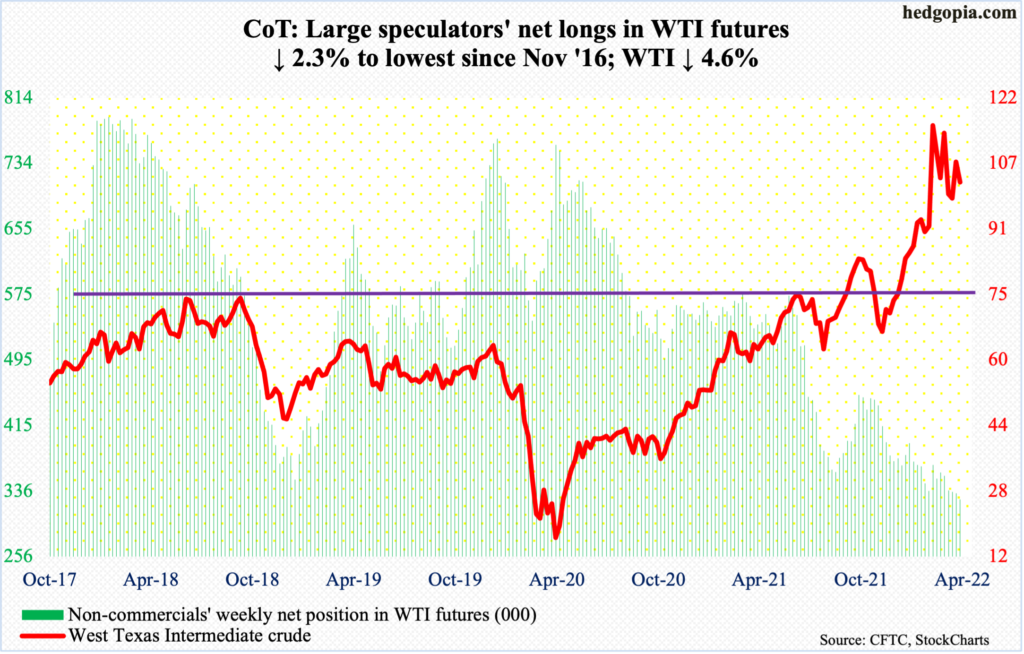
WTI ($102.07/barrel) has straddled the 50-day since late March. This week, it closed above the average in the first four sessions, with a slight breach on Friday.
Last week, the crude successfully tested the lower support – at $94-$95 – of a descending triangle it had been in since it peaked at $130.50 on March 7.
A decisive breach of the triangle can put WTI under continued pressure. There is straight-line support at $85, followed by the 200-day at $82.35.
In the meantime, US crude production in the week to April 15 increased 100,000 barrels per day to 11.9 million b/d. Crude imports fell 158,000 b/d to 5.8 mb/d. Stocks of crude, gasoline and distillates all dropped – respectively down eight million barrels, 761,000 barrels and 2.7 million barrels to 413.7 million barrels, 232.4 million barrels and 108.7 million barrels. Refinery utilization rose one percentage point to 91 percent.
E-mini S&P 500: Currently net long 68.4k, up 5.5k.
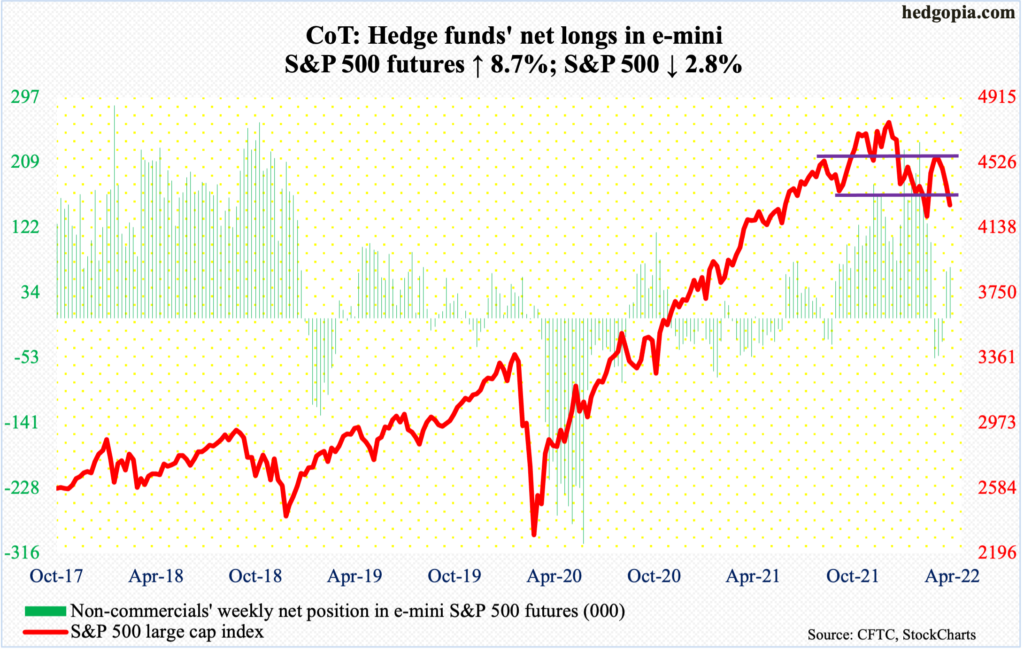
Bulls had to be very frustrated how Thursday’s session evolved. Already up 1.5 percent in the first three sessions, overnight futures were strong, and the regular session opened strong as well. Within the first 20 minutes, the S&P 500 was up 1.2 percent, but only to end down 1.5 percent by the time the session was over. The reversal came just above the 200-day (4497), with a session high of 4513. This was followed by Friday’s 2.8-percent plunge.
There was dual resistance at 4550 and this was not even tested in earnest on Thursday. The large cap index peaked on January 4 at 4819 and bottomed on February 24 at 4115, for a drop of 14.6 percent. A 61.8-percent Fibonacci retracement of this decline lies at 4550, which coincides with a falling trend line from the January high (more on this here).
Outflows picked up momentum. In the week to Wednesday, $14.7 billion came out of US equity funds (courtesy of Lipper). In the same week, SPY (SPDR S&P 500 ETF), VOO (Vanguard S&P 500 ETF) and IVV (iShares Core S&P 500 ETF) lost $23.4 billion (courtesy of ETF.com). This followed redemptions of $9.6 billion and $4.9 billion, in that order.
Newsletter writers continue to remain cautious. In the week to Tuesday, Investors Intelligence bulls dropped 3.7 percentage points week-over-week to 32.1 percent. This was the 14th straight week the metric went sideways in the 30s or lower, with one week at 29.9 percent (chart here).
This will get unwound sooner or later – either from the current level or even lower. Longs had a big opportunity on Thursday to take out the 200-day but were unable to withstand the selling pressure.
In the first half last month, the index (4272) began to rally from 4150s.
Euro: Currently net long 31.3k, down 7.8k.
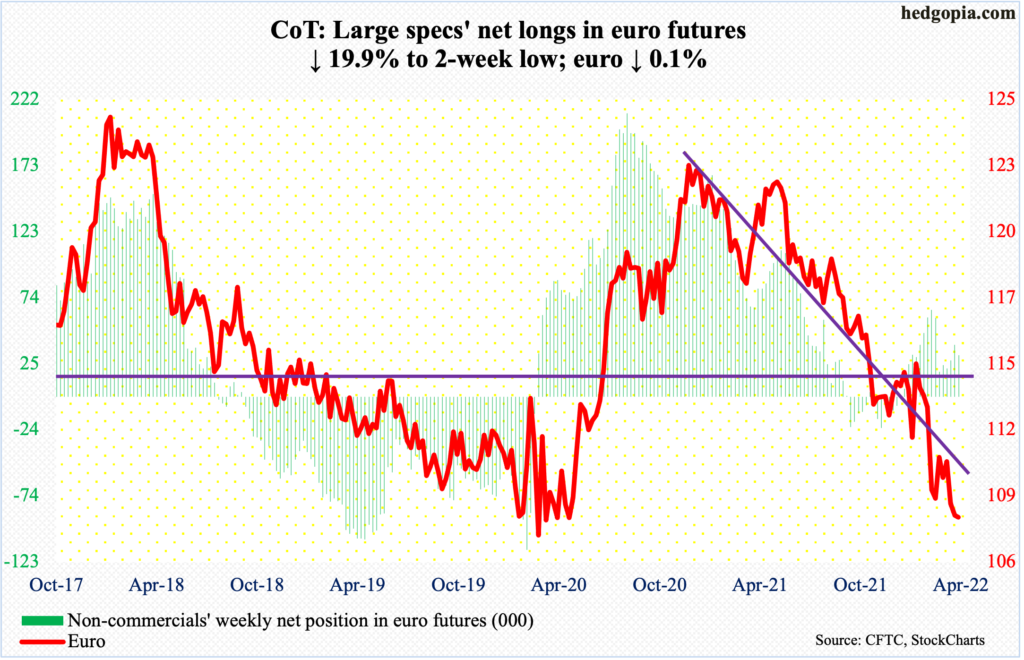
At last Friday’s low of $1.0757, the euro tested a rising trend line from January 2017. This was also a test – just about – of crucial straight-line support at $1.05-$1.06. It has held – thus far.
The currency ($1.0822) has been in a downtrend since it peaked at $1.2345 in January last year. Momentum remains down. That said, euro bulls have an opportunity here to at least try to put their foot down.
Immediate resistance rests at $1.0840s, which was tested in the last three sessions. Reclaiming of the level will open the door toward $1.12.
Gold: Currently net long 239.8k, down 14.5k.
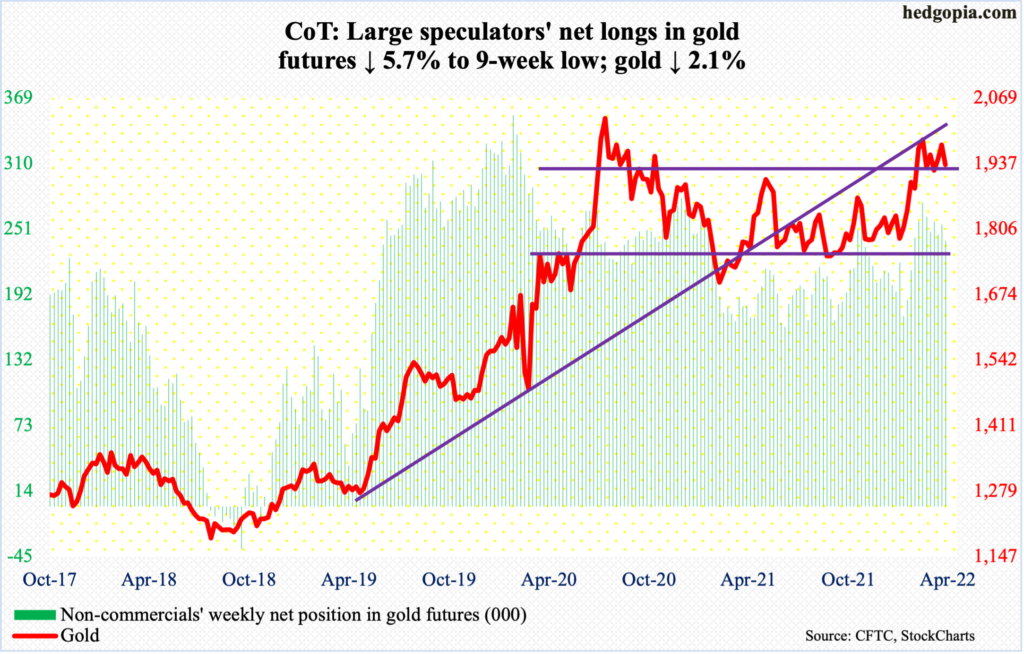
Gold rallied as high as $2,003 on Monday before coming under pressure. For the week, it dropped 2.1 percent to $1,934/ounce.
In September 2011, the metal retreated after tagging $1,924. It then bottomed in December 2015 at $1,045. That high was not surpassed until July 2020, followed by a new all-time high of $2,089 a month later.
Early last month, $1,920s was recaptured; by the 8th, bulls were less than $11 short of the August 2020 high, before sellers showed up in numbers. As things stand, as long as $1,920s remains intact, gold bugs deserve the benefit of the doubt.
Nasdaq 100 index (mini): Currently net long 8.1k, down 4.8k.
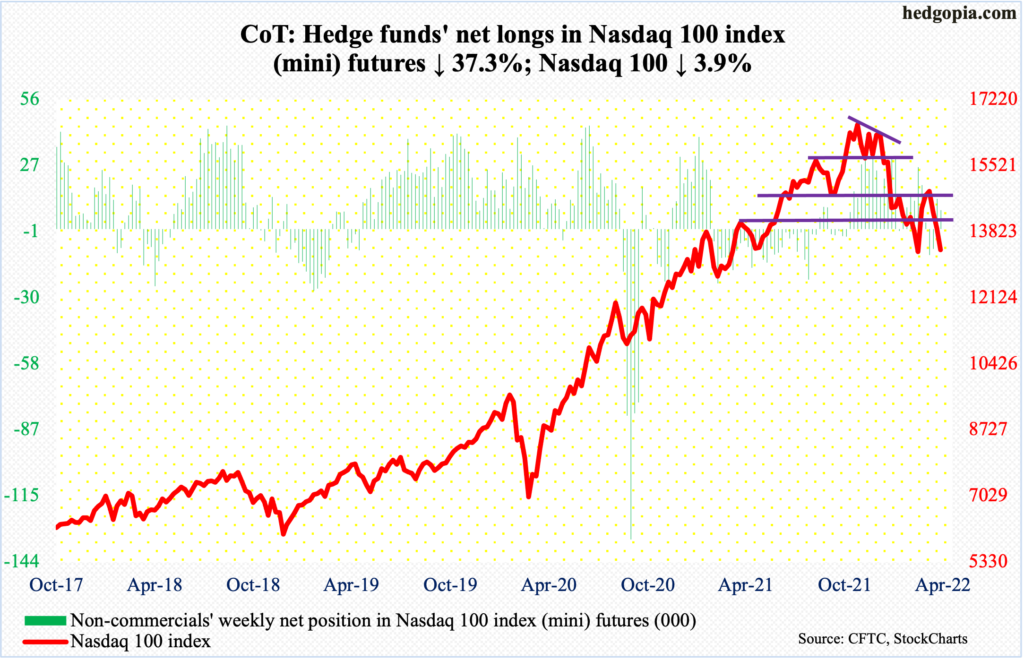
The Nasdaq 100 has remained under the 50-day the last couple of weeks. Attempts to reclaim the average (14187) was vigorously denied on Thursday, when the tech-heavy index tagged 14277 but only to close the session at 13720, down two percent. For the week, the index (13357) was down 3.9 percent.
Next week, several major tech outfits will report their March quarter – Microsoft (MSFT) and Google owner Alphabet (GOOG) on Tuesday, and Apple (AAPL), Amazon (AMZN) and Intel (INTC) on Thursday. Ahead of this, MSFT, AMZN, GOOG and INTC are below both the 50- and 200-day, while AAPL is below the 50 but above the 200.
If their results are perceived favorably, the Nasdaq 100 – a market cap-weighted index – can get a nice tailwind. It is oversold on the daily.
Russell 2000 mini-index: Currently net short 40.3k, down 2.9k.
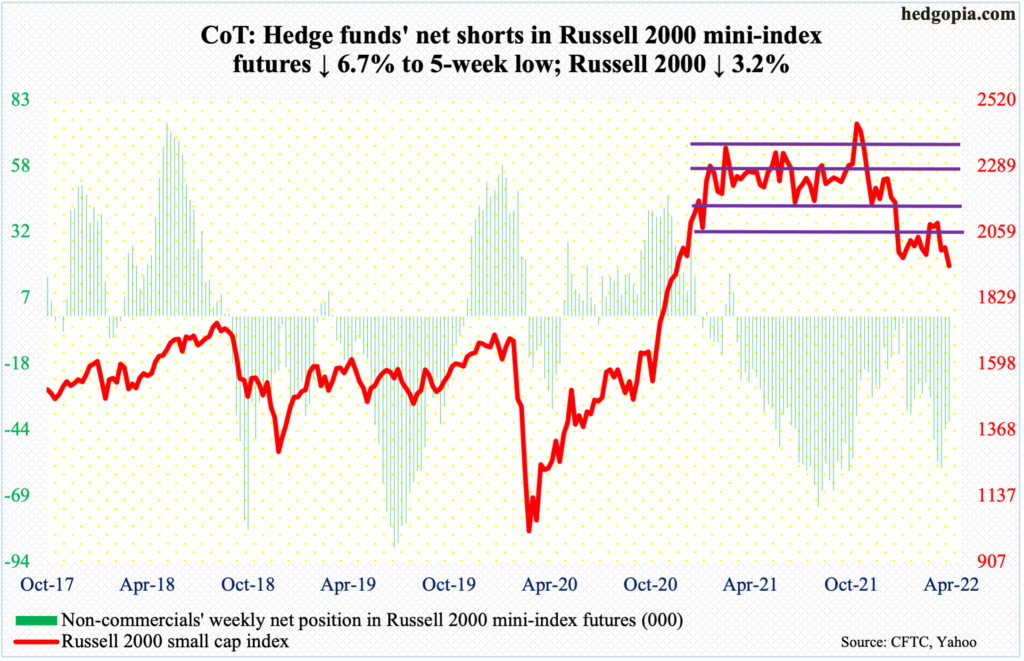
The Russell 2000 (1941) has been rangebound between 2080s and 1900 the past three months. This preceded a rectangle breakdown mid-January.
From March last year through January, the small cap index went back and forth between 2350s and 2080s, and between 2280s and 2150s within this box. On Nov 3, it broke out but was quickly followed by a failed retest on the 19th that month. Then came the breakdown and a double bottom at/near 1900 in late January and late February.
A backtest of the broken box took place several times during late March and early April – unsuccessfully. On both Wednesday and Thursday this week, 2050s drew sellers. The bottom line is that the index remains sandwiched within a 200-point range – 1900 and 2100. Whichever way it breaks, momentum likely follows.
US Dollar Index: Currently net long 32.6k, up 2.9k.
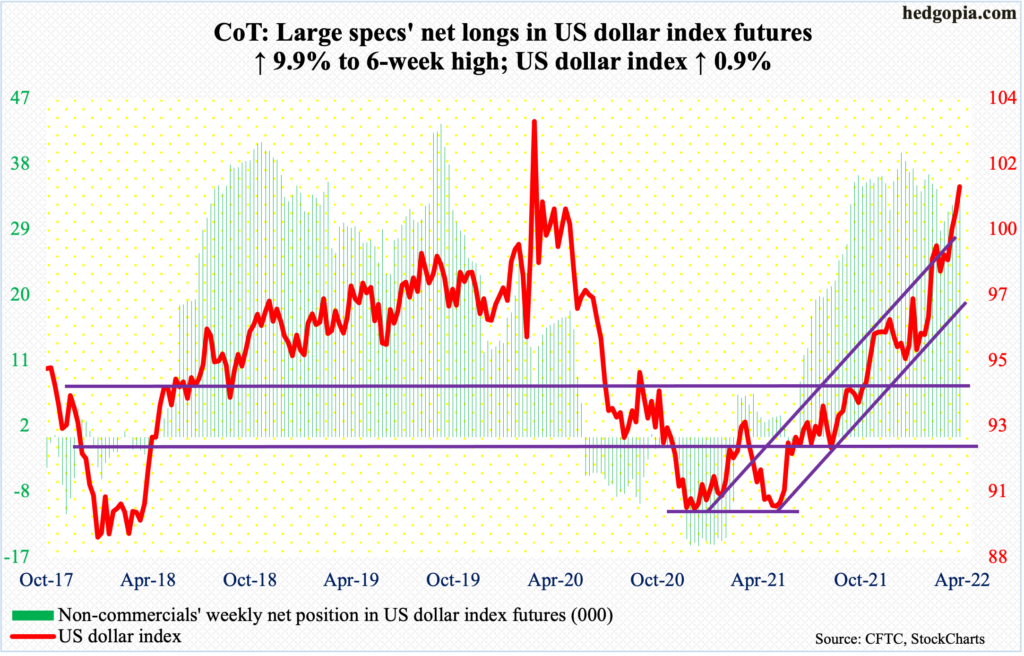
Yet another weekly high on the US dollar index, which ticked 101.34 on Friday, closing at 101.21. This was the highest intraday print since March 2020, when the index rose as high as 103.96 before coming undone.
In January last year, it bottomed at 89.17, hence has come a long way.
The action the last couple of weeks follows a mini-breakout on the 6th at 99.40s. The US dollar index has benefited from a sustained rise in interest rates. Resistance at 100 goes back years – particularly the past seven years. A decisive breakout will be a huge development.
Should it come under pressure near term, breakout retest at 99.40s will be important, followed by an even more important test at 97.
VIX: Currently net short 75.9k, down 5.4k.
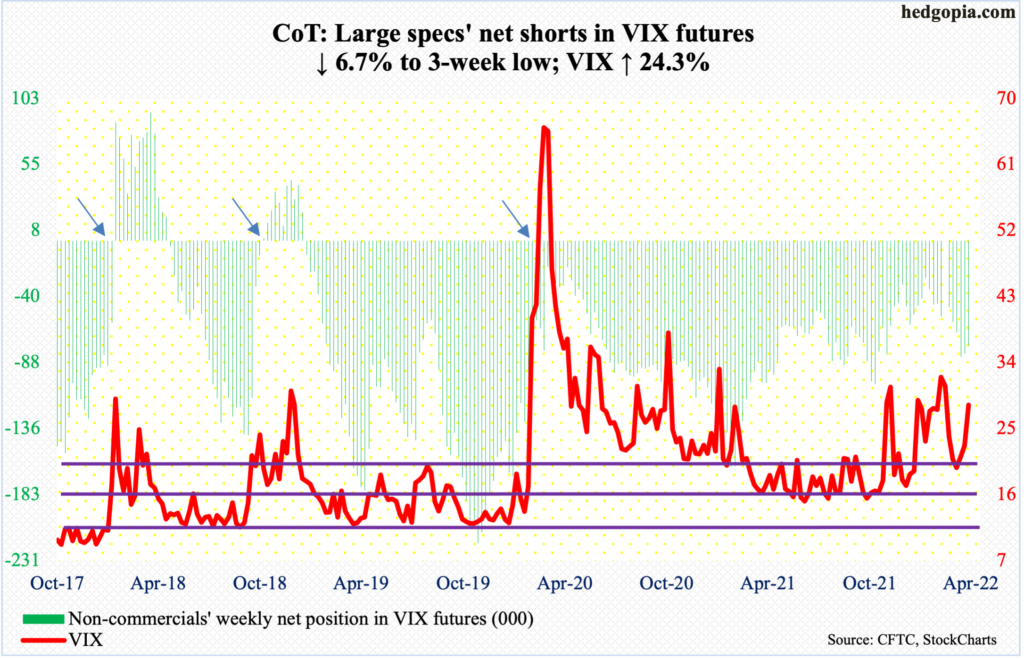
VIX went sub-20 on both Wednesday and Thursday. On Thursday in particular, it tagged 19.81 intraday before reversing sharply higher to close at 22.68, above the 200-day at 21.13. Come Friday, it rallied another 5.53 points to 28.21.
The week ended with a bullish hammer and was preceded by a back-to-back weekly spinning top. In early March when the S&P 500 bottomed at 4150s and at 4115 in late February, the volatility index peaked just south of 38.
Thanks for reading!
