
Following futures positions of non-commercials are as of August 23, 2022.
10-year note: Currently net short 381.2k, up 18k.
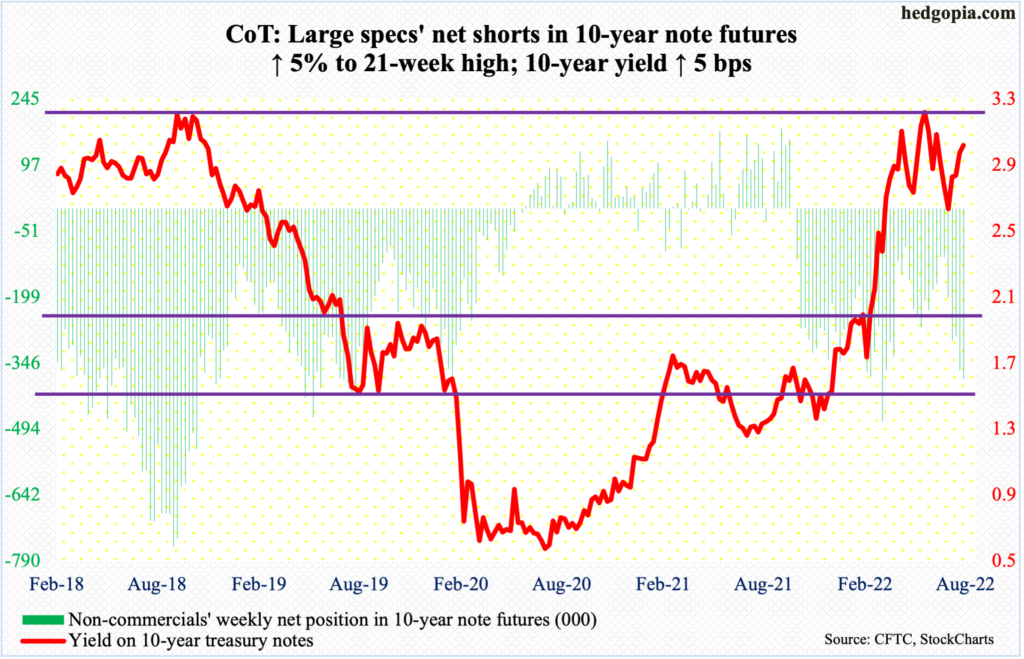
Jerome Powell, Fed chair, in his Jackson Hole speech on Friday, strongly pushed back against any notion of a pivot. Post-July 26-27 meeting, markets began to dial back expectations for rate increases.
After four rate hikes since March, the fed funds rate currently stands at a range of 225 basis points to 250 basis points.
The Fed’s June forecast projected that the benchmark rates would end 2022 between 325 basis points and 350 basis points. But after the July meeting, equity investors in particular began to entertain the idea that the Fed would raise less than forecast.
Come Friday, Powell made it clear that they plan to stay the course and that bringing inflation under control was not a quick fix. There was nothing dovish in his message.
In the futures market, pre-speech, traders were straddled between 50 basis points and 75 basis points for the September 20-21 meeting; post-speech, the odds for a 75-basis-point hike went up to 61 percent, with 2022 expected to end at least between 350 basis points and 375 basis points.
This is a Fed which now looks solely focused on inflation – ready to contract the economy if the need be. Friday’s reaction in equities was a sign markets are finally beginning to heed. Inflation seems headed lower but remains elevated. The Fed likely pauses after hitting four percent, or higher, with the likelihood that the fed funds rate will then go sideways, with no chance of a pivot.
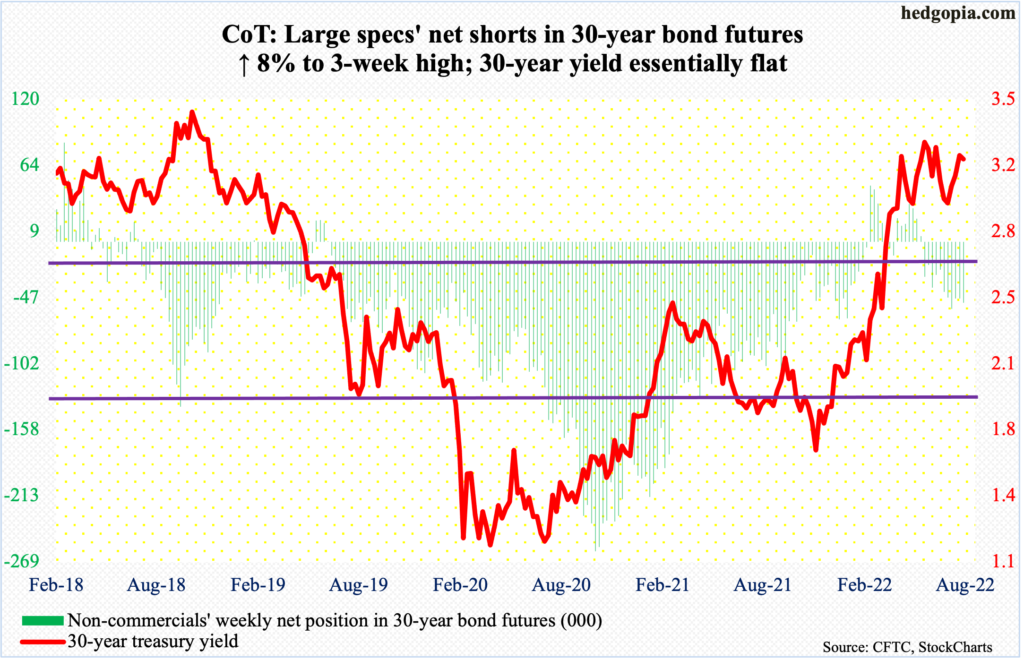
30-year bond: Currently net short 51.1k, up 3.8k.
Major economic releases for this week are as follows.
On Tuesday, the S&P Case-Shiller home price index (June) and job openings (JOLTs, July) are due out.
Nationally, US home prices jumped 19.8 percent year-over-year in May – slightly lower than March’s record 20.6 percent appreciation.
In June, non-farm job openings dropped 605,000 month-over-month to 10.7 million, which was 1.2 million less than the record high 11.9 million in March.
Thursday brings labor productivity (2Q22) and the ISM manufacturing index (August).
Preliminarily, 2Q non-farm output/hour dropped 2.6 percent from a year ago – a record decline post-World War 2. Productivity has decreased in three of the last four quarters.
Manufacturing activity in July edged lower two-tenths of a percentage point m/m to 52.8 percent.
Payrolls (August) and factory orders (July) are on dock for Friday.
July produced 528,000 non-farm jobs, for a monthly average this year of 471,000. Last year, the economy produced 562,000 jobs per month.
July’s preliminary numbers showed orders for non-defense capital goods ex-aircraft – proxy for business capex plans – increased 0.4 percent m/m to a seasonally adjusted annual rate of $74.5 billion. This was a new high.
WTI crude oil: Currently net long 252.2k, up 28.4k.
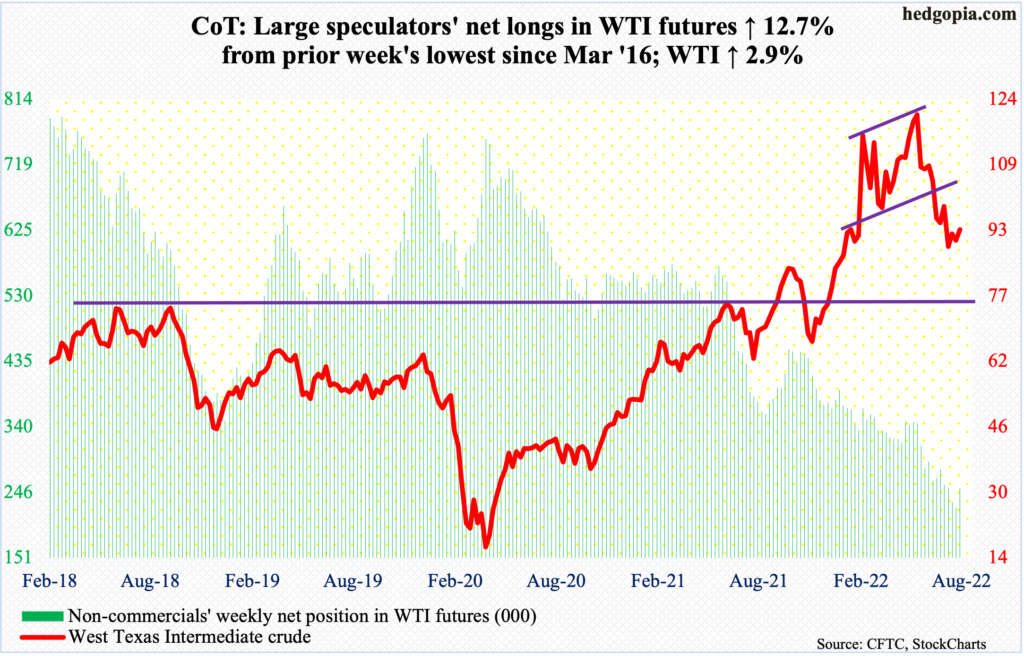
Oil bulls continued to defend lateral support at $85, or just underneath, with Monday’s intraday low of $86.28 attracting bids. By Thursday, WTI ticked $95.76, which, being near the 200-day moving average ($95.24), attracted offers. By the time the week was over, WTI ($93.06/barrel) was up 2.9 percent for the week.
There is room for the weekly to continue higher, but, as things stand, the daily is likely to come in the way, with the latter getting overbought and the daily RSI hovering near the median. Odds favor a test – again – of $85 in the sessions ahead.
In the meantime, per the EIA, US crude production in the week to August 12 fell 100,000 barrels per day to 12 million b/p/d. As did stocks of crude, gasoline and distillates, which respectively decreased 3.3 million barrels, 27,000 barrels and 662,000 barrels to 421.7 million barrels, 215.6 million barrels and 111.6 million barrels. Crude imports, on the other hand, increased 39,000 b/d to 6.2 mb/d. Refinery utilization rose three-tenths of a percentage point to 93.8 percent.
E-mini S&P 500: Currently net short 262.3k, down 25.7k.
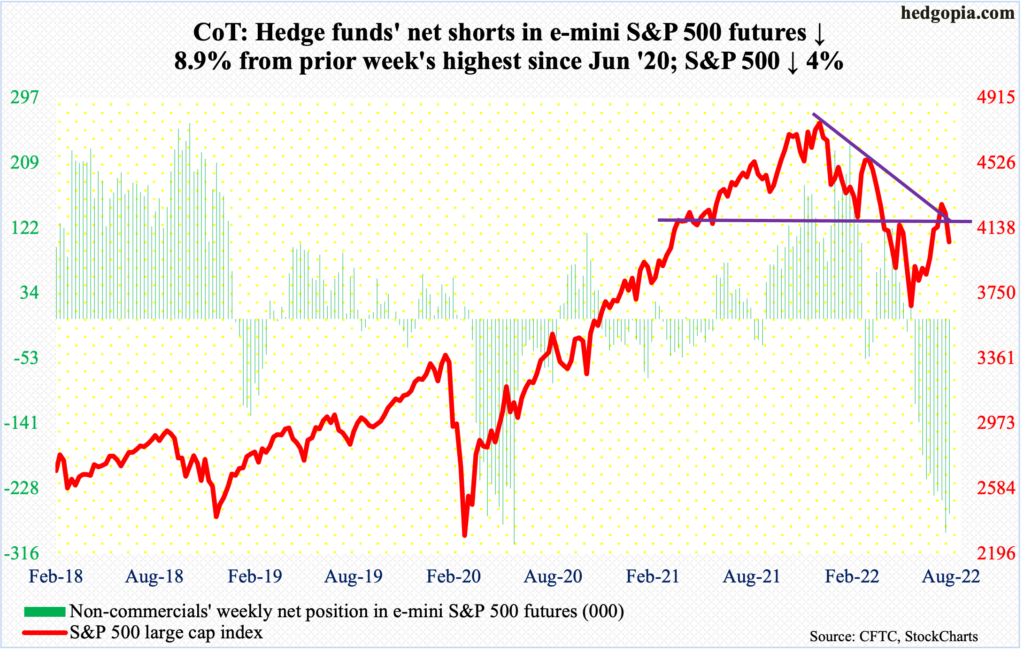
After getting denied last Tuesday at the 200-day as well as a falling trend line from January, the S&P 500 was looking for a reason to sell off. Powell gave one on Friday.
This was a week both bulls and bears could claim victory over – until Friday, that is. At Thursday’s close, the large cap index was only down 0.7 percent for the week, coming on the heels of last week’s 1.2 percent decline. Friday’s 3.4-percent tumble put the week decidedly in bears’ favor.
On the weekly, there is plenty of room to weaken before the overbought condition the index is in gets unwound.
Nearest support includes the 50-day at 3996 and lateral support at 3920s.
Euro: Currently net short 44.1k, up 1.3k.
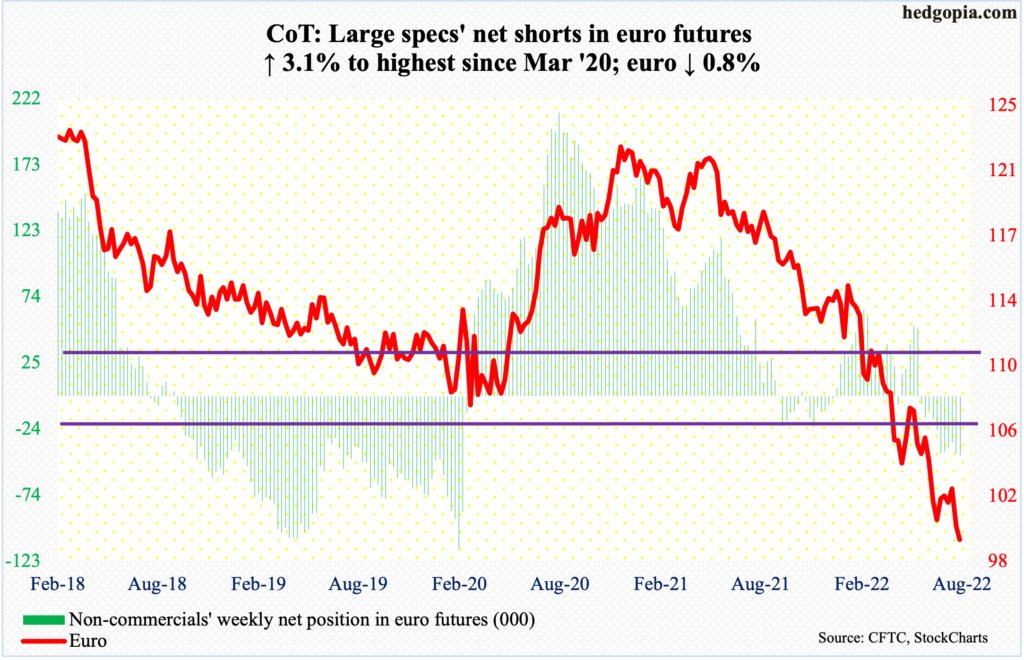
The July 14 low of $0.9952 was breached this week, with Wednesday tagging $0.9910 intraday, but the euro refused to fall apart after that.
In all five sessions this week, the currency ($0.9964) closed sub-parity, but with a sideways look to it. If it rallies here, straight-line resistance $1.0350s, which was lost early July, is a make-or-break for bulls and bears alike.
Gold: Currently net long 125.8k, down 15.3k.
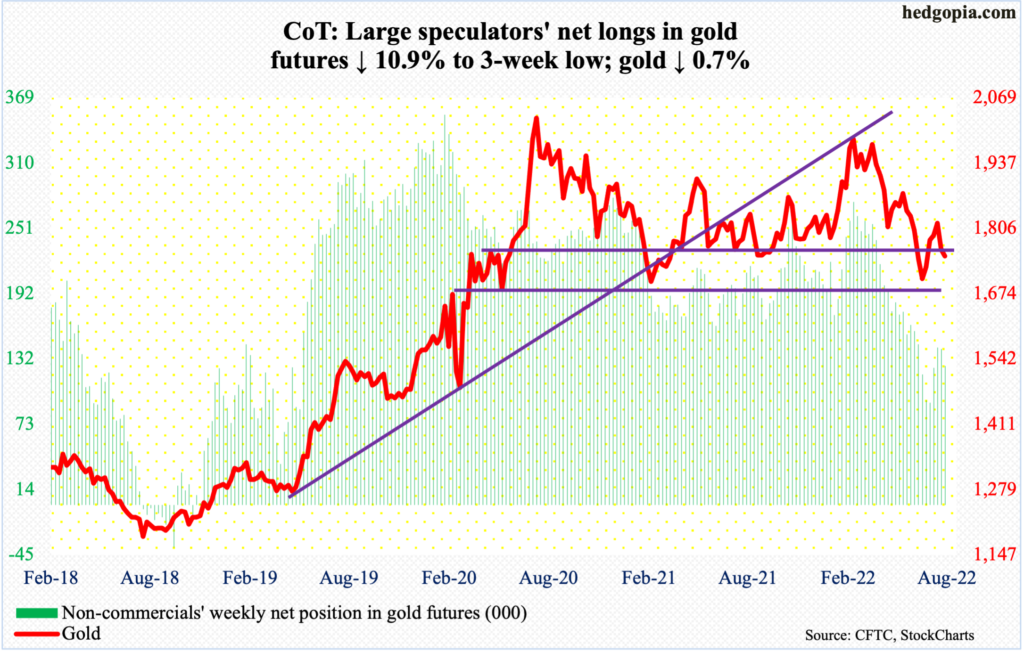
Having closed last week right at $1,760s-$1,770s support, gold this week pushed a little lower before attracting interest; both Monday and Tuesday, the metal found buyers at $1,740s, but Friday’s rejection at the 50-day ($1,773) raises the odds of a move lower in the sessions ahead.
Straight-line support at $1,670s was successfully tested last month, leading to four consecutive weekly gains. Bears are probably eyeing this.
Nasdaq 100 index (mini): Currently net long 38k, up 31.2k.
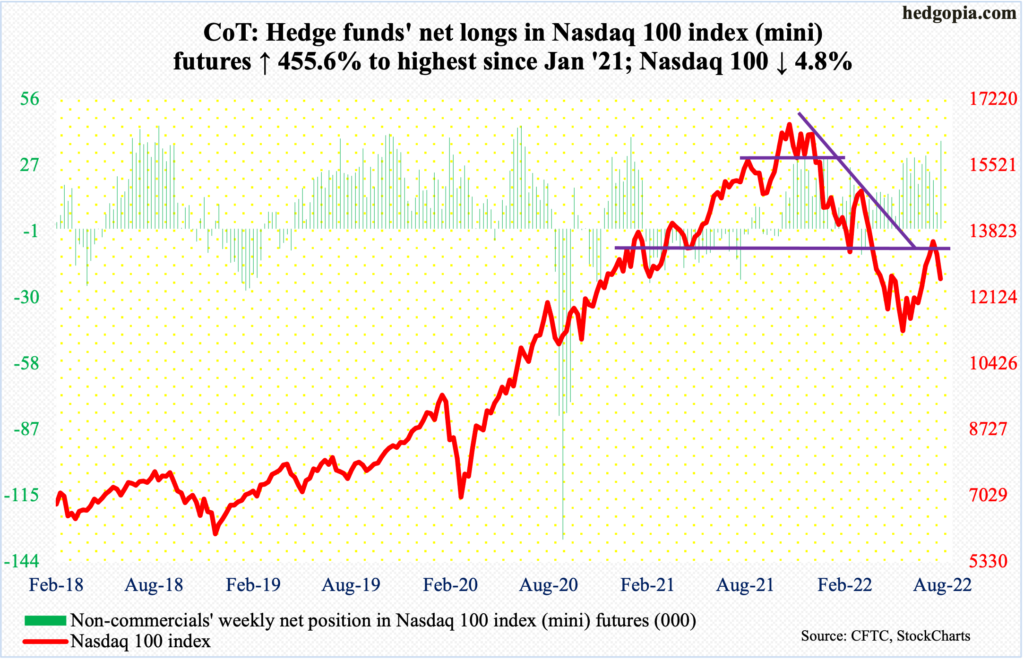
Tech bulls and bears were involved in a real tug of war for control of 13000, which was lost in Monday’s gap-down. This was followed by bulls’ three consecutive attempts to reclaim the level, with Tuesday and Wednesday failing and Thursday succeeding. Come Friday, this was decisively lost as the Nasdaq 100 plunged 4.1 percent.
In the end, the Nasdaq 100 (12605) dropped 4.8 percent for the week. Last week, the index gave back 2.4 percent. The back-to-back weekly drop came after four up weeks in a row. Friday’s action has opened the door for the weekly to begin to unwind the overbought condition it is in.
Russell 2000 mini-index: Currently net short 94.9k, down 21.5k.
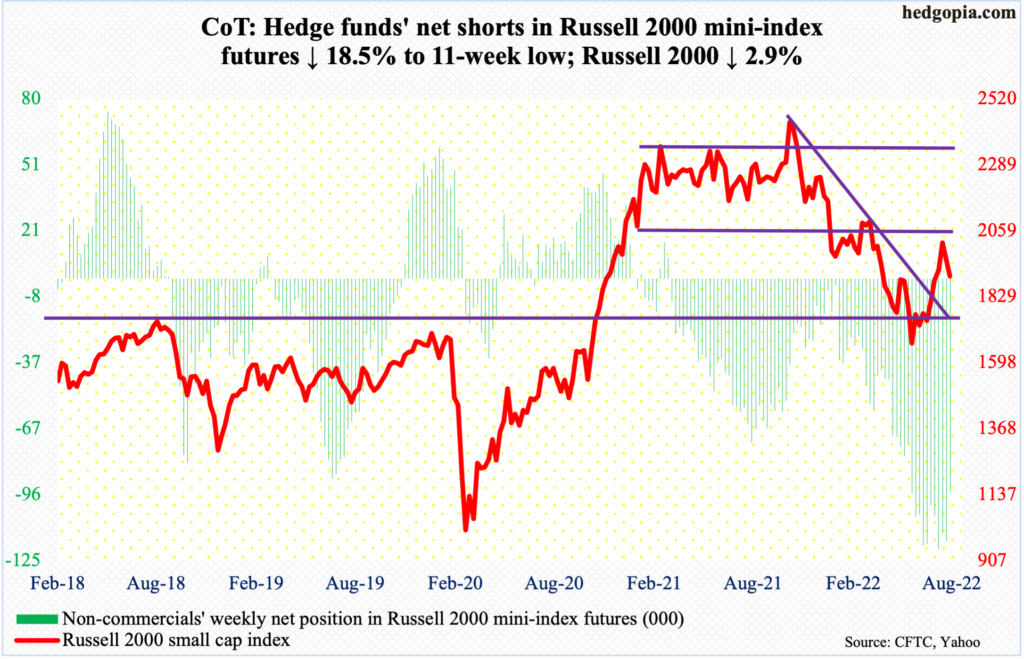
Last Tuesday, the Russell 2000 tagged 2030 before reversing lower, raising the possibility of a move lower toward 1900.
As a reminder, a major breakdown occurred mid-January, losing 2080s; for 10 months, the small cap index went back and forth between 2080s and 2350s, followed by a seesaw action between 2080s and 1900 and between 1900 and 1700 after that; 1700 is where it broke out of in November 2020. The breakout retest was successful.
This week, the Russell 2000 fell 2.9 percent – same as last week – closing right at 1900. Weekly indicators remain grossly overbought – unwinding of which is the path of least resistance.
US Dollar Index: Currently net long 35.1k, down 2.9k.
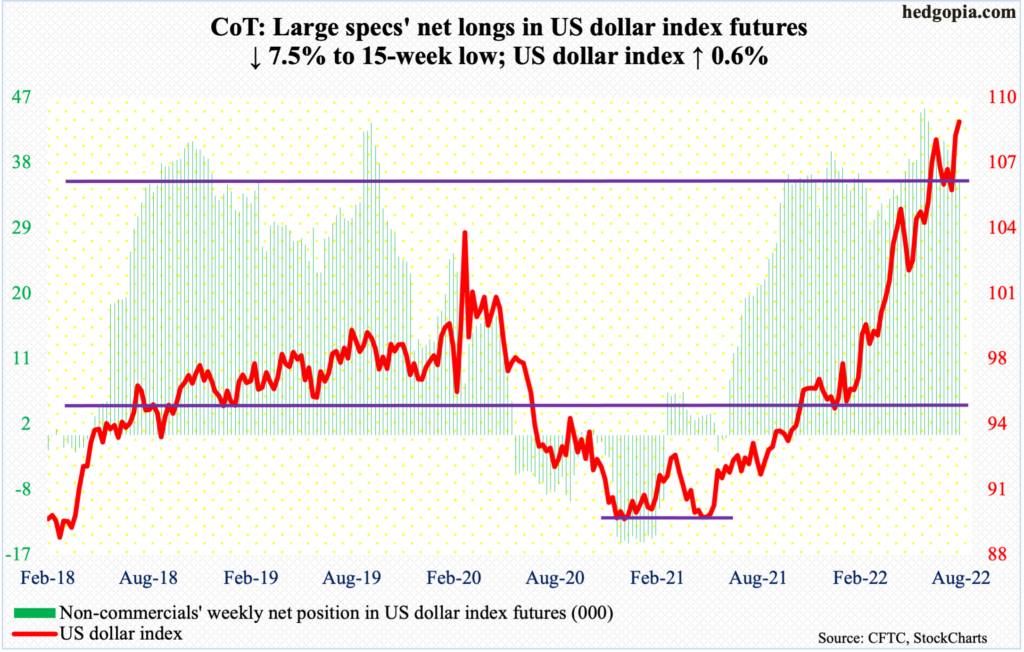
Tuesday’s intraday high of 109.20 surpassed the July 14 high by 0.06 but only to then hit the wall. In the end, the US dollar index (108.75) managed to close up 0.6 percent for the week, leaving behind an upper wick, similar to the weekly candle when the July high was made.
The index bottomed at 89.17 in January last year and at 89.52 in May that year, so has come a long way. Along the way, it broke out of major resistance at 104. So long as the price remains above this level, bulls deserve the benefit of the doubt, but they are also having to deal with waning momentum.
VIX: Currently net short 106.3k, up 4.2k.
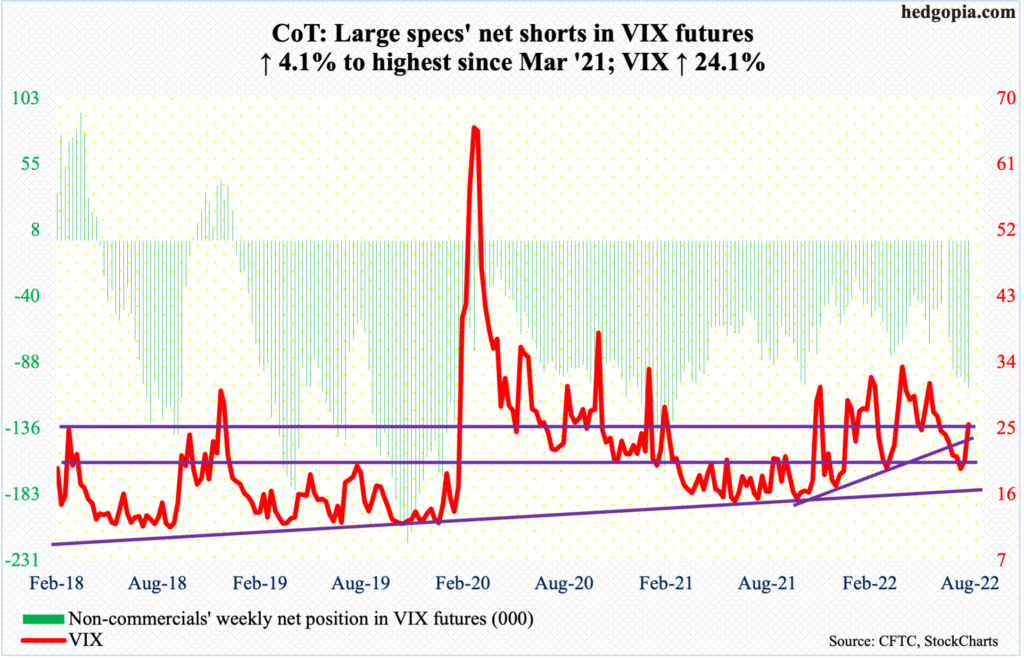
For whatever it is worth, a death cross developed on VIX mid-week, with the 50-day crossing below the 200-day. The volatility index was also rejected strongly at the latter on both Monday and Wednesday. The averages coincide with mid-20s resistance.
That said, VIX closed Thursday above the 10- and 20-day, which lie just above 21. This was an opportunity for volatility bulls – and equity bears – and they took it, rallying VIX 3.78 on Friday to 25.56.
The weekly has lots of room to rally, which likely takes place once mid-20s decisively give way. Should this come to pass, non-commercials are likely to come under pressure to cover their VIX net shorts, which are elevated. If past is prelude, VIX does not peak until these traders either go long or get close to doing that.
Thanks for reading!
