
Following futures positions of non-commercials are as of August 30, 2022.
10-year note: Currently net short 440.1k, up 58.9k.
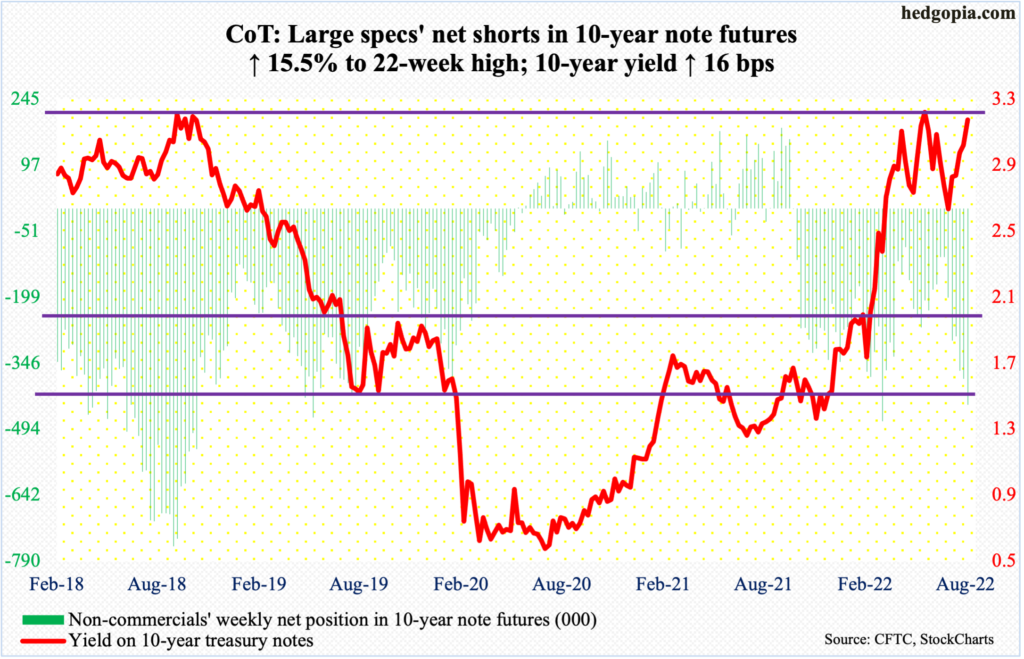
Federal Reserve Chair Jerome Powell’s Jackson Hole speech last Friday seemed to have done the trick. At the symposium, he strongly pushed back against any notion of a pivot. After the July 26-27 FOMC meeting, markets began to revise expectations for rate increases – particularly when there were signs of weakness in the economy in general and in inflation in particular.
Ahead of Friday’s jobs report for August, futures traders expected a 75-basis-point hike this month (21-22), a 50 in November (1-2) and a 25 in December (29-30), assigning probabilities of 74 percent, 68 percent and 67 percent, in that order.
The US economy produced 315,000 non-farm jobs last month, just below the 318,000 consensus. But considering prior revisions, only 208,000 were added, pulling the monthly average in the first eight months of the year lower to 438,000 from 471,000 until July. Last year, the monthly average was 562,000.
In a sign this market continues to latch on to any excuse it gets for a pivot, the rather lukewarm jobs report led futures traders to dial back rate-hike expectations, with odds for a 75 later this month now down to 57 percent, November split between a 25 and 50 and December likely seeing a 25, ending the year between 350 basis points and 375 basis points, down from the expected range of 375 basis points to 400 basis points pre-jobs report.
The bottom line is that markets are far from 100 percent convinced that Powell means it and that he would do whatever it takes to stop inflation from getting out of hand. He is yet to regain the credibility he lost when he doggedly maintained that inflation was transitory.
30-year bond: Currently net short 68.8k, up 17.7k.
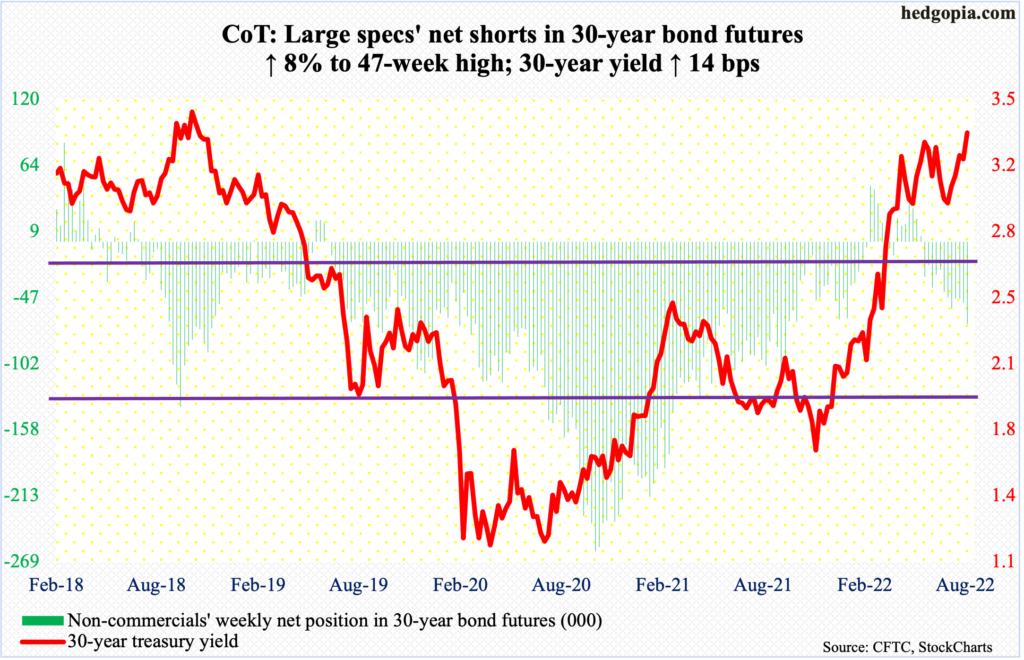
Major economic releases for next week are as follows. Markets are closed Monday for observance of Labor Day.
The ISM services index (August) comes out on Tuesday. In July, services activity rose 1.4 percentage points month-over-month to 56.7 percent – a three-month high.
WTI crude oil: Currently net long 239k, down 13.2k.
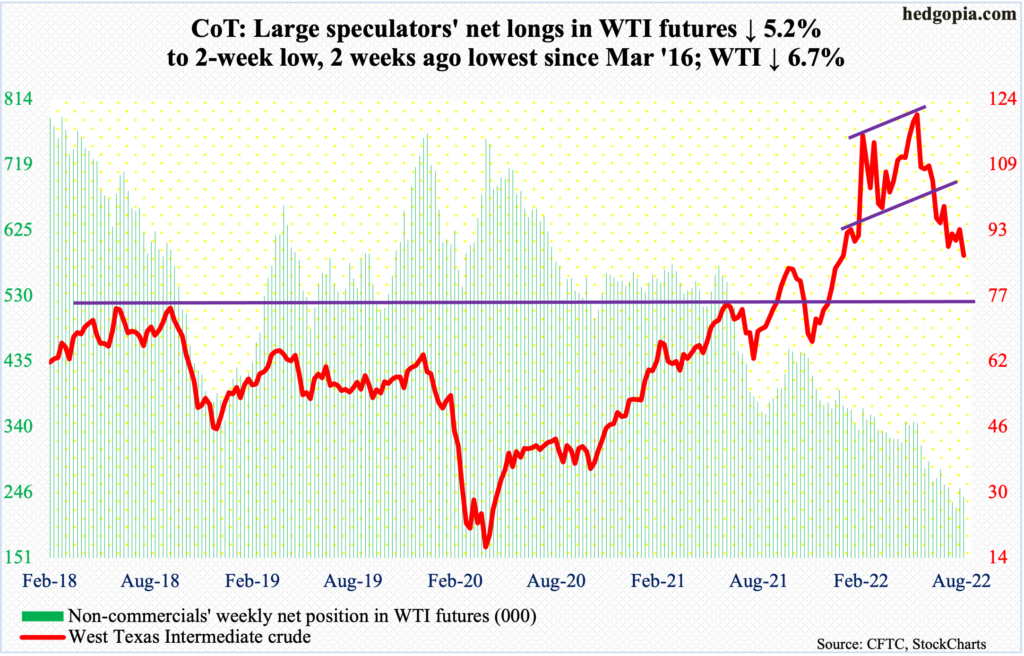
Once again, lateral support at $85, or just underneath, was tested, with Thursday dropping to $85.98 intraday. This follows last week’s successful test, subsequent to which WTI ($86.87/barrel) went on to rally to $97.66 by this Tuesday, which was a test of the 50-day moving average, attracting strong rejection.
Resistance at $95-$96 is holding firm, so is support at $85. The way things are setting up, odds favor a breach of support sooner than later.
In the meantime, per the EIA, US crude production in the week to August 26 increased 100,000 barrels per day to 12.1 million b/d. As did stocks of distillates, which rose 112,000 barrels to 111.7 million barrels. Stocks of crude and gasoline, however, fell – respectively down 3.3 million barrels and 1.2 million barrels to 418.3 million barrels and 214.5 million barrels. Crude imports decreased as well, down 215,000 b/d to six mb/d. Refinery utilization dropped 1.1 percentage points to 92.7 percent.
E-mini S&P 500: Currently net short 239.6k, down 22.6k.
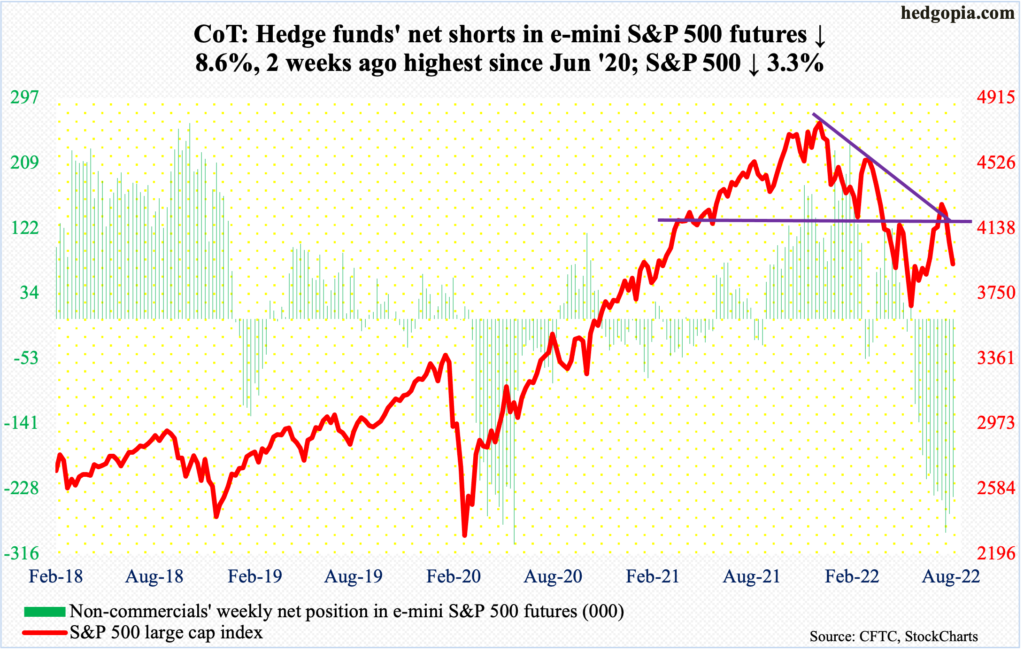
The S&P 500 logged its third consecutive weekly drop, down 3.3 percent (more on this here). At Thursday’s session low 3904, the large cap index tested a rising trend line from June 17 when it bottomed at 3637. A rally from that low stopped August 16 when sellers appeared at a falling trend line from January’s record high.
So, for now, the index (3924) seems trapped between these two trendlines. The upper line gets tested around 4270s, which is about where the 200-day (4290) – falling – lies. For this scenario to pan out, bulls first need to take out the 50-day at 4020; the average was breached on Tuesday and attracted sellers on Wednesday and Friday, with the latter reversing from up 1.3 percent intraday to close down 1.1 percent.
There is room for the daily to rally. Before the 200-day, there is horizontal resistance at 4150s. Inability to reclaim the 50-day soon raises the odds the weekly will continue to unwind its overbought condition.
Euro: Currently net short 47.7k, up 3.6k.
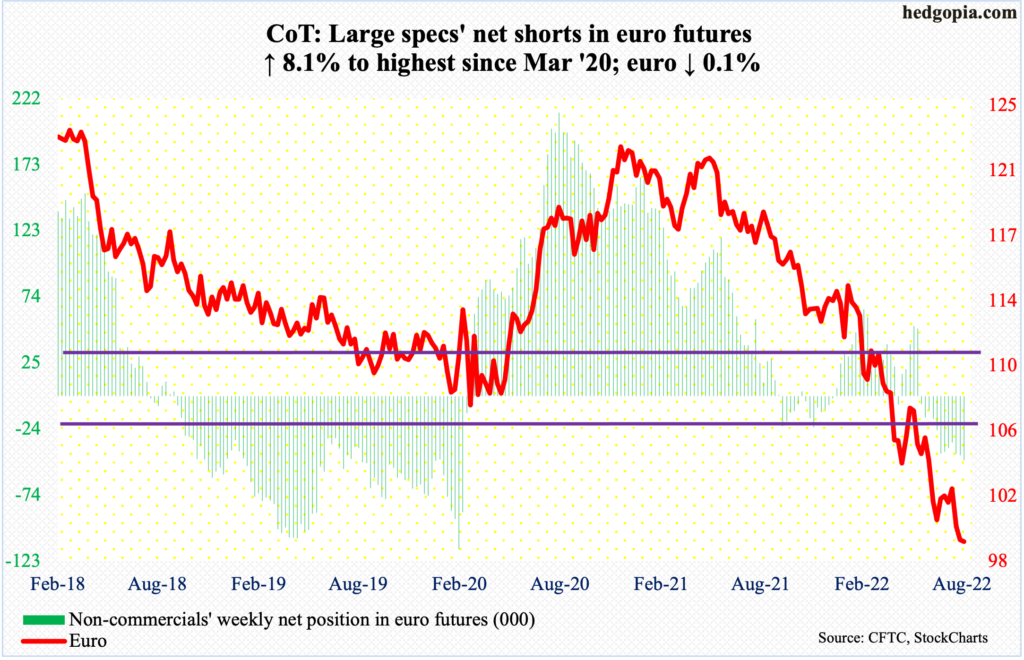
Staying above parity is proving difficult for euro bulls. In all five sessions this week, the currency ($0.9954) rallied above one intraday but managed to close in only two.
July 14 was the first time since December 2002 the euro breached $1. After that, rally attempts were rejected on August 10-11 at straight-line resistance $1.0350s, which at the time also approximated the 50-day (now $1.0175).
From bulls’ perspective, the good thing is that bids are showing up at $0.99; the bad is that they are unable to launch a rally off of this. Breach risks rise the longer the bears keep hammering on this.
Gold: Currently net long 117.7k, down 8.1k.
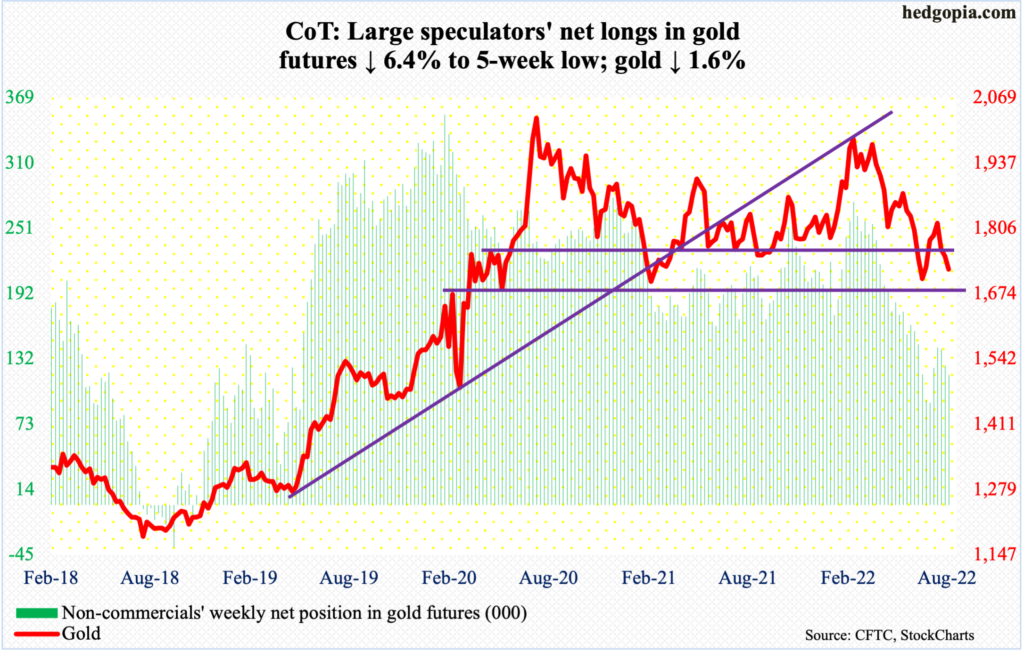
After four up weeks in a row, gold ($1,722/ounce) is now down in three in succession.
The metal closed right at $1,760s-$1,770s support/resistance the past couple of weeks. In fact, in all five sessions last week, gold tried to take out the level – unsuccessfully. This week, it dropped in the first four sessions, with Thursday tagging $1,699.
On July 21, gold bugs defended straight-line support at $1,670s, which then led to the aforementioned four weeks of rally. This is a must-hold for the bulls.
Nasdaq 100 index (mini): Currently net long 26.8k, down 11.2k.
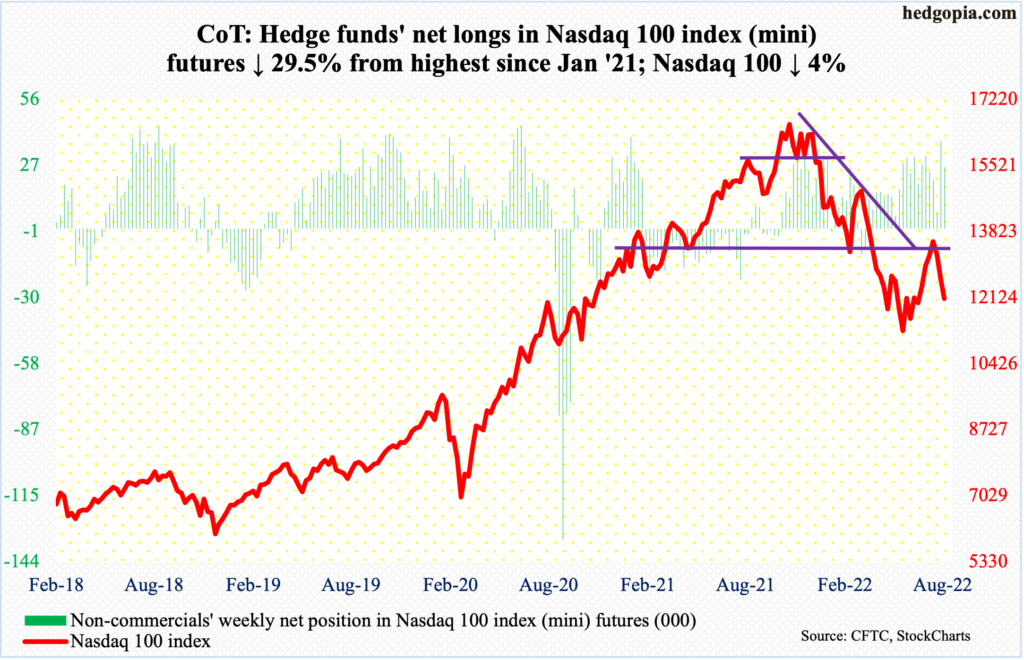
On June 16, the Nasdaq 100 bottomed at 11037 but not before collapsing 34.2 percent from last November’s record high 16765. From the June low, it then rallied 24.3 percent through August 16’s spinning top, reversal peak.
On Thursday, the tech-heavy index ticked 12013 intraday, which was a slight breach of a rising trend line from the June low. This is a must-hold for tech bulls. The index closed out the week at 12098.
In the event this is defended in the sessions ahead – likely – apart from the 50-day at 12543, nearest decent resistance lies at 13000.
Russell 2000 mini-index: Currently net short 91.1k, down 3.8k.
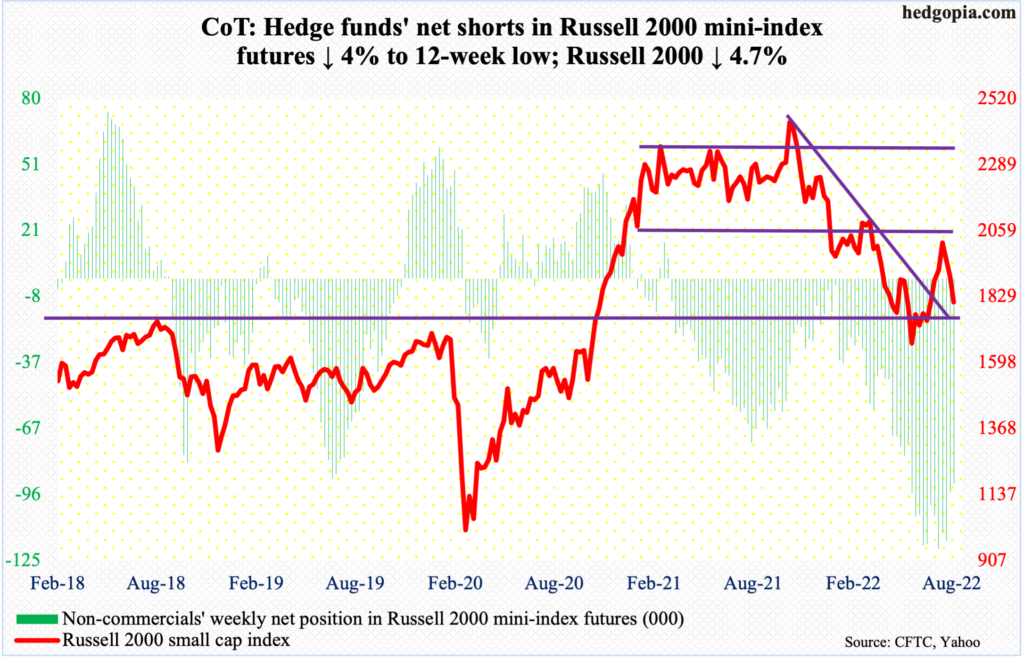
Last week, the Russell 2000 closed right at 1900, having earlier touched 2030 on August 16. This week, 1900 was breached, raising the possibility that the small cap index (1810) would head toward the bottom of the prior range.
To recall, a major breakdown occurred mid-January, losing 2080s; for 10 months, the Russell 2000 went back and forth between 2080s and 2350s, followed by a seesaw action between 2080s and 1900 and between 1900 and 1700 after that; 1700 is where it broke out of in November 2020. The breakout retest was successful.
But before 1700 gets tested, 1800, which is essentially where the index ended this week, needs to decisively give way.
US Dollar Index: Currently net long 35.5k, up 416.
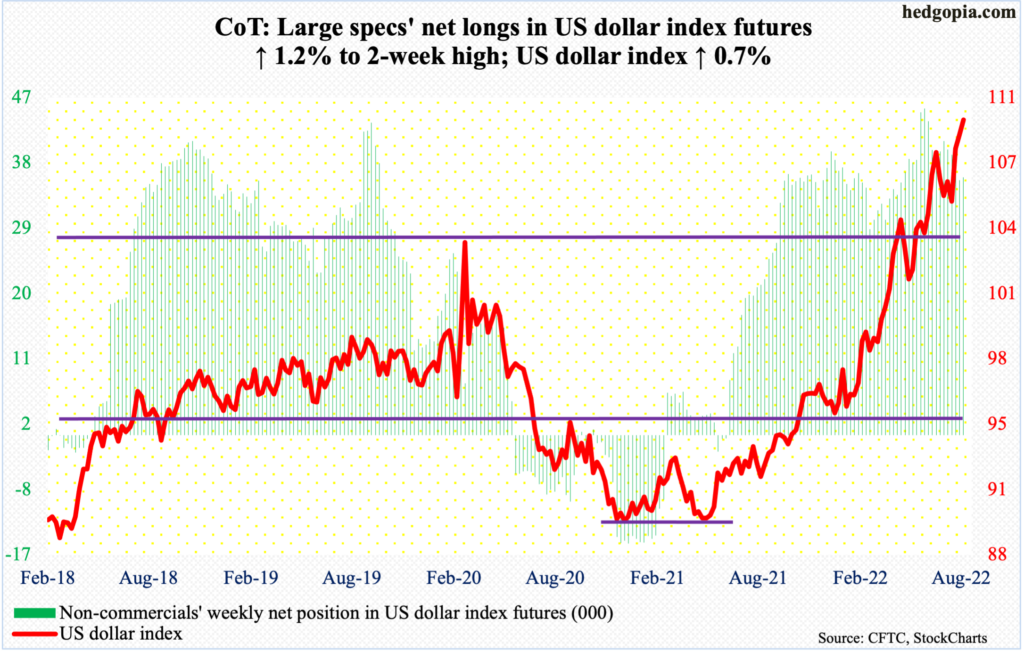
Defying all expectations, the US dollar index (109.51) continued to push higher. On Thursday, it rallied one percent to push past one-and-a-half-month resistance just north of 109; the session high 109.98 was the highest print since June 2002.
It is too soon to say if the breakout is genuine. If it is, then the next time the index drops, 109 should draw enough interest not to get breached.
VIX: Currently net short 97.9k, down 8.4k.
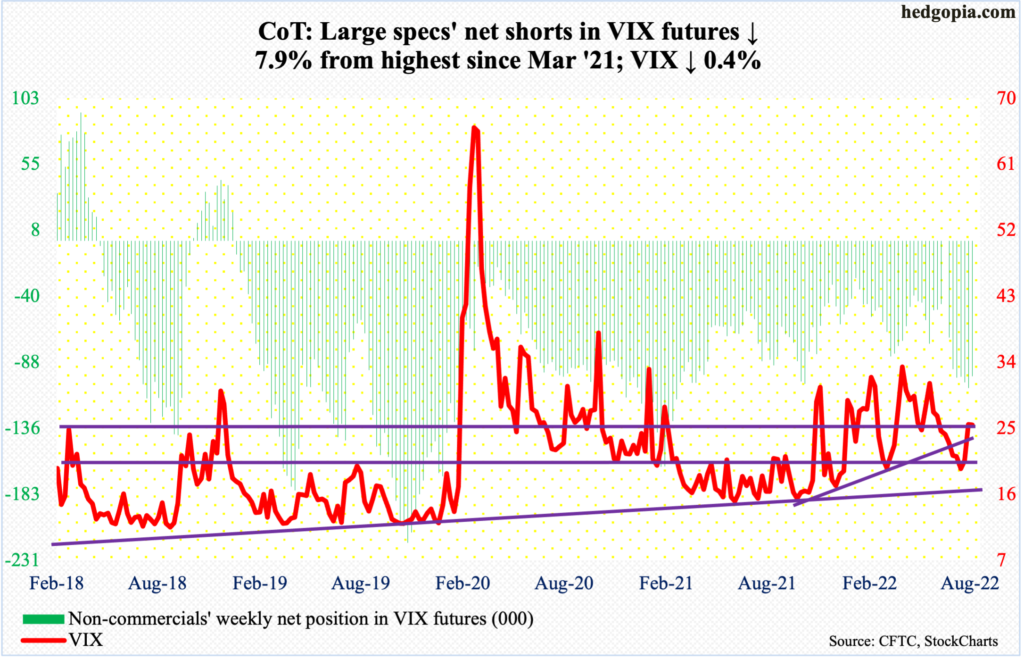
The S&P 500 dropped 3.3 percent this week, as did VIX (25.47), inching lower 0.4 percent to close right at mid-20s support. This rather uncharacteristic behavior on volatility’s part could very well be a tell for the coming sessions.
Despite repeated attempts, the volatility index was unable to take out 27.60s, leaving behind upper wicks in all five sessions – the first four in particular.
As things stand, the daily is looking for a reason to head lower. There is straight-line support at low-20s.
Thanks for reading!
