
Following futures positions of non-commercials are as of December 13, 2022.
10-year note: Currently net short 376.4k, up 7.2k.
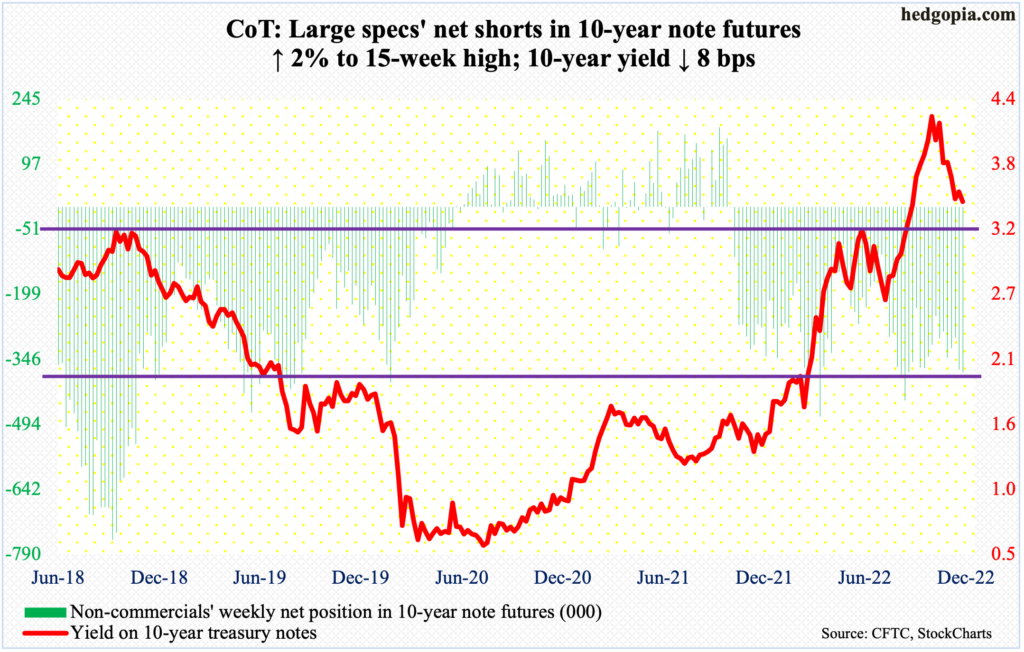
“Don’t fight the Fed” is an oft-quoted phrase in financial markets. When post-2008 financial crisis the Federal Reserve aggressively expanded its balance sheet, equity bulls so often reminded – rightly – the bears how they were destined to lose. Fast forward to now, the central bank is both reducing its balance sheet and raising the benchmark rates. Yet, the bulls are fighting the Fed.
On Wednesday, the FOMC raised the fed funds rate by 50 basis points, which was a step-down from four consecutive 75-basis-point hikes. The benchmark rates currently stand at a target range of 425 basis points to 450 basis points. The dot plot projected that rates would peak next year at 5.1 percent. Futures traders, on the other hand, continue to forecast rates to peak south of five percent by March next year and for the Fed to begin to ease by November.
In the post-meeting presser this week, Chair Jerome Powell was crystal clear there will be no rate cuts next year. “Historical experience cautions strongly against prematurely loosening policy. I wouldn’t see us considering rate cuts until the committee is confident that inflation is moving down to two percent in a sustainable way.”
Two percent is a long way from here. On Tuesday, headline and core CPI (consumer price index) in the 12 months to November came in at 7.1 percent and six percent, with the former peaking at 9.1 percent in June and the latter at 6.6 percent in September – the highest since November 1981 and August 1982. Yes, it has been trending lower, but inflation remains elevated.
As things stand, it has almost become a staring contest between the Fed and markets. Several times in the past, the Fed has tended to blink first. This time around, odds favor “don’t fight the Fed” wins out.
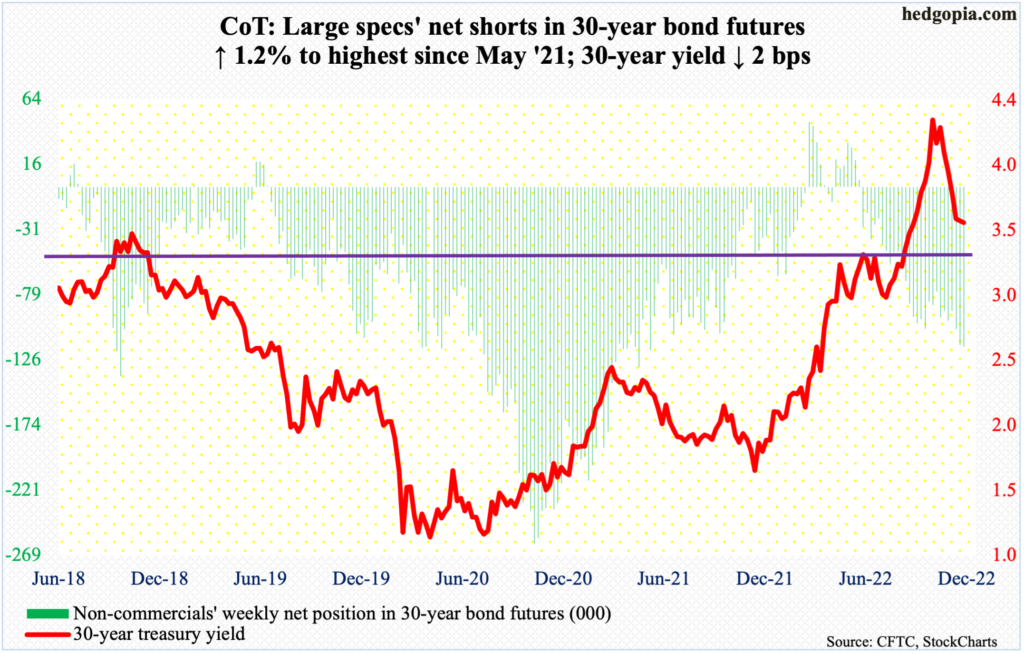
30-year bond: Currently net short 116.7k, up 1.4k.
Major economic releases for next week are as follows.
The NAHB housing market index (December) is scheduled for Monday. Homebuilder optimism fell five points month-over-month in November to 33, which is the lowest since April 2020.
Housing starts (November) will be out on Tuesday. Starts dropped 4.2 percent m/m in October to a seasonally adjusted annual rate of 1.42 million units. July’s 1.38 million was the lowest since August 2020.
Wednesday brings existing home sales (November). October sales declined 5.9 percent m/m to a 29-month low of 4.43 million units (SAAR).
GDP (3Q22, final) and corporate profits (3Q22, revised) are on deck for Thursday.
The second estimate showed real GDP grew at an annual rate of 2.9 percent in 3Q. This followed back-to-back negative quarters – -1.6 percent in 1Q and -0.6 percent in 2Q.
Corporate profits with inventory valuation and capital consumption adjustments fell 1.1 percent quarter-over-quarter to $2.97 trillion (SAAR). Profits hit record $3 trillion in 2Q.
On Friday, personal income/spending (November), durable goods orders (November), the University of Michigan’s consumer sentiment index (December, final) and new home sales (November) are on tap.
In the 12 months to October, headline and core PCE (personal consumption expenditures) increased six percent and five percent respectively. They peaked in June and February this year at seven percent and 5.4 percent, in that order.
Orders for non-defense capital goods ex-aircraft – proxy for business capex plans – rose 0.6 percent m/m to $75.28 billion, just a tad lower than August’s record $75.38 billion.
December’s preliminary reading showed consumer sentiment rose 2.3 points m/m to 59.1 – a two-month high.
Sales of new homes in October grew 7.5 percent m/m to 632,000 units (SAAR) – a two-month high.
WTI crude oil: Currently net long 283.3k, down 1.9k.
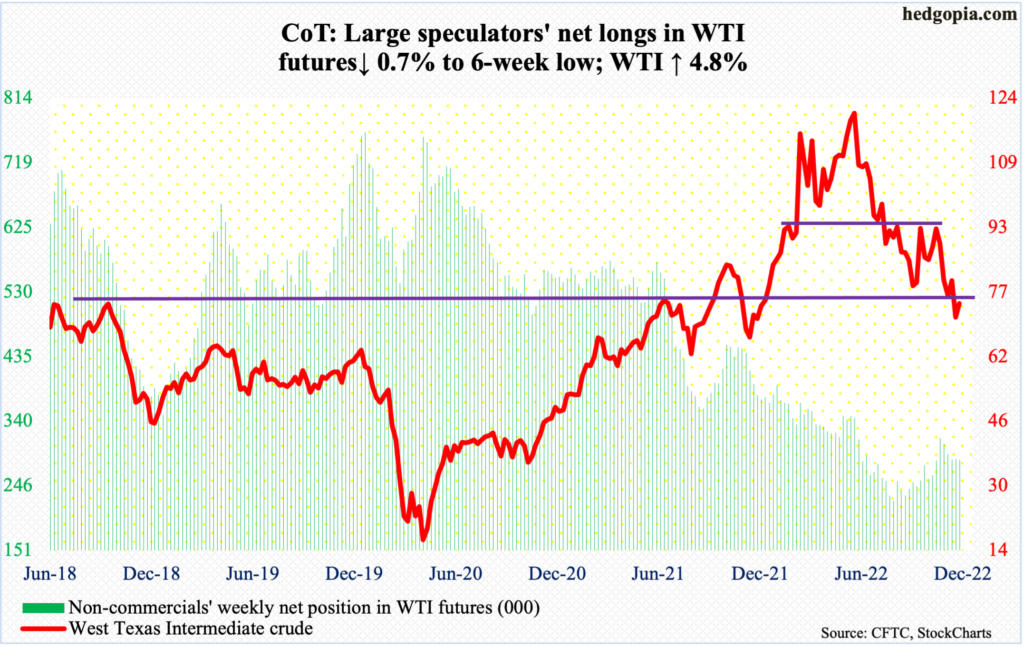
Oil bulls defended $70, including this Monday. But rally attempts were cut short as lateral resistance at $75-$76 held.
On the weekly, WTI ($74.46/barrel) can rally. For that to happen, $75-$76 needs to yield first.
A falling trendline from June will be tested at $85.
In the meantime, as per the EIA, US crude production in the week to December 9 declined 100,000 barrels per day week-over-week to 12.1 million b/d. Crude imports, however, increased 855,000 b/d to 6.9 mb/d. Stocks of crude, gasoline and distillates all grew – by 10.2 million barrels, 4.5 million barrels and 1.4 million barrels respectively to 424.1 million barrels, 223.6 million barrels and 120.2 million barrels. Refinery utilization decreased 3.3 percentage points to 92.2 percent.
E-mini S&P 500: Currently net short 230.1k, up 26.4k.
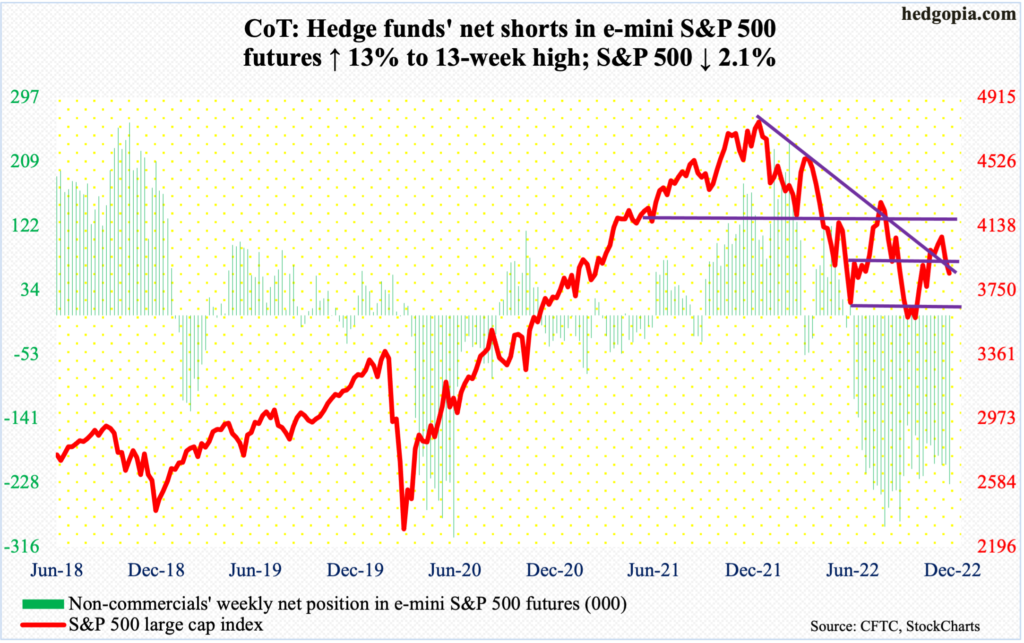
Their inability to recapture dual resistance – a falling trend line from January when the S&P 500 reached a new record high and the 200-day moving average – is costing equity bulls dearly. Last week, the large cap index fell 3.4 percent. This week, it dropped 2.1 percent.
Bulls tried to rally the index on Tuesday on the back of November’s softer-than-expected CPI but only to reverse hard after hitting 4101. Things unfolded similarly on Wednesday when the FOMC raised the benchmark rates by 50 basis points. By Friday, horizontal support at 3900 was compromised, as was the 50-day. The average lies at 3864. With the index closing at 3852, it is conceivable the bulls will try to win it back early next week.
Even if they succeed near term, several indicators on the weekly – overbought – are turning lower.
Euro: Currently net long 124.7k, down 168.
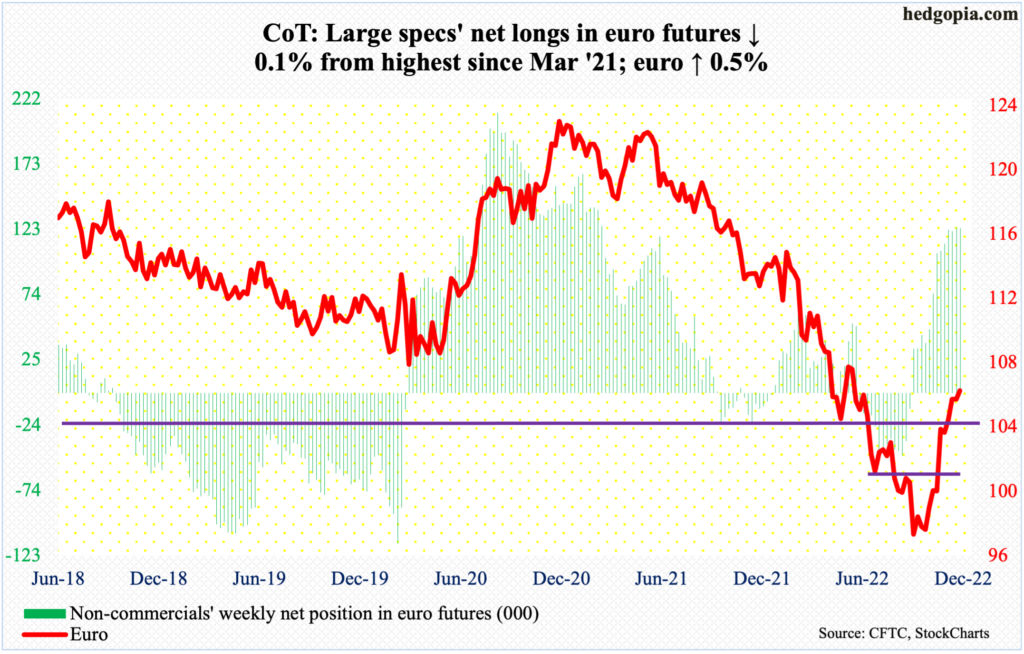
The euro rose for the fourth week in a row. Since the currency bottomed late September at $0.9559, it has rallied in eight of 12 weeks, reclaiming both the 50- and 200-day.
This week’s 0.5-percent gain would have been a lot better had the bulls succeeded in hanging on to the intraday high of $1.0736, but the strength quickly faded, with Thursday leaving behind a long upper wick.
The $1.07-$1.08 level has drawn bulls and bears alike going back several years. The best the bulls can do is reload from a lower level. There is crucial support at $1.04.
Gold: Currently net long 125.6k, up 10.5k.
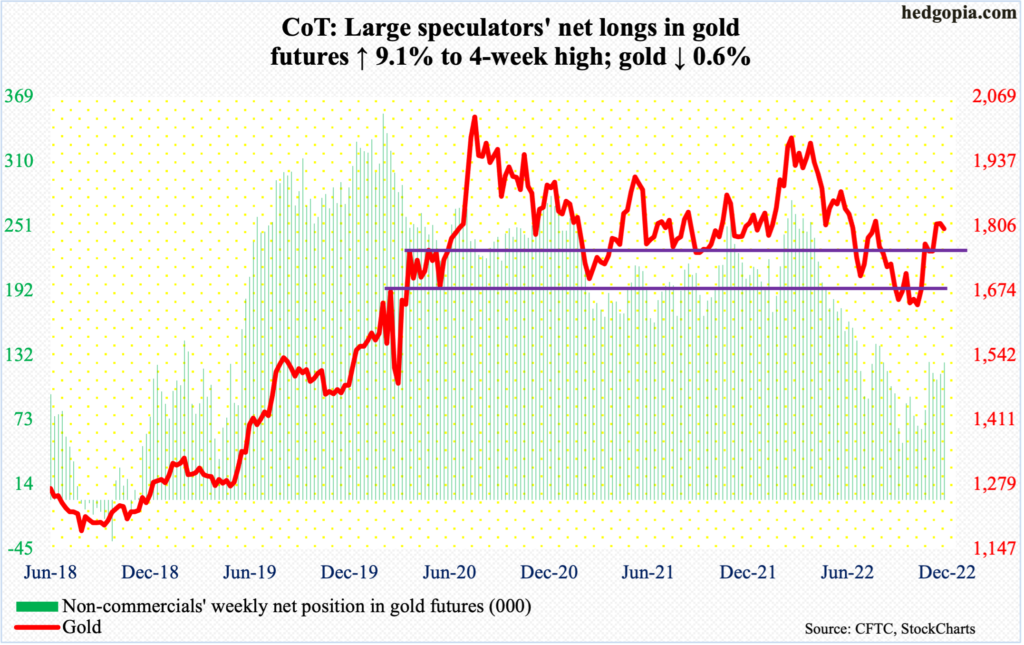
Throughout this month, gold ($1,800/ounce) has straddled the 200-day. After losing the average on Thursday, the metal went back above it on Friday.
So far this month, gold bugs have been rejected at $1,820s, although gold rallied as high as $1,837 on Tuesday.
The longer this goes on, odds grow the yellow metal goes back down to test $1,760s-$1,770s.
Nasdaq 100 index (mini): Currently net long 19.2k, up 5.7k.
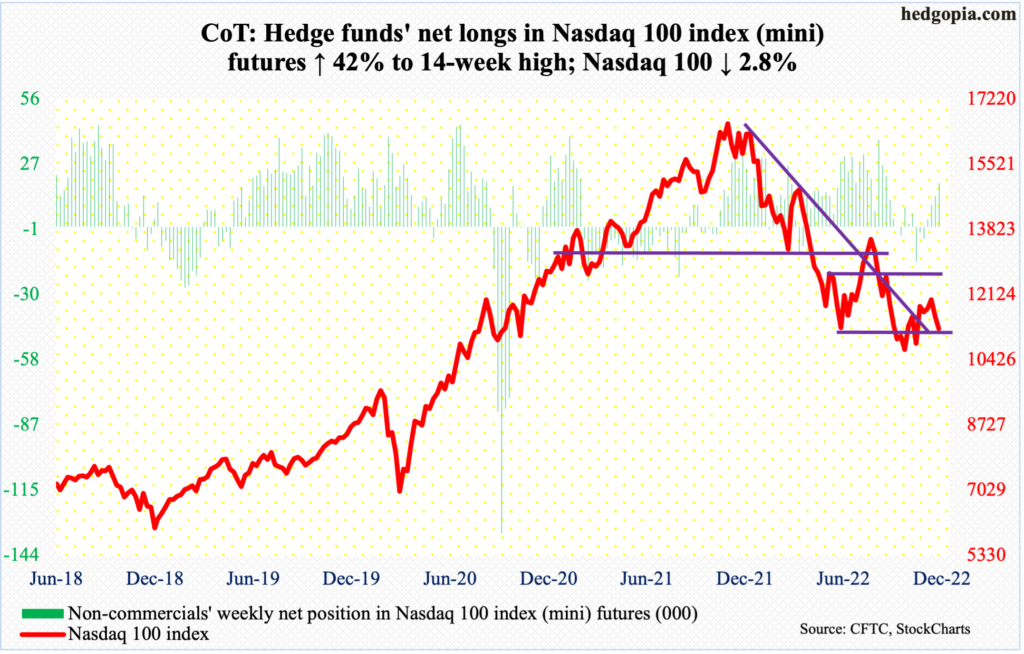
The Nasdaq 100 bottomed at 10441 on October 13. This Tuesday, the tech-heavy index ticked 12166 intraday before reversing lower. The 50-day was breached on Thursday.
From tech bulls’ perspective, the good thing is that Friday’s low (11176) found support at a rising trendline from the low two months ago. Regardless where the index (11244) goes in the very near term, it is just a matter of time before the trendline gets breached.
Russell 2000 mini-index: Currently net short 63.8k, down 9.7k.
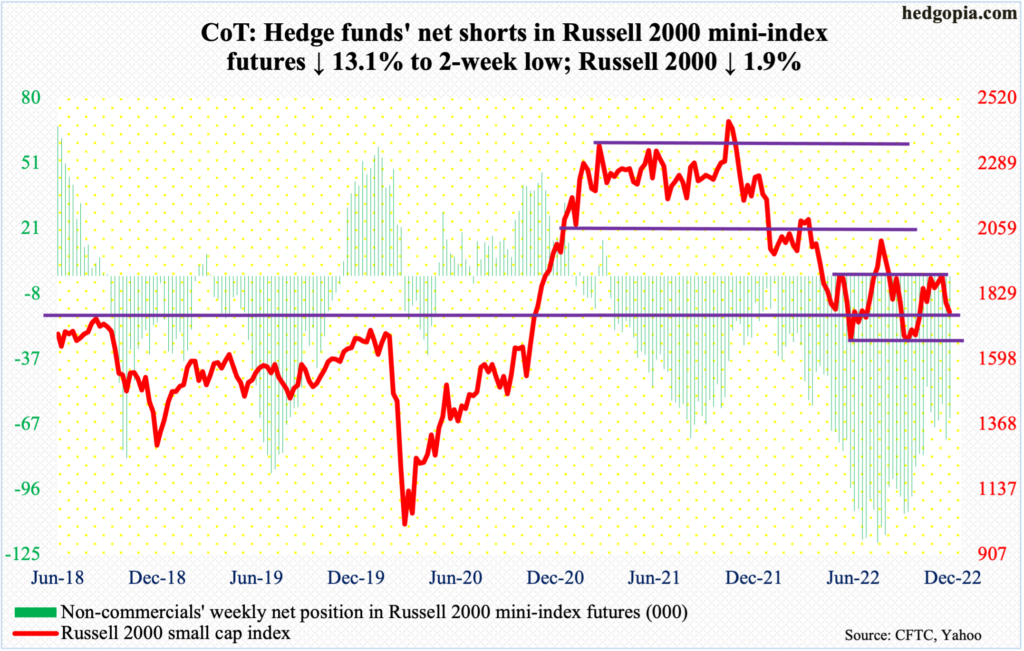
The Russell 2000 has faced difficulty at 1900 for five weeks. This Tuesday, the small cap index tagged 1881 intraday before weakening. By Friday, 1746 was ticked, closing out the week at 1763.
The 1900-1700 range has been in play for a while now.
The index peaked in November last year at 2459, before dropping all the way to 1642 by October 13 this year. Mid-January, it lost 2080s; for 10 months leading up to that, the index was rangebound between 2080s and 2350s. It then seesawed between 2080s and 1900, followed by a ping pong match between 1900 and 1700.
Having failed at 1900, the path of least resistance is toward 1700.
US Dollar Index: Currently net long 25.8k, up 892.
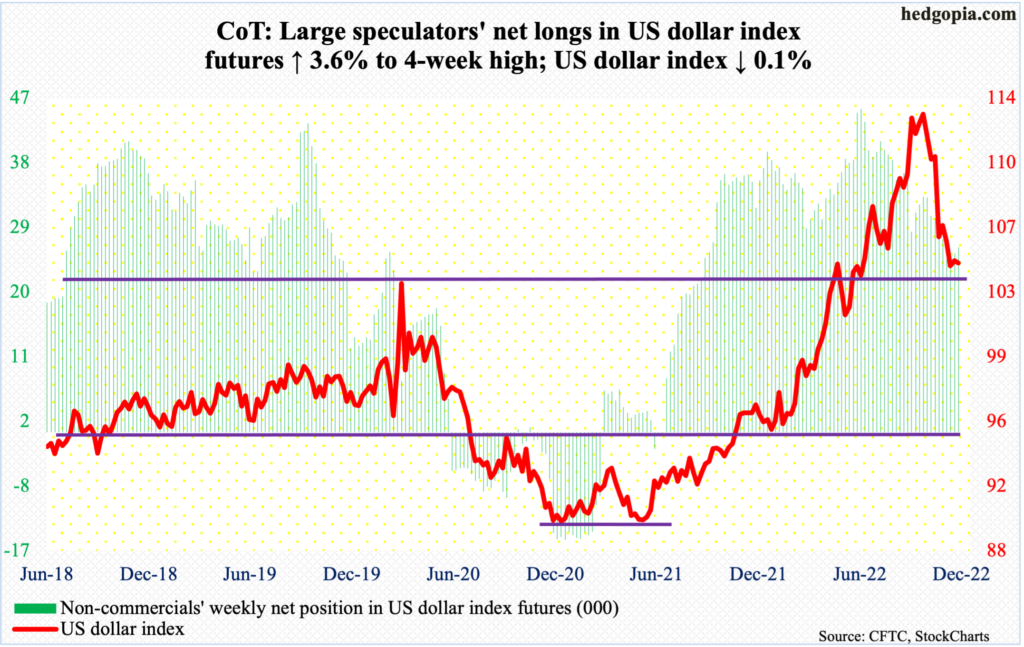
After having defended 104 in the last two weeks, dollar bulls came close to losing that support mid-week when the US dollar index tagged 103.39 on Wednesday. In the end, they were able to put their foot down. The index ended Friday at 104.66.
The US dollar index broke out of 104, which goes back to at least 2017, in the middle of this year, before reaching a major high on September 28 tagging 114.75 – the highest print since May 2002. Being able to defend the level suggests longs are still in it.
The daily is itching to rally.
VIX: Currently net short 83k, up 8.4k.
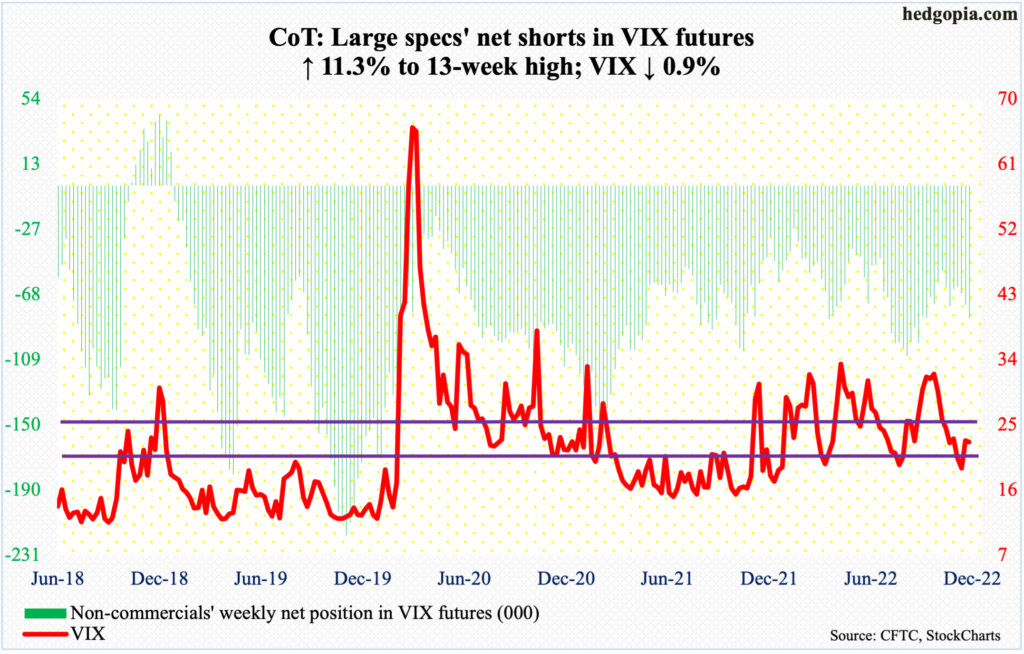
On Tuesday, VIX had a wild session, ranging from 25.84 to 21.46, closing at 22.55; the S&P 500 too reversed in that session, ending the week down 2.1 percent. VIX also closed lower last week, down 0.9 percent to 22.62. Normally, the two tend to move in opposite directions; last week’s positive correlation is rare.
Having stopped volatility bulls at mid-20s, the bears could very well attack low-20s next week. Even if this happens, VIX is ready to strengthen on the weekly.
Thanks for reading!
