
Following futures positions of non-commercials are as of December 20, 2022.
10-year note: Currently net short 316.9k, down 59.5k.
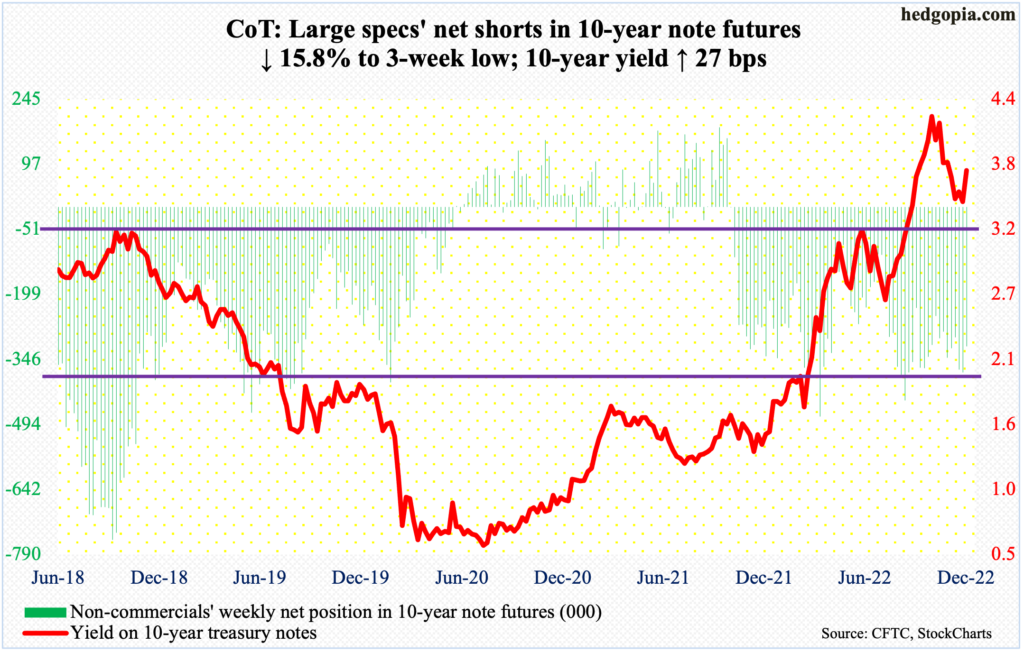
The Bank of Japan, which began to use its balance sheet as a policy tool much earlier than its peers in the developed world, pulled a surprise on markets on Tuesday. The central bank allowed the 10-year Japanese bond to move 50 basis points either side of its zero percent target. Previously, the band was 25 basis points. Markets took it as a de facto tightening, although Governor Hirohiko Kuroda would not admit.
This week’s reaction could very well be a trailer before a movie is actually screened at the theater. Defying rising rates globally, the BoJ continued to press hard on the stimulative pedal. The Japanese yen as a result was under persistent attack.
On September 22 (this year), for the first time since the 1998 Asian financial crisis, Japan intervened in the foreign exchange market buying the yen. This was followed by another intervention on October 21, when the currency reversed after ticking 151.95 – a three-decade low – against the dollar.
Tuesday’s BoJ action lit a fire under the yen, closing out the week at 132.84, down 2.8 percent, although it was down as much as 4.4 percent at the session low. Markets are clearly anticipating more tightening ahead. Given a five-fold increase in its balance sheet over a decade (more on this here), there is a lot of unwinding that needs to happen.
As rates went negative in Japan, Japanese assets, in search of higher returns, were forced to go abroad. Once a process of bringing this back home begins, repercussions will be felt across assets and globally.
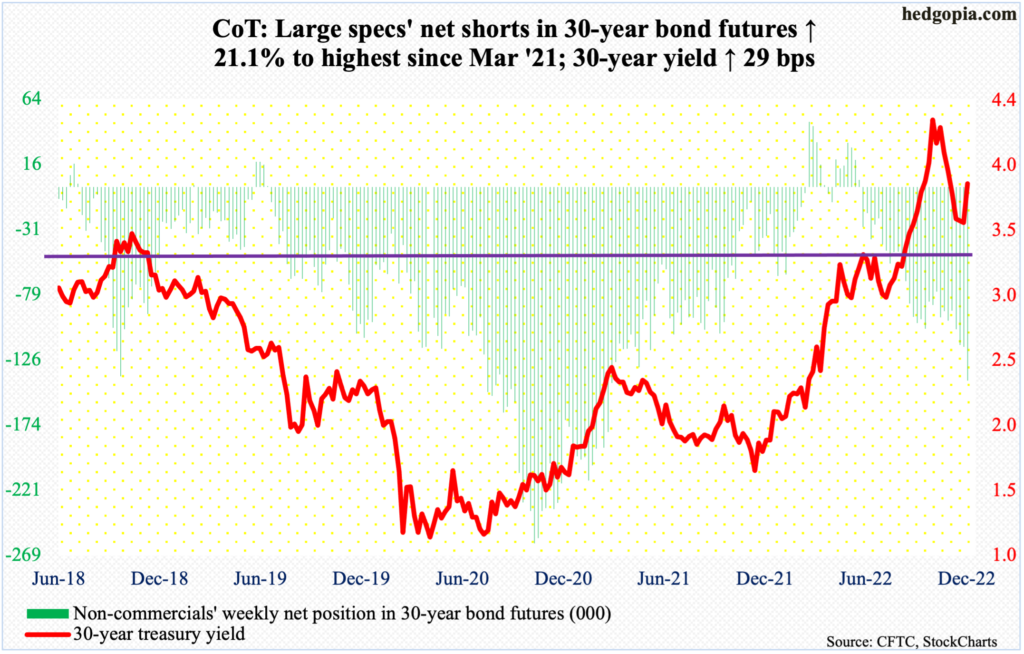
30-year bond: Currently net short 141.3k, up 24.6k.
Major economic releases for next week are as follows. Monday is closed for observance of Christmas. Merry Christmas and Happy Holidays!
On Tuesday, the S&P Case-Shiller home price index (October) is on dock. Nationally, home prices rose 10.6 percent year-over-year in September. This is a healthy pace but significantly lower than March’s record pace of 20.8 percent. Since that peak, prices have progressively softened every month.
WTI crude oil: Currently net long 299.2k, up 15.9k.
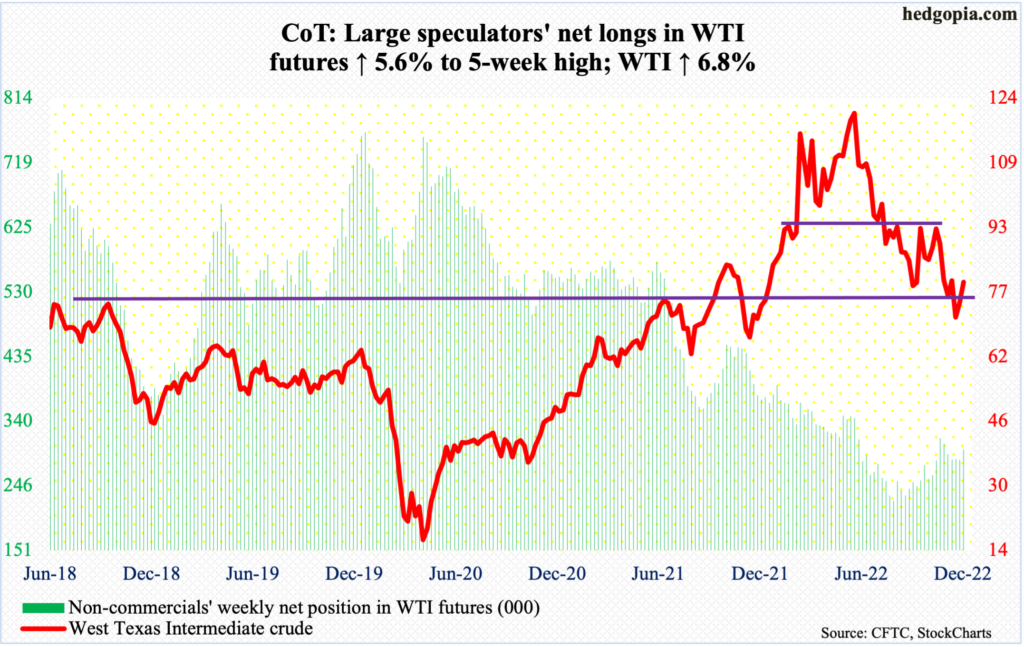
Last week, oil bulls defended the prior week’s low of $70 on WTI, rallying 4.8 percent. This week, the crude built on that rising another 6.8 percent, past lateral resistance at $75-$76.
There is decent resistance at $84-$85. Even before that, the 50-day lies at $81.80, which coincides with a falling trendline from June. WTI ($79.56/barrel) has not traded above the average since mid-November.
In the meantime, as per the EIA, US crude production in the week to December 16 was unchanged at 12.1 million barrels per day. Crude imports decreased one mb/d to 5.8 mb/d. Stocks of crude and distillates dropped as well – by 5.9 million barrels and 242,000 barrels to 418.2 million barrels and 119.9 million barrels. Gasoline inventory went the other way, up 2.5 million barrels to 226.1 million barrels. Refinery utilization decreased 1.3 percentage points to 90.9 percent.
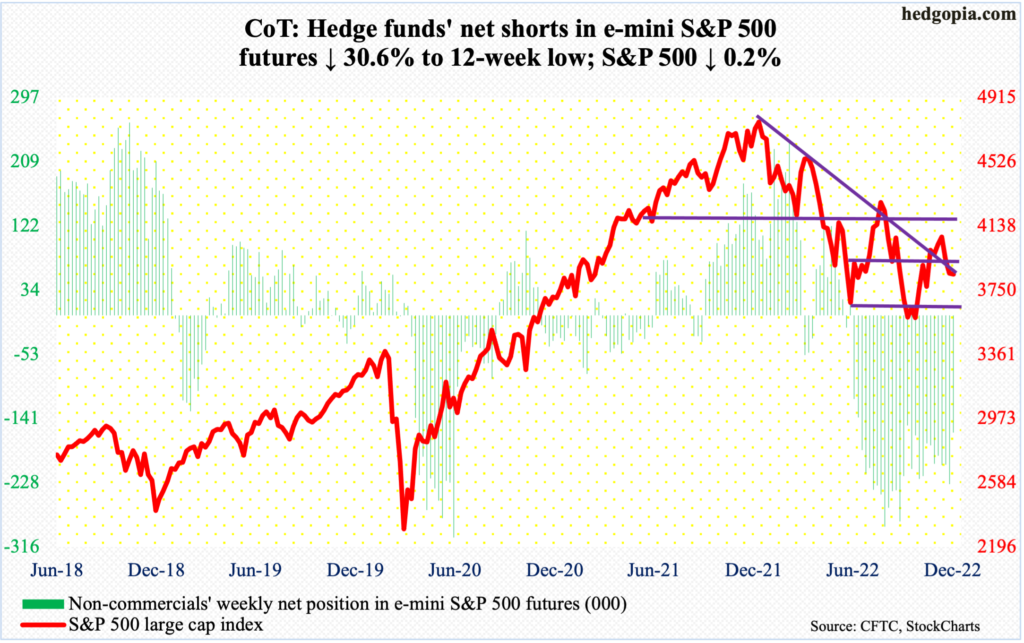
E-mini S&P 500: Currently net short 159.8k, down 70.4k.
In the week to Wednesday, $19.5 billion exited US-based equity funds; this was the fifth weekly outflows in a row, for a total redemption of $68.3 billion (courtesy of Lipper). Likewise, in the week to Wednesday, SPY (SPDR S&P 500 ETF), VOO (Vanguard S&P 500 ETF) and IVV (iShares Core S&P 500 ETF) combined lost $10.1 billion (courtesy of ETF.com).
The S&P 500 dropped 0.2 percent this week – for a third straight down week. At one time the large cap index was down 2.3 percent for the week but Thursday’s low of 3764 – not too far away from the November 9th low of 3744 – was aggressively bought; in the end, the session produced a bullish hammer.
The daily is itching to rally. Perhaps in anticipation of late-December strength, non-commercials cut net shorts in S&P 500 e-mini futures to a 12-week low.
Euro: Currently net long 142.3k, up 17.6k.
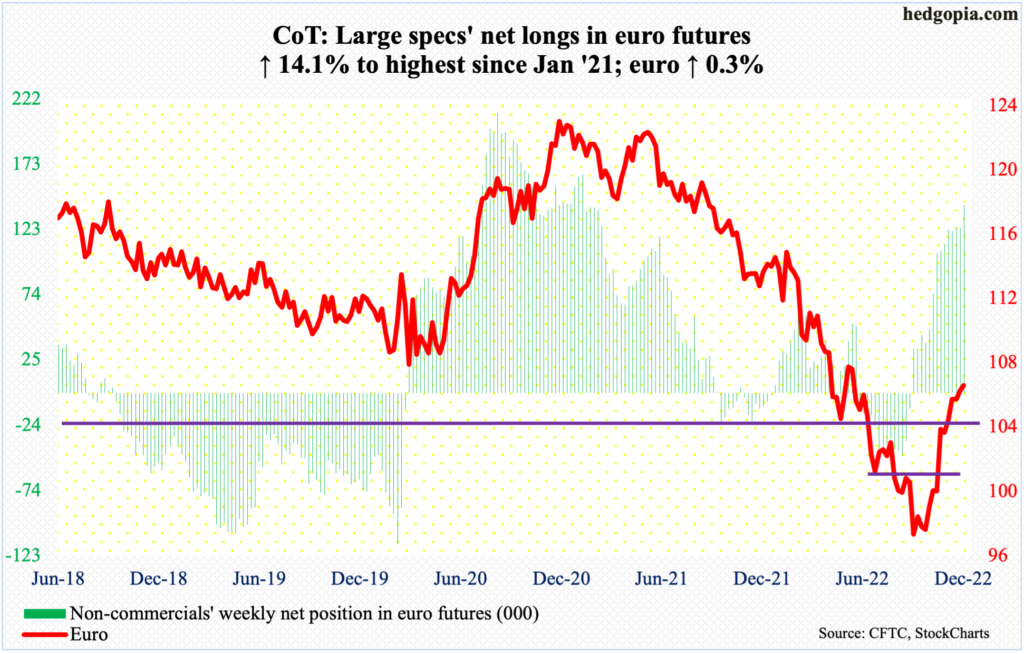
The euro managed to rise 0.3 percent for the week but not before producing a weekly doji. Last week, too, the weekly formed a candle with a long upper wick.
It increasingly feels like the euro is ready for a breather. The currency ($1.0618) bottomed late September at $0.9559 and ticked $1.0736 on the 15th this month. The $1.07-$1.08 level has drawn bulls and bears alike going back several years.
In the event of downward pressure, there is crucial support at $1.04.
Gold: Currently net long 128.8k, up 3.2k.
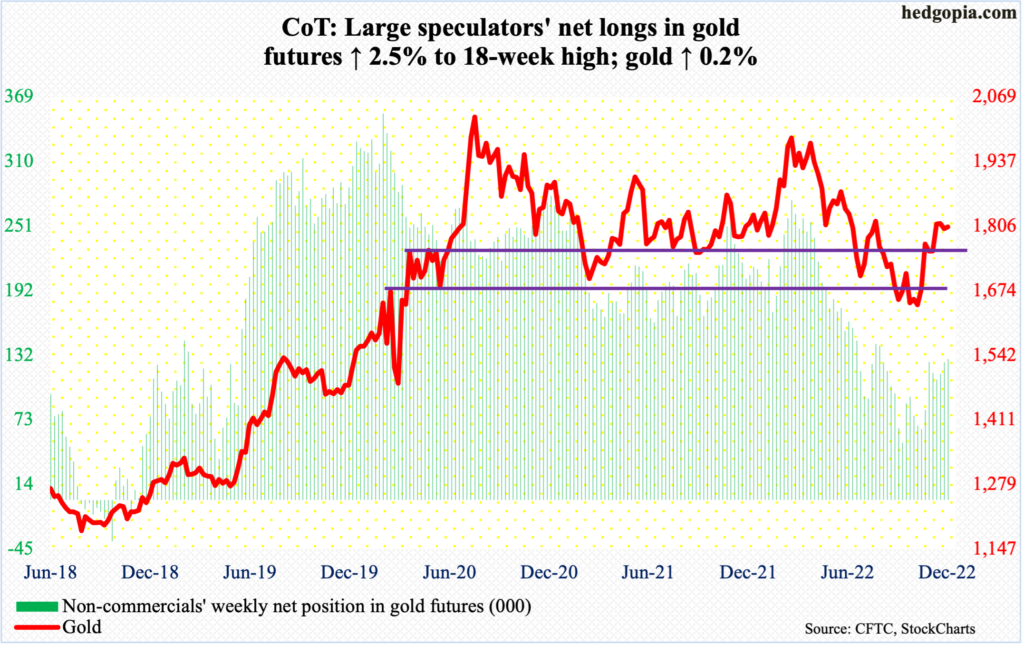
Gold ($1,804/ounce) was up 0.2 percent this week. The metal has essentially gone sideways the past four weeks, with the latter three candles showing indecision. This comes after having bottomed early November at $1,618.
On the 13th this month, gold touched $1,837 but not much came out of it. Throughout this month, gold bugs have tried to bust through $1,820s, but unsuccessfully.
Odds favor the yellow metal goes back down to test $1,760s-$1,770s sooner than later.
Nasdaq 100 index (mini): Currently net long 4.5k, down 14.7k.
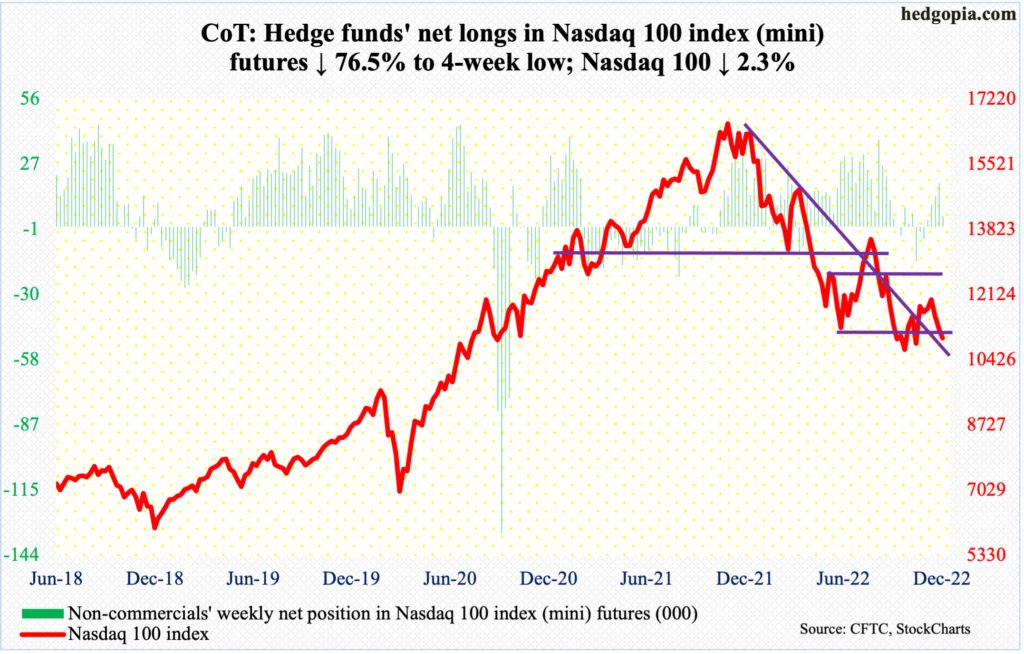
Until last week, a rising trend line from October 13 when the Nasdaq 100 bottomed at 10441 was intact. This was lost Thursday, when the tech-heavy index recovered from an intraday low of 10784 to close at 10956 but this was not sufficient to reclaim the trendline. It shed 2.3 percent for the week.
From tech bulls’ perspective, they should like how the index behaved at session lows on both Thursday and Friday. There was buying interest. The underside of the broken trendline gets tested just north of 11000, with the index closing out the week at 10985.
There is horizontal resistance at 11400, with the 50-day 11418.
Russell 2000 mini-index: Currently net short 58.9k, down 4.9k.
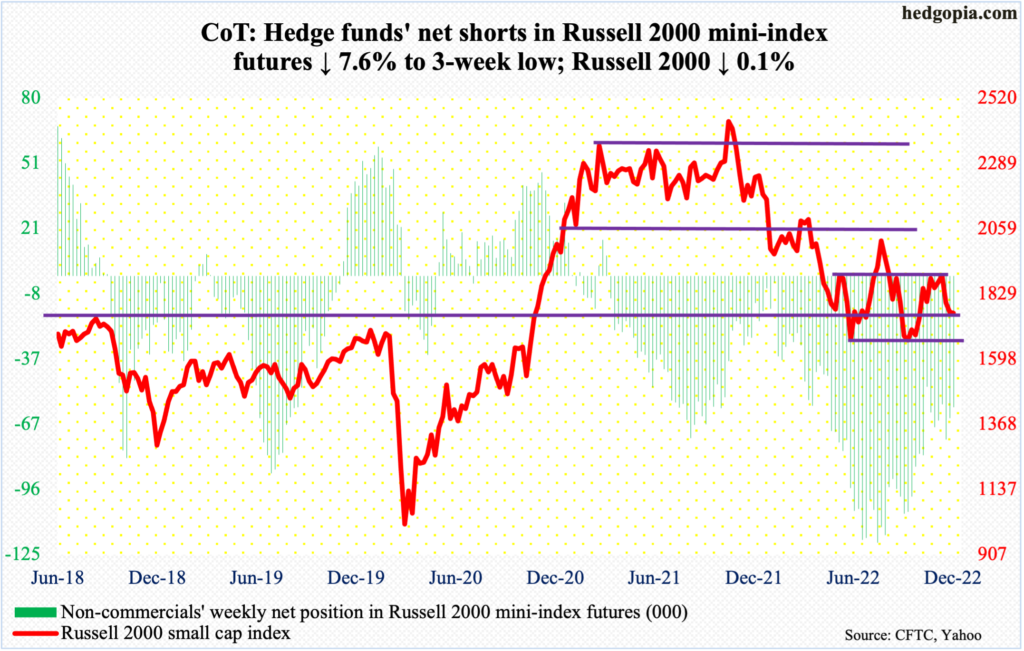
The Russell 2000 came pretty close to testing 1700 this week. On Thursday, 1727 was tagged intraday. This followed several rejections in the middle of last month and early this month at 1900.
The 1900-1700 range has been in play for a while now.
The small cap index peaked in November last year at 2459, before dropping all the way to 1642 by October 13 this year. Mid-January, it lost 2080s; for 10 months leading up to that, the index was rangebound between 2080s and 2350s. It then seesawed between 2080s and 1900, followed by a ping pong match between 1900 and 1700.
The path of least resistance is at least toward 1800, which is about where the 50-day (1809) lies.
US Dollar Index: Currently net long 16.8k, down 9k.
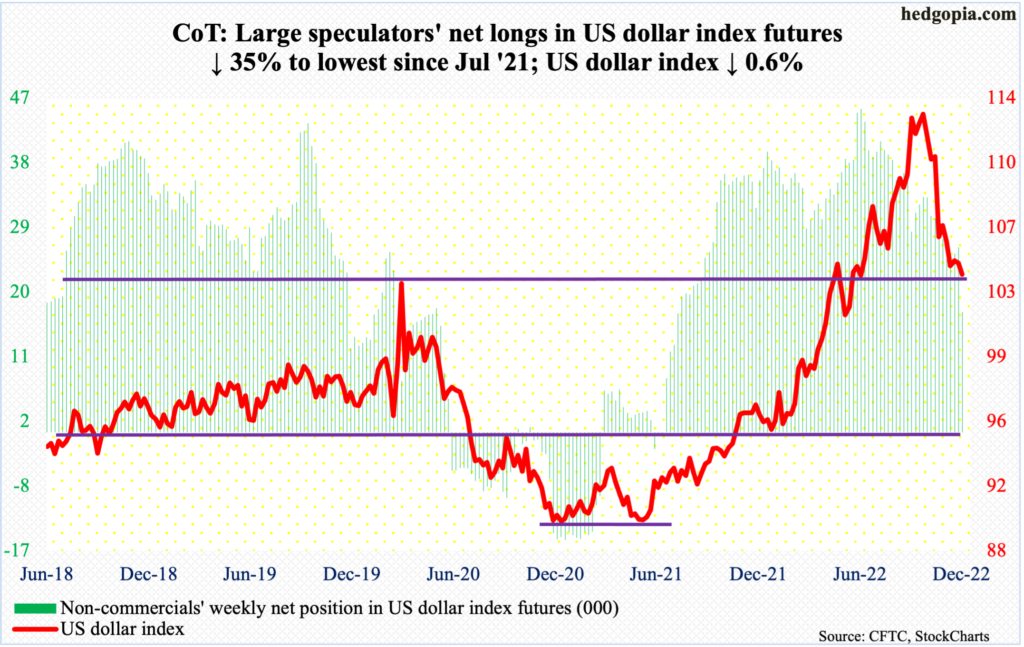
Dollar bulls saw through a tough week without compromising 104 on the US dollar index. They had defended 104, which goes back to at least 2017, in the prior three weeks. This week, the index dropped as low as 103.40 intraday Tuesday, when the Bank of Japan decision roiled the currency markets, but only to recover in subsequent sessions.
Dollar bulls have an opportunity to push the US dollar index higher in the sessions ahead, as oversold technical conditions get unwound. Nearest resistance lies just north of 105.
VIX: Currently net short 67.2k, down 15.8k.
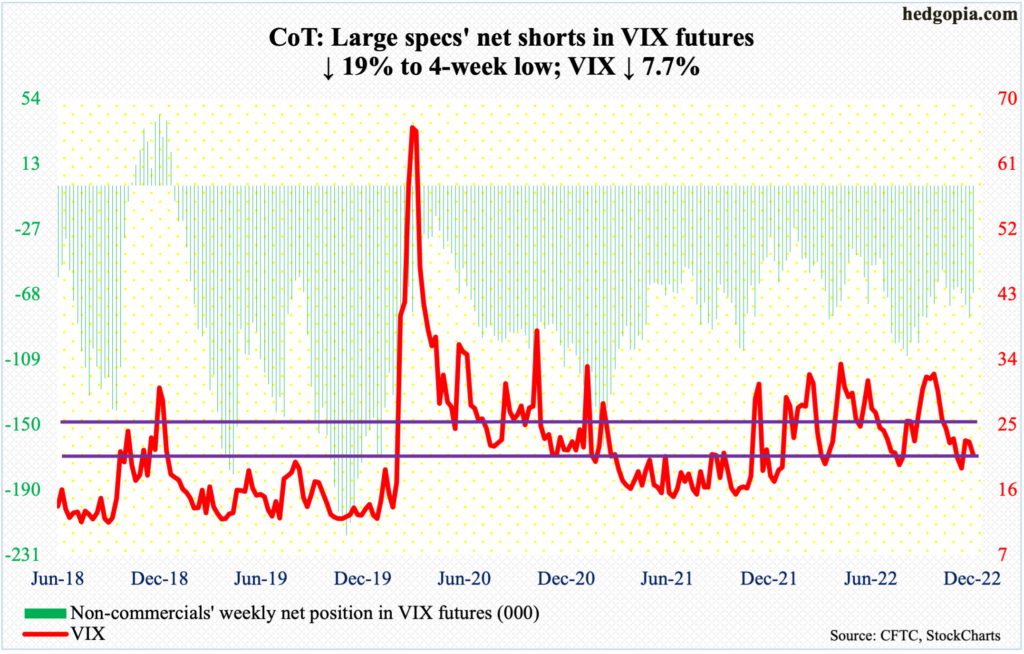
Four weeks ago, volatility bulls held 19, which has not been sustainably breached since March this year. But unlike the prior two occasions when VIX then went on to rally to 35, this month’s rally was cut short just short of 26.
For whatever it is worth, a death cross – in which the 50-day crosses the 200-day from above, formed on the 9th this month. Since then, rally attempts were vehemently repelled at the 50-day twice – one on the 13th and one this Thursday, when the volatility index ticked 24.30 intraday but only to reverse and close at 21.97. Besides the 50-day, Thursday’s session high also coincided with the daily upper Bollinger band; the lower band rests at 19.17.
As things stand, 19 for now may just act like a magnet in the sessions ahead. VIX ended the week at 20.87.
Thanks for reading!
