
Following futures positions of non-commercials are as of December 27, 2022.
10-year note: Currently net short 344.2k, up 27.3k.
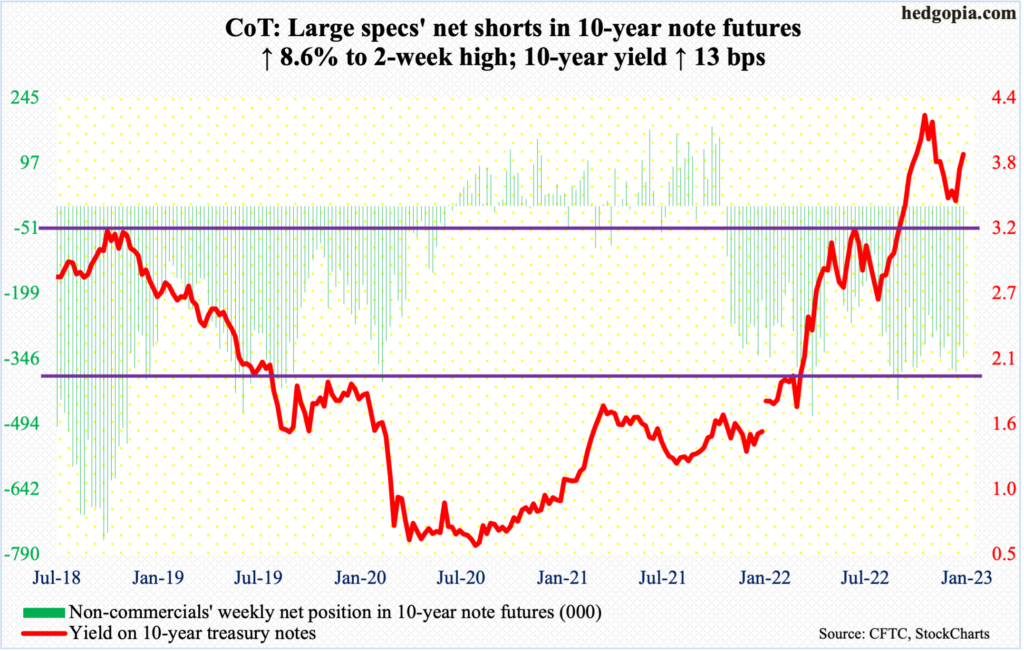
FOMC minutes for the December 13-14 meeting are due out next Wednesday. The fed funds rate was raised by 50 basis points in that meeting to a range of 425 basis points to 450 basis points. This was a step-down from four consecutive 75-basis-point hikes. In March, the benchmark rates were languishing in a range of zero to 25 basis points.
At the December meeting, Chair Jerome Powell was as hawkish as he could get, reminding the markets that there would be no rate cuts next year. The dot plot projected rates would peak next year at 5.1 percent. In the futures market, traders continue to believe that the Fed would begin to ease in the latter months of 2023.
The Fed is clearly focused on inflation. “Historical experience cautions strongly against prematurely loosening policy. I wouldn’t see us considering rate cuts until the committee is confident that inflation is moving down to two percent in a sustainable way,” as Powell told the post-meeting presser.
Markets, on the other hand, are convinced inflation is on the way to rapid deceleration. In the 12 months to November, headline and core PCE (personal consumption expenditures) increased 5.5 percent and 4.7 percent respectively, down from the peak this year of seven percent (June) and 5.4 percent (February). So, core PCE, which is the Fed’s favorite, dropped seven-tenths of a percent over nine months. Even if it continues lower, unless the pace accelerates, the Fed is unlikely to ease with core inflation in the four percent neighborhood.
Given these dynamics, not sure what additional, market-moving color can come out of the minutes.
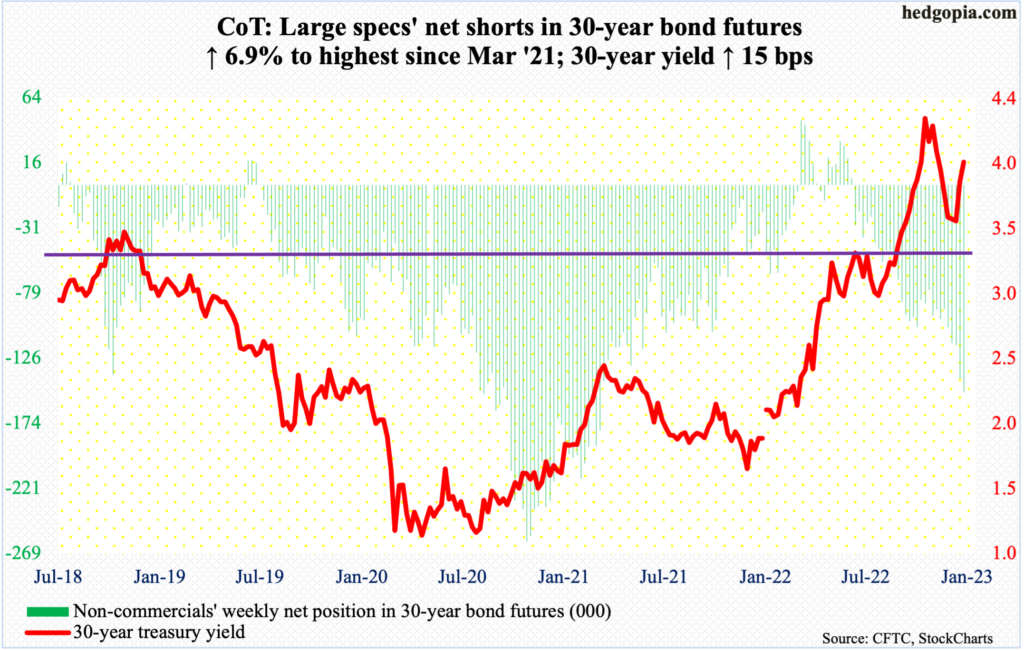
30-year bond: Currently net short 151.1k, up 9.7k.
Major economic releases for next week are as follows. Monday is closed for observance of New Year’s Day. Happy New Year!
The ISM manufacturing index (December) and job openings (JOLTs, November) are scheduled for Wednesday.
In November, manufacturing activity decreased 1.2 percentage points month-over-month to 49 percent.
Non-farm job openings dropped 353,000 m/m in October to 10.3 million. The series peaked in March at 11.9 million.
Friday brings payrolls (December), the ISM services index (December) and durable goods orders (November, revised).
November saw the creation of 263,000 non-farm jobs, for a monthly average this year of 392,000. In 2021, the economy produced an average of 562,000 jobs every month.
Services activity in November increased 2.1 percentage points m/m to 56.5 percent.
Preliminarily in November, orders for non-defense capital goods ex-aircraft – proxy for business capex plans – increased 0.2 percent m/m to a seasonally adjusted annual rate of $75.2 billion, which was a fresh record.
WTI crude oil: Currently net long 304.6k, up 5.4k.
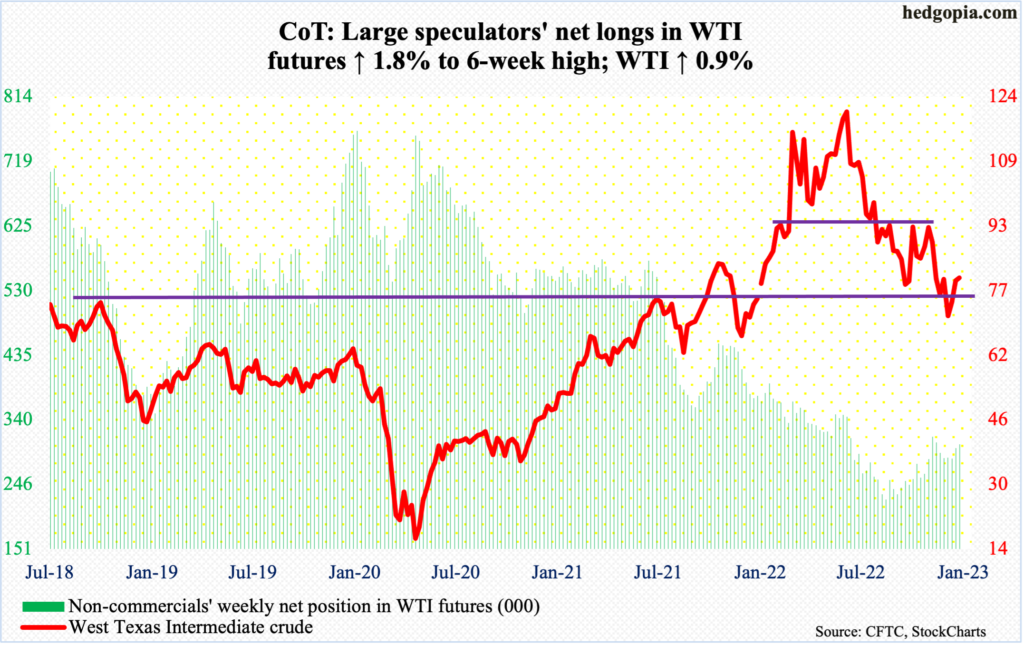
WTI ($80.26/barrel) made further progress this week toward horizontal resistance at $84-$85. Before that, a falling trendline from June gets tested at $81.50, which approximates the 50-day moving average at $81.41. The daily upper Bollinger band lies around there at $81.92.
In the meantime, as per the EIA, US crude production in the week to December 23 fell 100,000 barrels per day to 12 million b/d. Crude imports increased 433,000 b/d to 6.3 mb/d. Stocks of crude and distillates grew as well – by 718,000 barrels and 283,000 barrels respectively to 419 million barrels and 120.2 million barrels. Gasoline inventory, however, dropped 3.1 million barrels to 223 million barrels. Refinery utilization increased 1.1 percentage points to 92 percent.
E-mini S&P 500: Currently net short 174.3k, up 14.5k.
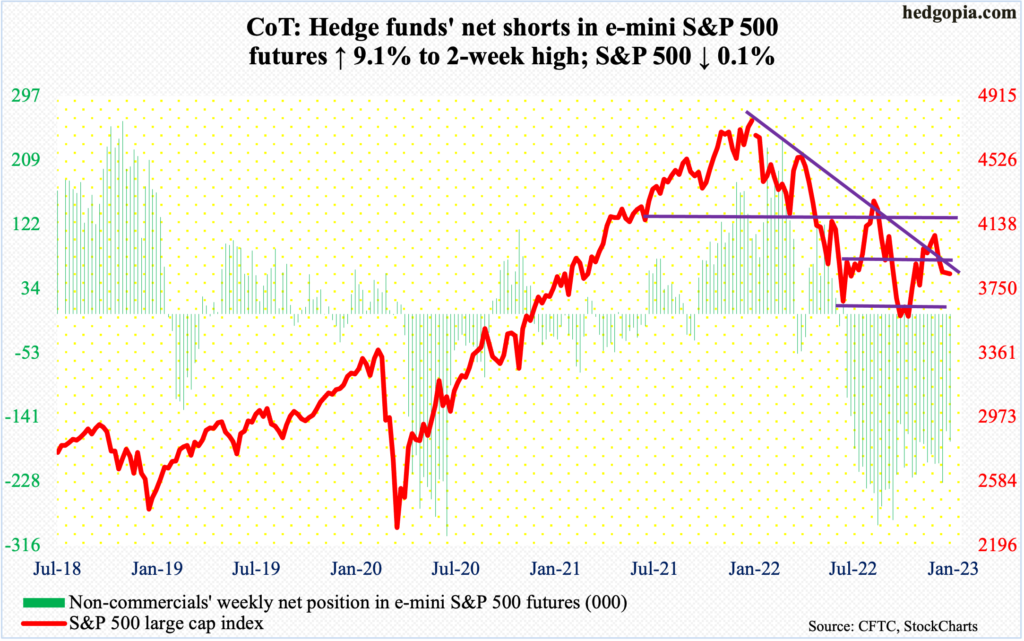
After bleeding $68.3 billion over five weeks, US-based equity funds took in $1 billion in the week to Wednesday (courtesy of Lipper). In the same week, SPY (SPDR S&P 500 ETF), VOO (Vanguard S&P 500 ETF) and IVV (iShares Core S&P 500 ETF) combined lost $939 million, but it was nowhere near the $10.1 billion in outflows in the prior week (courtesy of ETF.com).
The week started poorly for the bulls, with the S&P 500 down 1.7 percent at Wednesday’s intraday low of 3781 but closed it down only 0.1 percent. This week’s weekly dragonfly doji follows a spinning top from last week.
The large cap index is now down four straight weeks. A reversal of this trend is likely next week.
Euro: Currently net long 146.2k, up 3.9k.
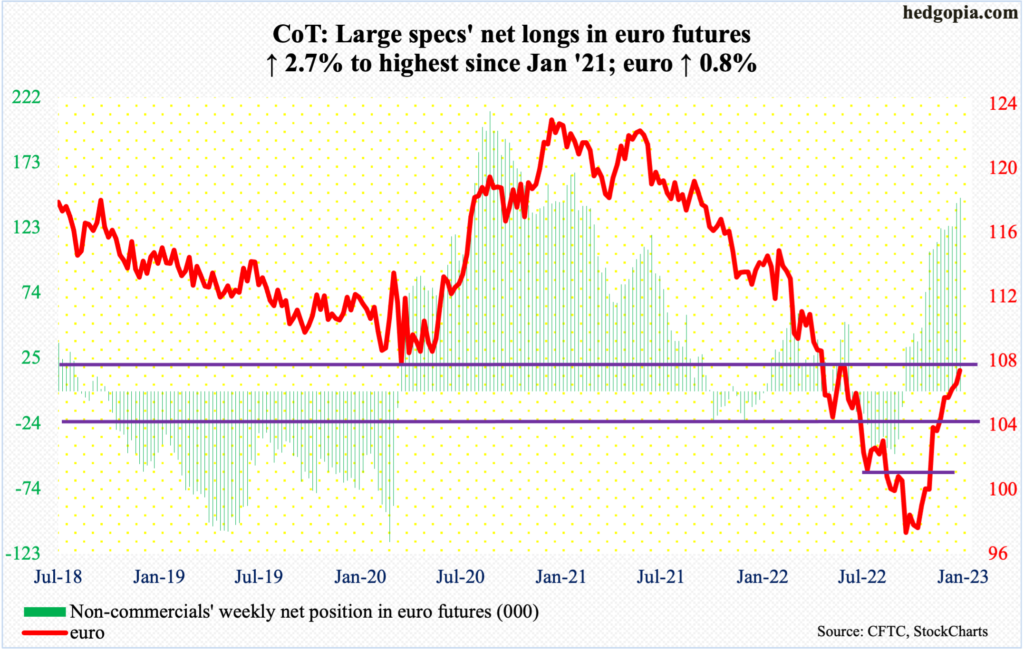
On the 15th (this month), the euro touched $1.0736 intraday but only to reverse hard to close at $1.0628. The $1.07-$1.08 level has drawn bulls and bears alike going back several years. Earlier, the currency bottomed late September at $0.9559.
Two weeks have gone by and euro bulls are back at retesting that resistance. Last Friday, the euro tagged $1.0715 before closing at $1.0703. A takeout of this ceiling will be a major development in the currency market.
In the event of downward pressure, there is crucial support at $1.04.
Gold: Currently net long 136.9k, up 8k.
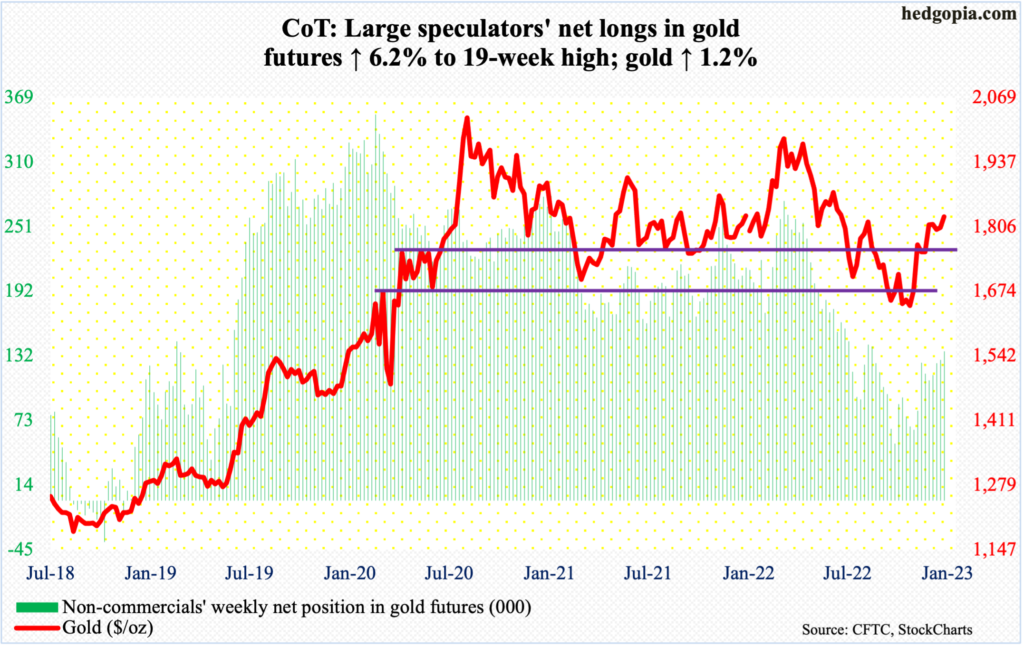
After trying for more than a month, gold bottomed at $1,620s early November. The rally that followed continued until hitting $1,820s as December began. The metal has pretty much gone sideways since, with gold bugs unable to hold on to intraday breakouts, one of which took place this Tuesday when gold ticked $1,842 but only to close at $1,823. It closed out the week at $1,826/ounce.
Non-commercials are acting as if a breakout is only a matter of time. They have accumulated net longs that are at a 19-week high.
Should $1,820s yield, the next level of resistance is not until $1,880s.
Nasdaq 100 index (mini): Currently net long 1.2k, down 3.3k.
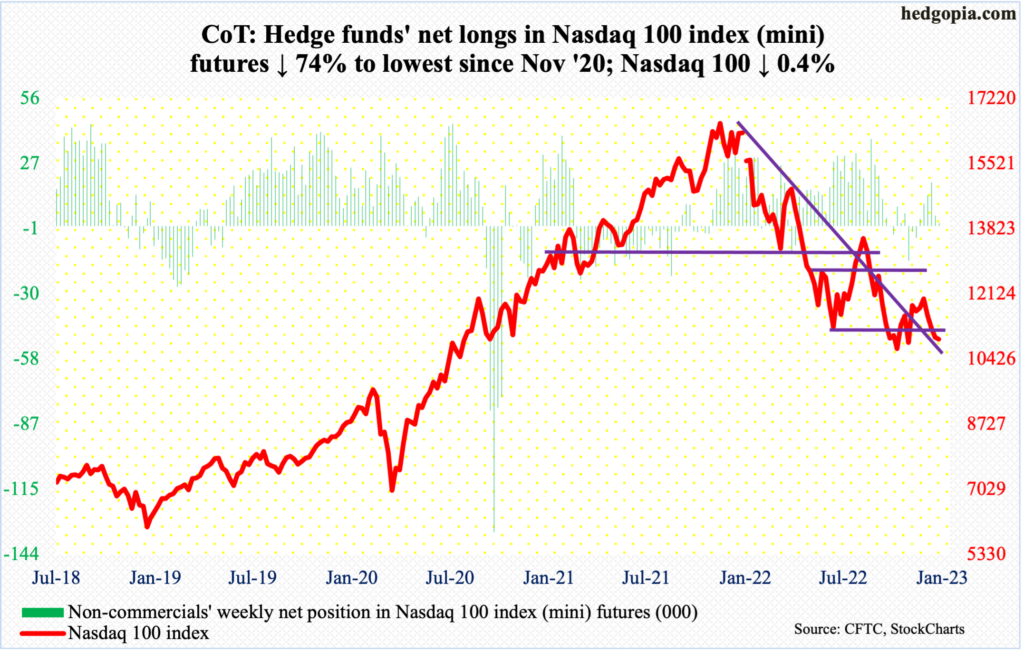
The Nasdaq 100 tested important support at 10600s this week and it held, ending the week at 10940, down 0.4 percent.
Immediately ahead, there is horizontal resistance at 11400, with the 50-day at 11406.
Russell 2000 mini-index: Currently net short 69.9k, up 11k.
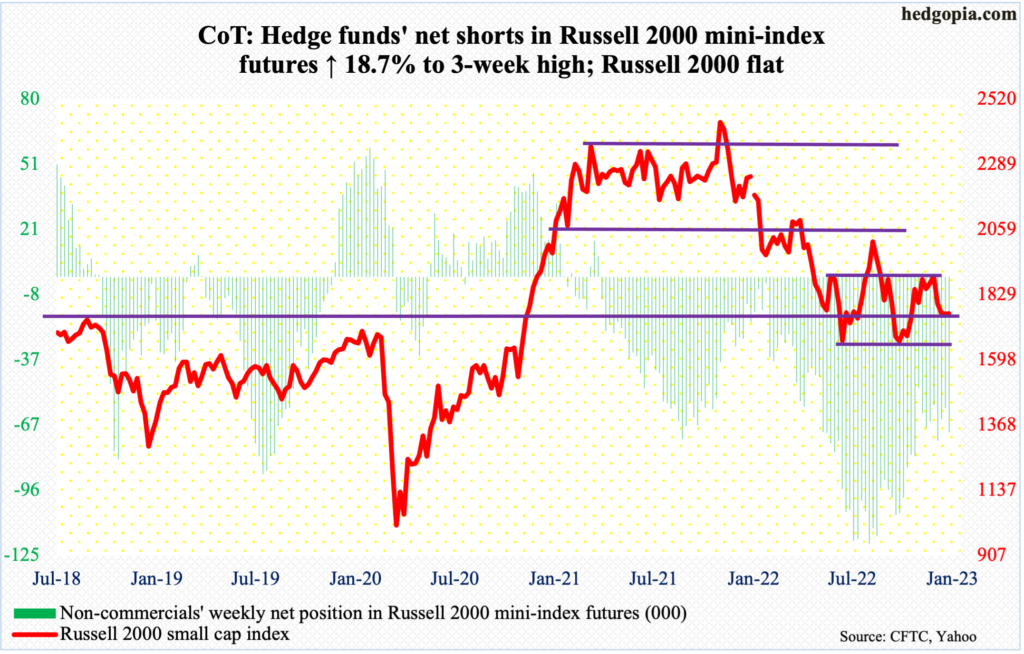
One more week and one more attempt by small-cap bears to break down 1700 but bulls held firm. On Wednesday, the Russell 2000 dropped to 1722 before drawing bids. It closed the week flat at 1761.
The small cap index has gone back and forth between 1700 and 1900 this year since January. In the middle of November and early December, there were several rejections at 1900.
The path of least resistance is toward 1800 first, which is about where the 50-day (1811) lies.
US Dollar Index: Currently net long 16.9k, up 184.
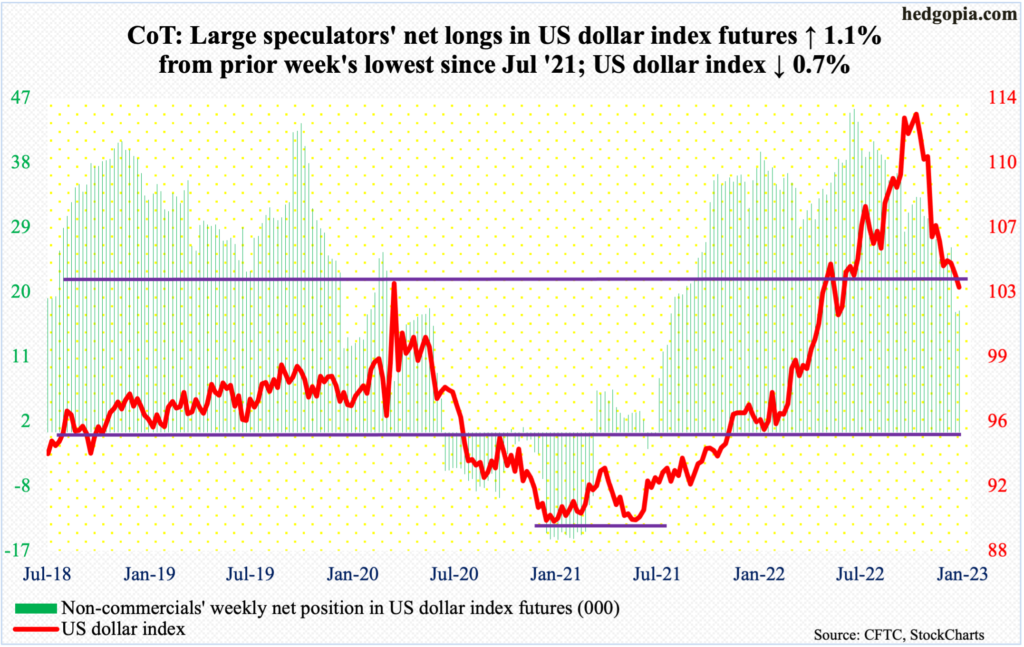
On the US dollar index, 104 goes back to at least 2017. In January that year, it peaked at 103.81 before bottoming at 88.15 in February 2018. Then, in March 2020, the index again reversed lower after ticking 103.96, followed by a trough in January 2021 at 89.17. The rally off of that low peaked at 114.75 this September, busting through 104 in July this year.
Understandably, a bull-bear duel has evolved around 104 the past five weeks. This week, the US dollar index closed at 103.27. It is too soon to say if this qualifies as a failed breakout retest or a breakdown. The daily remains extremely oversold, with the index more or less sideways around its daily lower Bollinger band for nearly three weeks now. A rally is possible near term, although a breach of 104 is just a matter of time.
VIX: Currently net short 68.4k, up 1.2k.
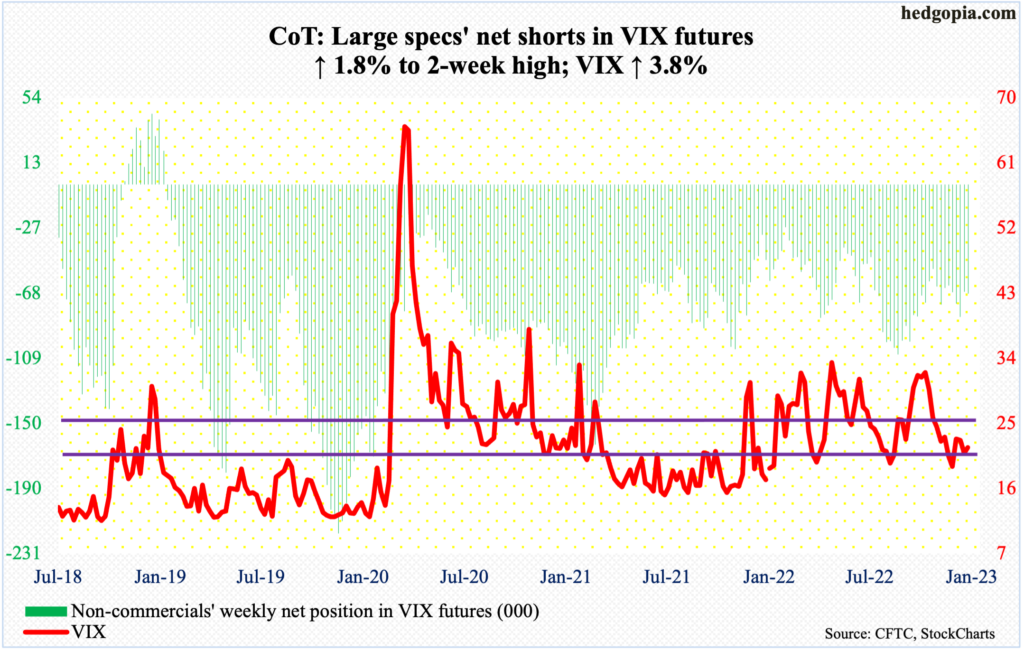
VIX essentially hugged its 10- and 20-day in all four sessions this week and is right in the middle of its daily Bollinger bands. It could go either way.
Moreover, a rising trend line from early this month gets tested at 20.50, while a falling trend line from the middle of the month lies at 23. The latter also approximates the 50-day at 23.48.
Then, there is 19, which has not been sustainably breached since March this year. Volatility bulls defended the level in April, August and again in November. The daily lower Bollinger band lies at 19.50. The daily RSI remains sub-50. As things stand, odds favor VIX (21.67) drifts toward 19.
Thanks for reading!
