
Following futures positions of non-commercials are as of June 27, 2023.
10-year note: Currently net short 801k, up 51k.
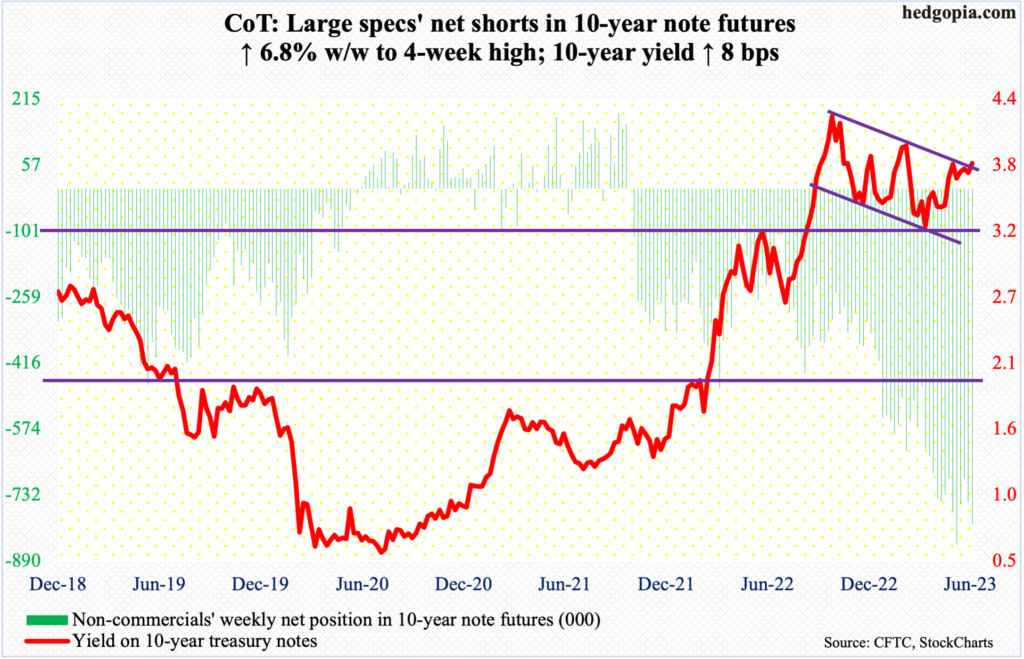
FOMC minutes for the June 13-14 meeting are due out Wednesday. In that meeting, after raising the fed funds rate uninterrupted since March last year, the Federal Reserve left the rates unchanged at a range of 500 basis points to 525 basis points, up from zero to 25 basis points back then.
Since that meeting, most macro data have come in strong. It turns out the economy grew at a two percent annualized rate in 1Q23, stronger than the previously reported 1.3 percent, we found out Thursday. Inflation – measured by both the CPI (consumer price index) and the PCE (personal consumption expenditures) – is lower than last year’s four-decade highs, but at four- to five-percent range is substantially higher than the Fed’s two percent goal.
This gives ammunition to FOMC hawks. The dot plot released at the June FOMC meeting had members overwhelmingly favor two additional 25-basis-point hikes by December. On Thursday, Chair Jerome Powell said a strong majority of policymakers expect two or more rate hikes by year end, adding that consecutive rate hikes are not off the table.
In the futures market, however, traders continue to fight the Fed, betting that the central bank only raises one more time in July, to 525 basis points to 550 basis points, before rates go sideways until next March and then go lower, reaching 400 basis points to 425 basis points by the end of 2024. Until just a week ago, they were expecting the benchmark rates to hit 375 basis points to 400 basis points by end-2024. As a matter of fact, until just a few weeks ago, they were pricing in up to three 25-basis-point cuts by this December. So, they are adjusting to the new reality, but are probably not done doing so. The gap between what the Fed is telling us and what these traders have their money on is just too wide. Thus far, Powell is winning the staring contest with these traders, and the status quo probably continues.
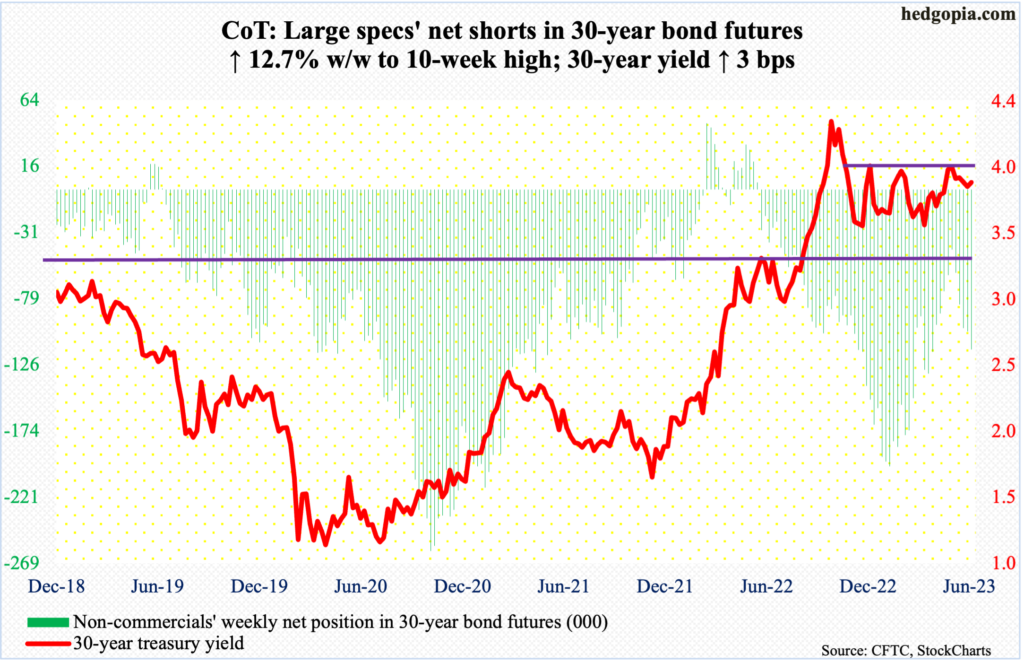
30-year bond: Currently net short 115.2k, up 12.9k.
Major US economic releases for next week are as follows. Markets are closed Tuesday for observance of Independence Day. Happy July 4th!
The ISM manufacturing index (June) is due out on Monday. In May, manufacturing activity edged down two-tenths of a percentage point month-over-month to 46.9 percent, which was the seventh sub-50 reading in a row.
Wednesday brings durable goods orders (May, revised). May’s preliminary numbers showed orders for non-defense capital goods ex-aircraft – proxy for business capex plans – increased 0.7 percent m/m to a seasonally adjusted annual rate of $74 billion. This was a new record.
The ISM non-manufacturing index (June) and the JOLTs report (May) are scheduled for Thursday.
Services activity in May shrank 1.6 percentage points m/m to 50.3 percent. The non-manufacturing index briefly went sub-50 to 49.2 percent last December and has been north of 50 percent since.
Non-farm job openings rose 358,000 m/m in April to 10.1 million. In March last year, openings recorded a new all-time high of 12 million.
Payroll (June) is on tap for Friday. In the first five months this year, the economy produced an average of 314,000 non-farm jobs. In 2022, the monthly average was 399,000, and 606,000 before that in 2021.
WTI crude oil: Currently net long 159.5k, down 33.7k.
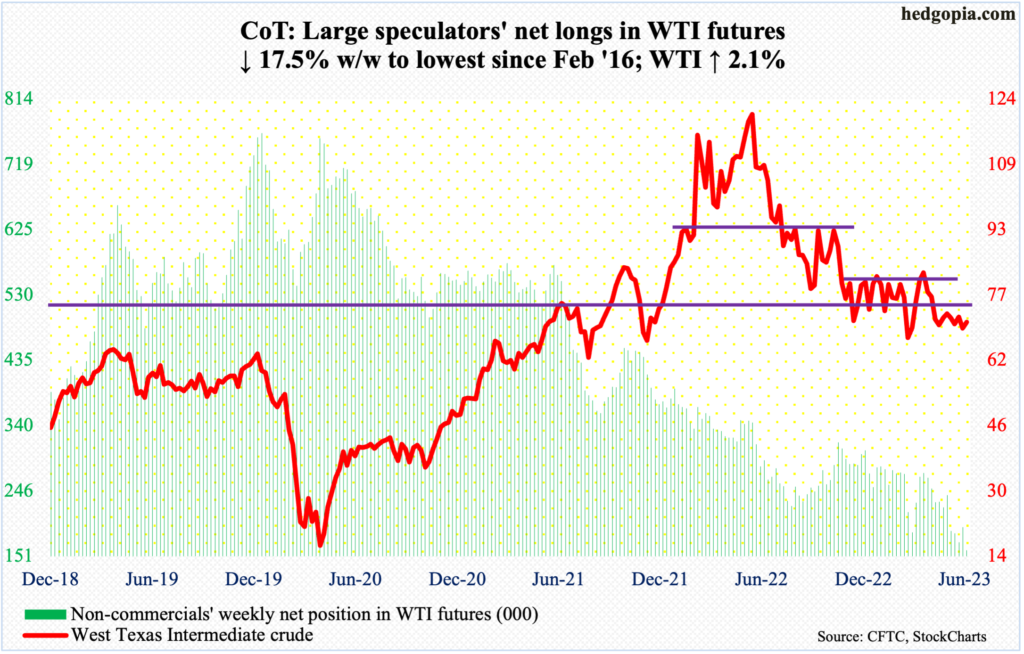
Oil bulls are not in a mood to give up $67 just yet. On Wednesday, West Texas Intermediate crude ticked $67.05, which also touched the daily lower Bollinger band, and rallied, finishing the week at $70.64.
A loss of $67 would have raised the odds of a test of horizontal support at $63-$64. This has been averted. The problem for the bulls is that the crude remains just under a seven-month range between $71-$72 and $81-$82. The upper end has not been tested for a couple of months, even as Friday’s high $71.04 drew offers.
For now, WTI has a shot at $73-$74, which has resisted rally attempts for nearly two months now.
In the meantime, as per the EIA, US crude production in the week to June 23 was unchanged week-over-week at 12.2 million barrels per day. Crude imports increased 419,000 b/d to 6.6 mb/d. Stocks of gasoline and distillates increased as well, up 603,000 barrels and 123,000 barrels respectively to 222 million barrels and 114.4 million barrels. Crude stocks, however, declined 9.6 million barrels to 453.7 million barrels. Refinery utilization declined nine-tenths of a percentage point to 92.2 percent.
E-mini S&P 500: Currently net short 208.3k, down 31.1k.
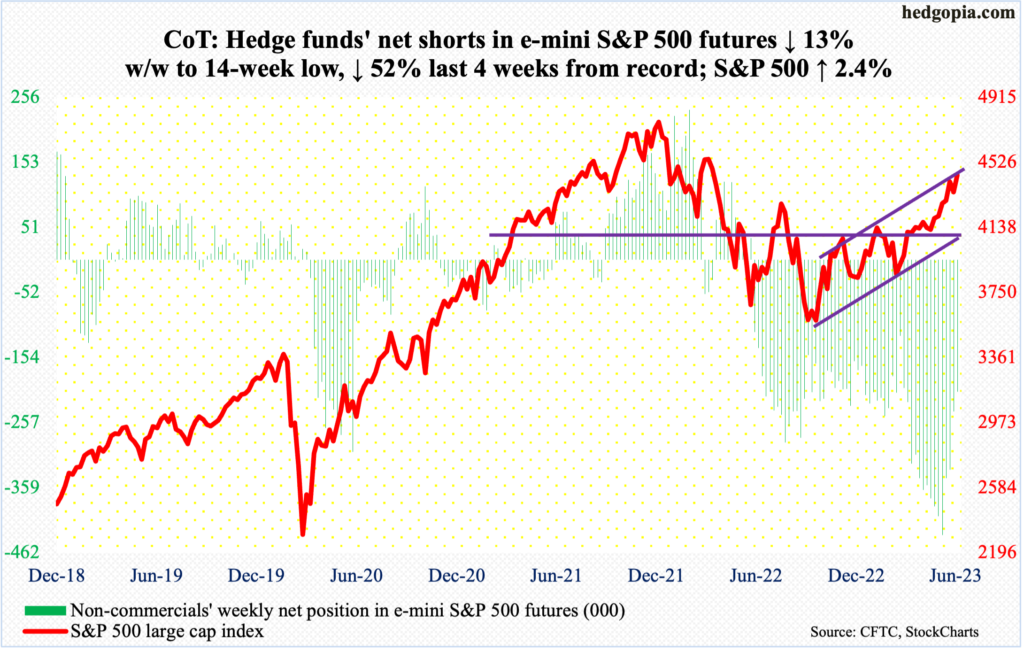
Equity bulls defended breakout retest at 4320s. After dropping 2.7 percent from the June 16th high of 4448 to Monday’s low of 4328, bids began to show up Tuesday, rallying 2.4 percent for the week. Last August, the S&P 500 retreated sharply after tagging 4325. A breakout occurred on June 12, followed by a successful retest this week.
Importantly, the June 16th pullback began as the large cap index tested the upper bound of an ascending channel from last October’s low. Once again, the resistance is being tested. From that low through the June 16th high, the S&P 500 jumped 27.4 percent.
Non-commercials have contributed to this. By the week to May 30, they had accumulated 434,170 net shorts in e-mini S&P 500 futures – a record. By this Tuesday, holdings were down 52 percent to 208,250 contracts, even as the cash rallied 245 points. A channel breakout can lead to more short-covering. At the same time, the potential fuel for squeeze has come down quite a bit.
Euro: Currently net long 145k, up 379.
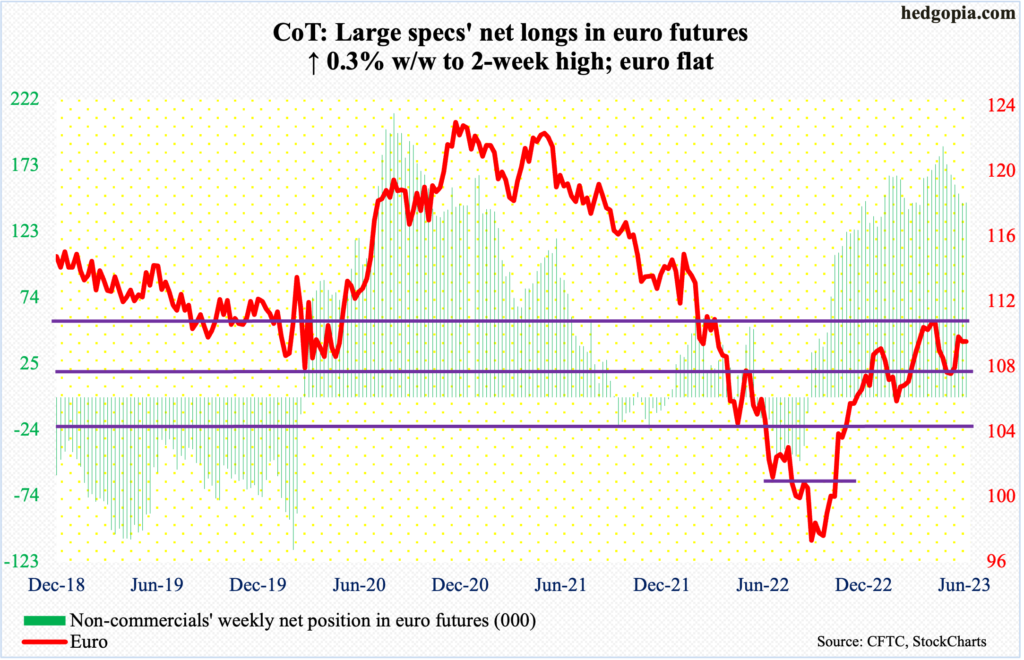
On Wednesday and Thursday last week, the euro rose past $1.10 intraday, but only to close the week out at $1.0914. the currency was unchanged this week, as euro bulls could not quite hang on to Wednesday’s intraday high $1.0978; in the end, a spinning top formed on the weekly.
The euro bottomed last September at $0.9559. For several weeks in April and May this year, rally attempts were rejected at $1.09-$1.10, which is once again drawing offers.
There is horizontal support at $1.07-$1.08.
Gold: Currently net long 151.9k, down 11.1k.
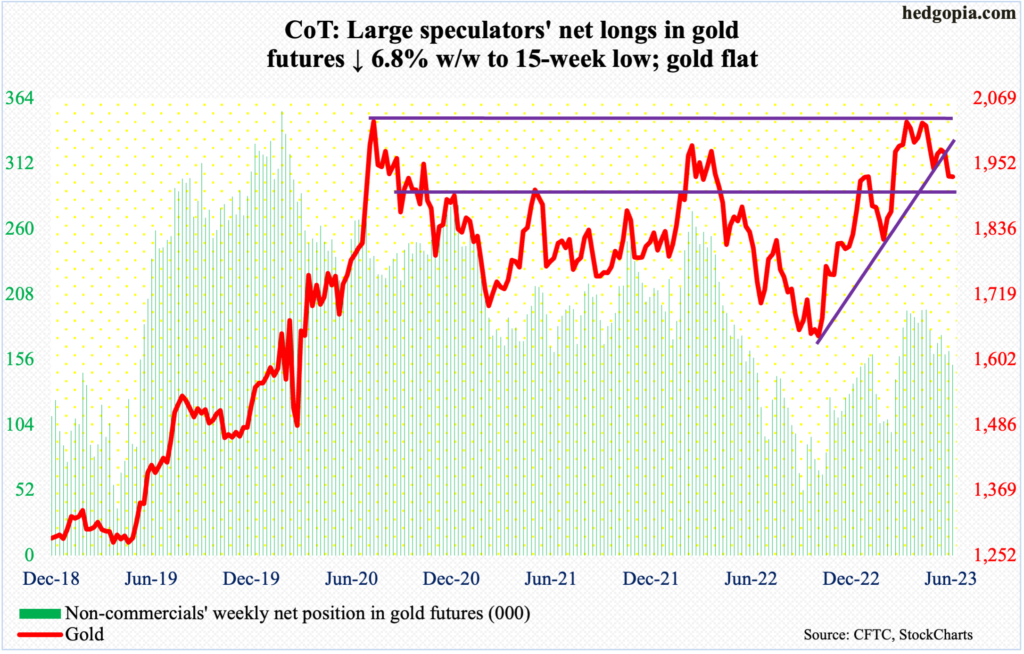
Gold fell 2.7 percent in June – the second consecutive monthly decline. On May 4, in a spinning top session, it ticked $2,085/ounce before retreating. This was an important price point. In the past, $2,089 was tagged in August 2020 – an all-time high – and $2,079 in March 2022.
The drop since the May 4th high has cost gold bugs the 50-day moving average. The 200-day is at $1,860, which should begin to act like a magnet once $1,920s decisively give away. The metal closed out the week at $1,929, which is where it finished last week.
Nasdaq 100 index (mini): Currently net long 17.2k, up 1.2k.
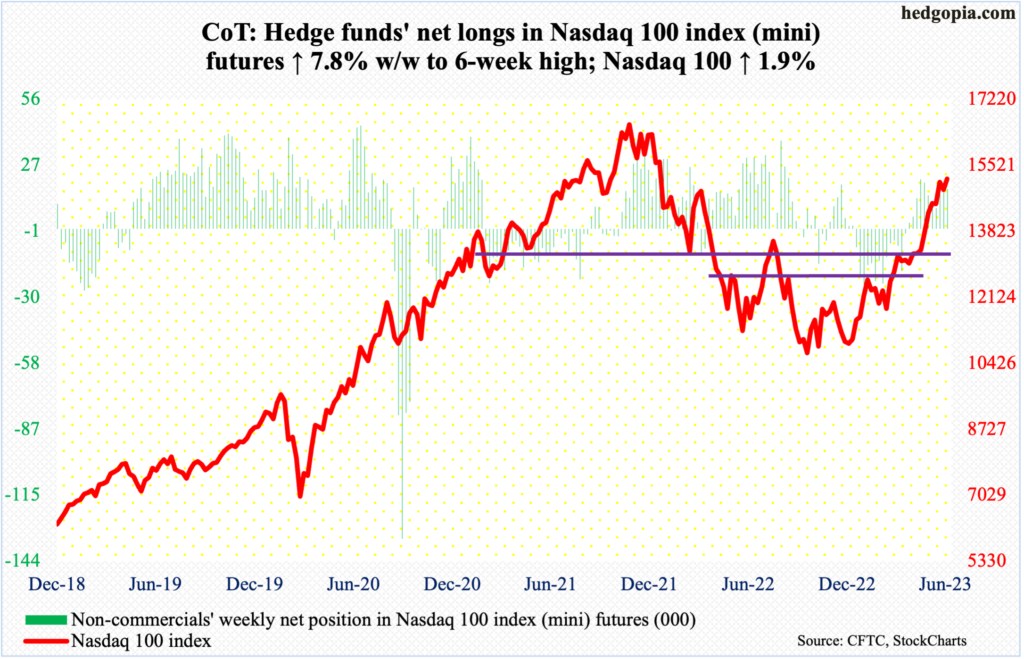
Horizontal support at 14700s was defended early this week, which began with Monday’s close at 14689. Friday’s 1.4-percent gap-up then brought the Nasdaq 100 to 15179, not too far away from the June 16th high of 15285. Through that high, the tech-heavy index rallied 44.5 percent from last October’s low.
The index remains overbought, with the weekly RSI into the 70s for the past six weeks. For now, the positive momentum can feed on itself should the June 16th high of 15285 gets taken out convincingly.
Russell 2000 mini-index: Currently net short 63.7k, down 9k.
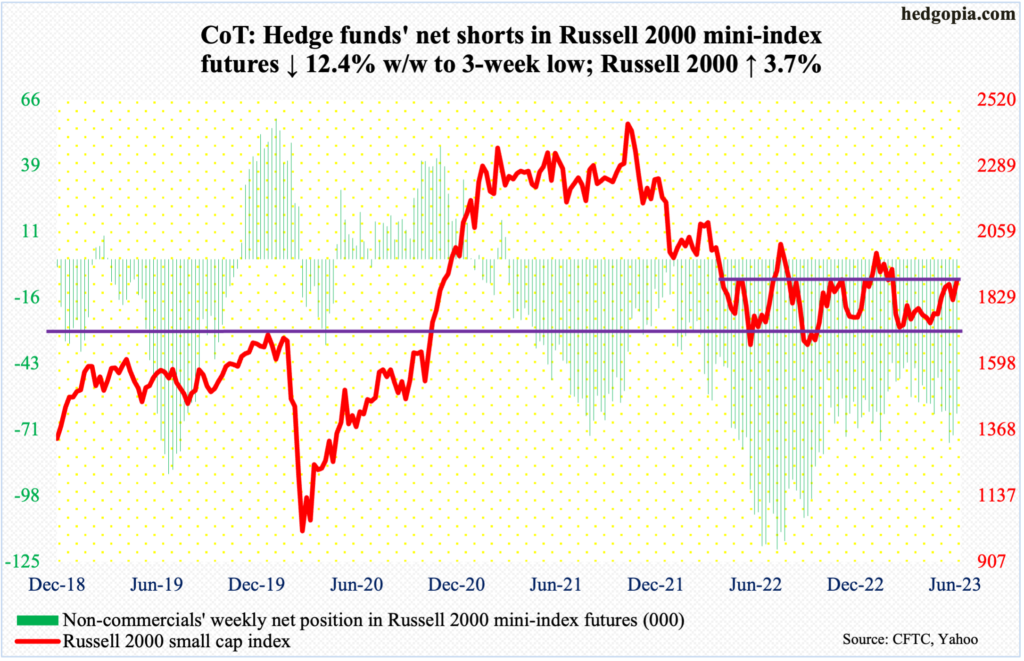
One more week, and one more failed attempt on the part of small-cap bulls to recapture 1900, which represents the top of a range intact since January last year. The bottom of the range lies at 1700, which, in fact, goes all the way back to August 2018.
On Friday, the Russell 2000 ticked 1898, with a closing print of 1889. This was preceded by three sessions last week in which the small cap index rallied north of 1900 intraday but only to close under by close.
From bulls’ perspective, the good thing is that support at 1800 was just about tested on Monday as the index touched 1820; a session before that, 1819 was hit. The problem remains with their inability to soak up all the offers at 1900.
US Dollar Index: Currently net long 15k, up 107.
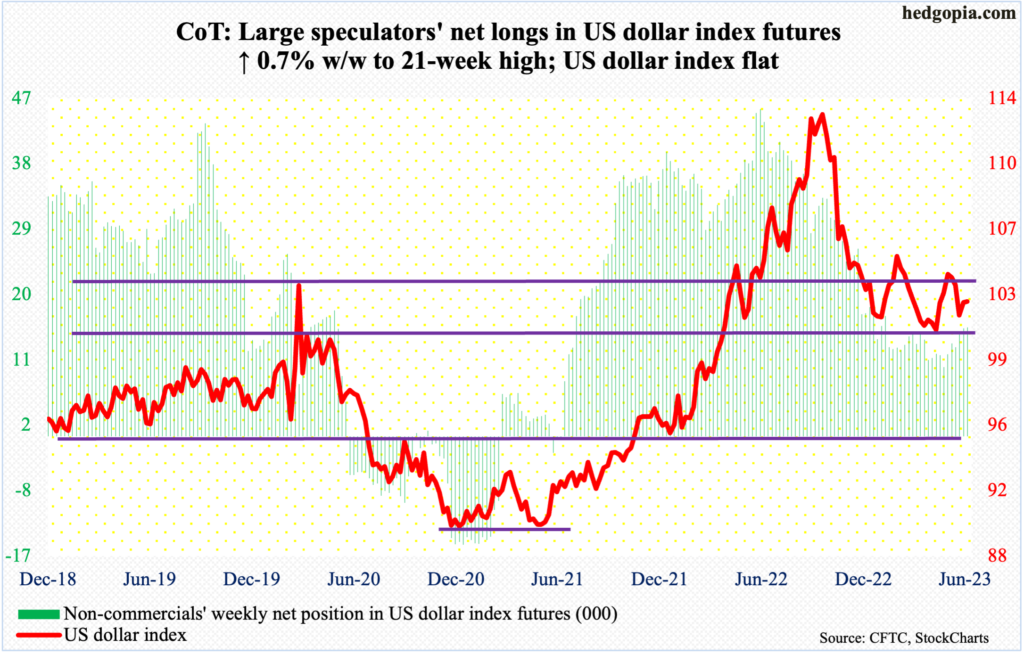
Horizontal support at 100-101 goes back eight years. In the week before, selling stopped at 101.58; last week’s low was 101.48. This week, the US dollar index ticked 101.96 on Tuesday, before bids showed up.
Dollar bulls’ challenge remains 103-104, which resisted breakout attempts several times in May and June. This again occurred on Friday, as the session high 103.23 was sold to close the week out at 102.59. More attempts at this resistance are likely in the sessions ahead.
VIX: Currently net short 64.7k, down up 3.7k.
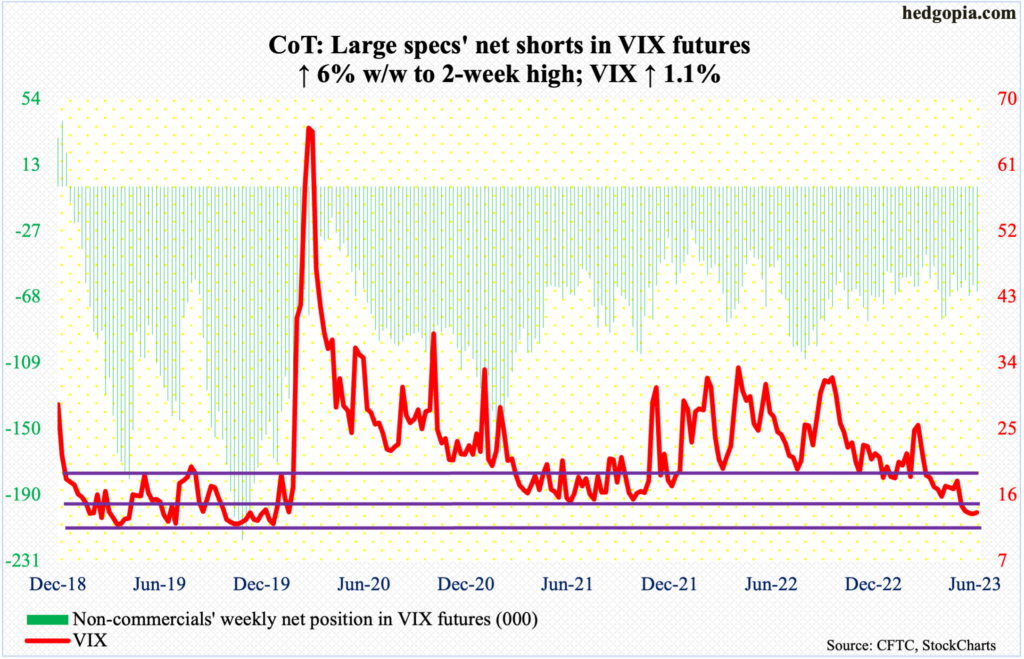
VIX inched up 0.15 points to 13.59 this week, moving in unison with the S&P 500 which had a strong week. This does not happen very often. Directionally, the two tend to move in opposite directions.
This took place even as this week’s low 12.96 was a tad higher than last week’s 12.73. Friday, in fact, produced a potentially bullish hammer, just above the daily lower Bollinger band. Importantly, the bands have narrowed quite a bit; this in general precedes a sharp move – either way. Given how suppressed volatility is, should there be a sharp move in VIX, it is likely to be on the upside.
Thanks for reading!
