
Following futures positions of non-commercials are as of August 15, 2023.
10-year note: Currently net short 746.9k, up 55.2k.
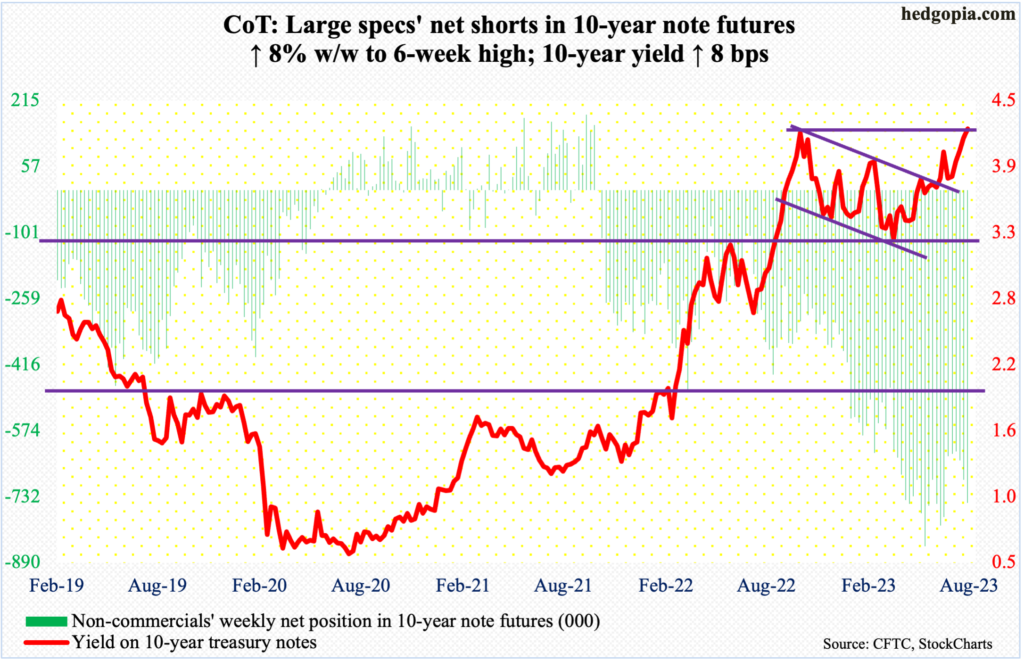
The Jackson Hole Symposium takes place next week. Several times in the past, the annual gathering has been used as a venue to announce – signal – upcoming policy matters. If investors are hoping Federal Reserve Chair Jerome Powell will give a wink and a nod about the September meeting, they will be disappointed. He is set to speak on Friday about the US economic outlook. Odds favor his speech will not contain anything market moving.
The minutes for the July meeting showed Fed officials see upside risks to inflation, possibly leading to more rate hikes. That meeting convened on 25-26. After that meeting, several important data points have been reported – including the consumer price index and the producer price index for July as well as the employment cost index for the June quarter. They either met expectations or came in better.
The FOMC meets next on September 19-20. By then, August’s payroll (September 1) and CPI (September 13) as well as July’s PCE index (August 31) will be out. So, for a data-dependent Fed, there is plenty more to chew on. Even if he knew which way he was leaning, Powell would be holding his cards to the vest.
As for fed funds futures traders, they are betting on no hike next month, although the probabilities for a 25-basis-point increase in November has gone up to 33 percent. That is about it. Other than that, they continue to expect the first easing to take place next May, ending 2024 between 425 basis points and 450 basis points, which is slightly less dovish than last week when they expected the benchmark rates to end 2024 between 400 basis points and 425 basis points. Rates were raised in July to a range of 525 basis points to 550 basis points.
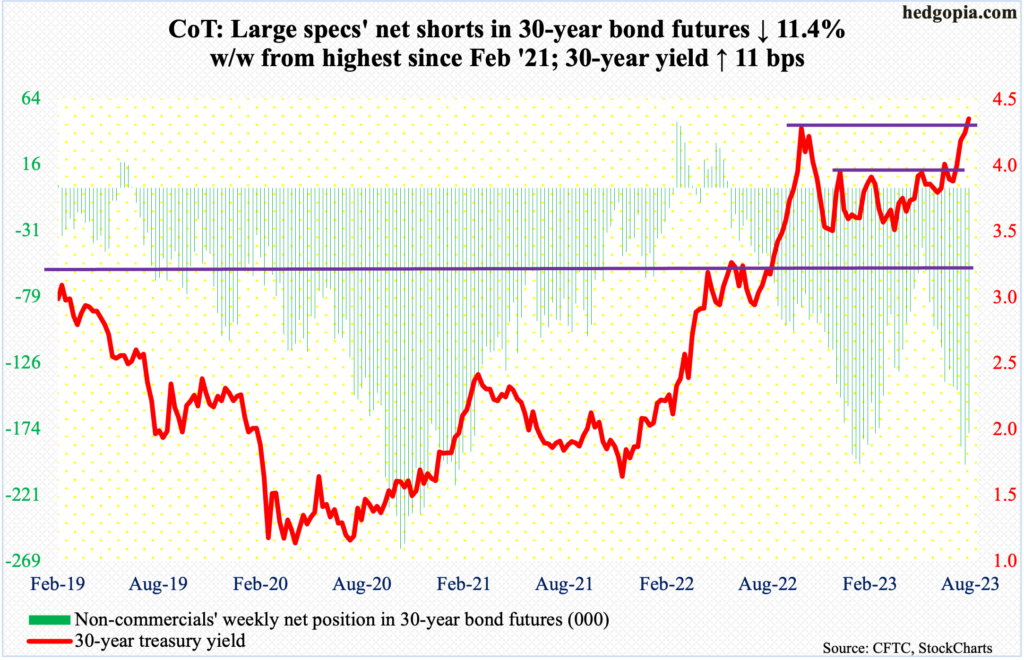
30-year bond: Currently net short 176.7k, down 22.8k.
Major US economic releases for next week are as follows.
Existing home sales (July) are due out on Tuesday. June sales declined 3.3 percent month-over-month to a seasonally adjusted annual rate of 4.16 million units – a five-month low.
New home sales (July) are scheduled for Wednesday. Sales slid 2.5 percent m/m in June to 697,000 (SAAR). May’s 715,000 was a 15-month high.
Thursday brings durable goods orders (July). Orders for non-defense capital goods ex-aircraft – proxy for business capex plans – edged up 0.1 percent m/m to $74 billion (SAAR), which set a fresh record.
The University of Michigan’s consumer sentiment index (August, final) is on tap for Friday. August’s preliminary reading showed consumer sentiment came in at 71.2. July’s 71.6 was a 21-month high. Sentiment hit a record low 50 in June last year.
WTI crude oil: Currently net long 266.4k, down 16.9k.
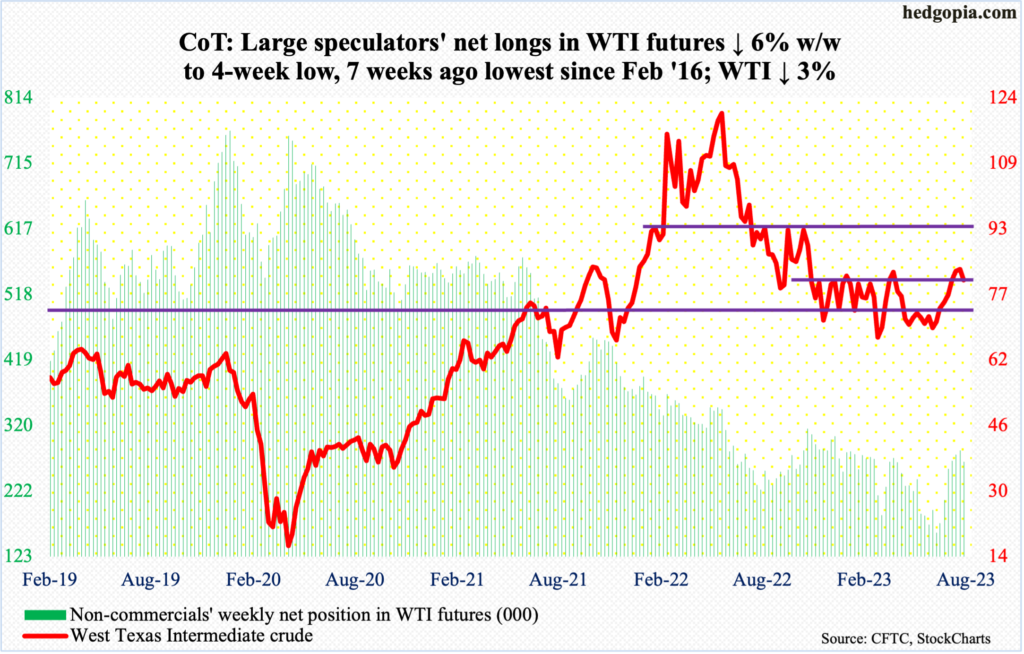
Last week, after six consecutive up weeks – rallying from $67.05 on June 28 to $84.89 on August 10 – West Texas Intermediate crude ($80.66/barrel) experienced one more positive week but with a weekly spinning top. This week, it shed three percent; in fact, through Thursday’s intraday low of $78.60, it was down 5.5 percent for the week, but oil bulls stepped up to push the crude higher in that session as well as on Friday.
With this, WTI has slid back into an eight-month range between $71-$72 and $81-$82. It closed the week right at rising trendline from the June low. A breach makes the crude susceptible to go test important moving-average support, with the 200- and 50-day at $76.60 and $75.66 respectively. For whatever it is worth, if the crude holds its ground, a golden cross is in the making in a week or two.
In the meantime, as per the EIA, US crude production in the week to August 11 increased 100,000 barrels per day week-over-week to 12.7 million b/d, which is the highest since March 27, 2020. Crude imports increased as well, up 476,000 b/d to 7.2 mb/d. As did distillate stocks, which increased 296,000 barrels to 115.7 million barrels. Stocks of crude and gasoline, however, dropped – respectively down 6 million barrels and 262,000 barrels to 439.7 million barrels and 216.2 million barrels. Refinery utilization firmed up nine-tenths of a percentage point to 94.7 percent.
E-mini S&P 500: Currently net short 118.4k, down 41.2k.
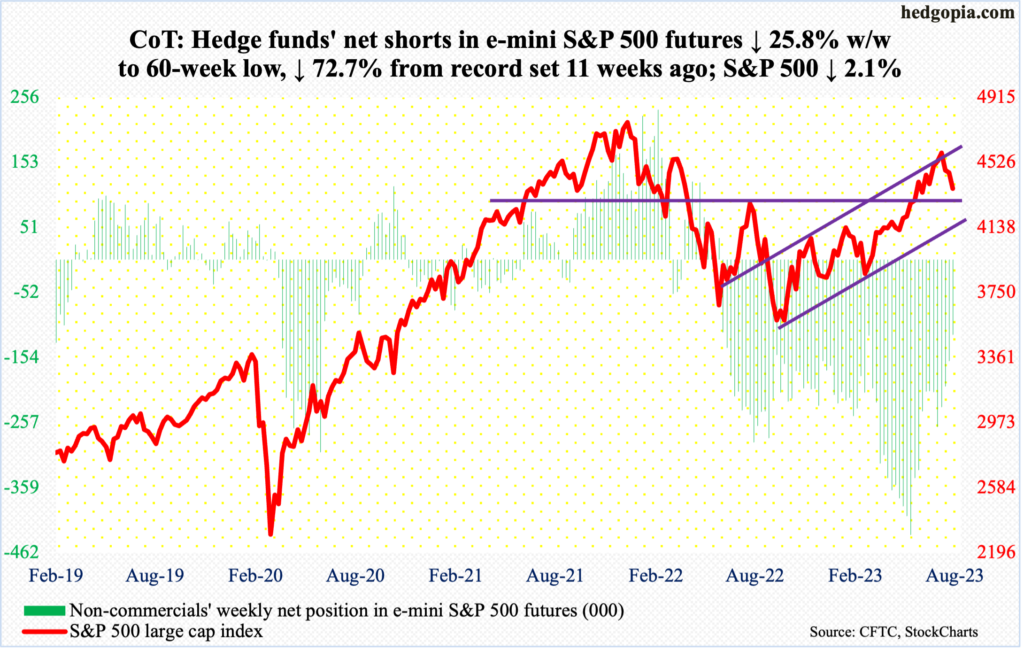
After the week in which the S&P 500 tagged 4607 on July 27, it has now dropped three weeks in a row. From that high through Friday’s intraday low of 4335, the large cap index shed 5.9 percent before attracting decent bids, and it came at a potentially crucial juncture.
Between last year’s low (3492) and the July 27 high, the S&P 500 shot up 31.9 percent. Along the way, several important roadblocks gave way, including last August’s high of 4325. Friday’s action should pass for a successful retest of the June 12 breakout.
Ultimately, at least a test of the 200-day at 4130 is in order, but for now there is room for a relief rally. There is horizontal resistance at 4450s, which coincide with the 50-day.
Euro: Currently net long 159.9k, up 10.1k.
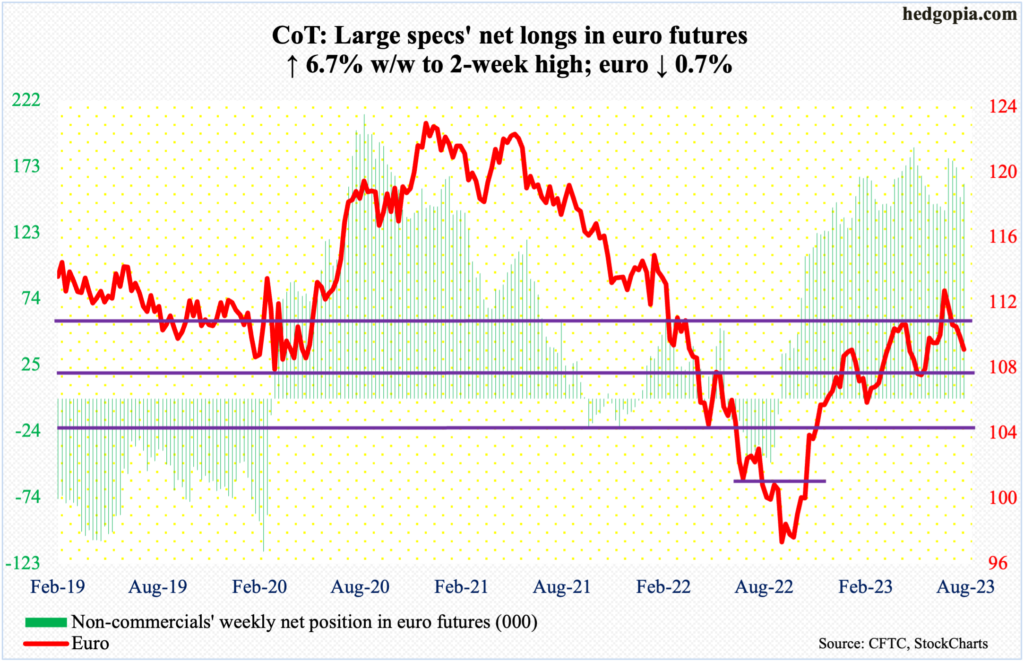
It increasingly feels like the monthly RSI wants to turn down from the median; last year, the metric languished sub-30 for a few months before the euro bottomed at $0.9559. On July 18, the currency tagged $1.1270 intraday. This week, it shed 0.7 percent to $1.0872 – its fifth down week in succession.
Five weeks ago, the currency broke out of $1.09-$1.10. Euro bulls were unable to decisively defend the level this week.
The daily is beginning to get oversold. Worse, the euro can drop toward the 200-day at $1.0760 and then rally back toward $1.09-$1.10.
Gold: Currently net long 121.1k, down 21.8k.
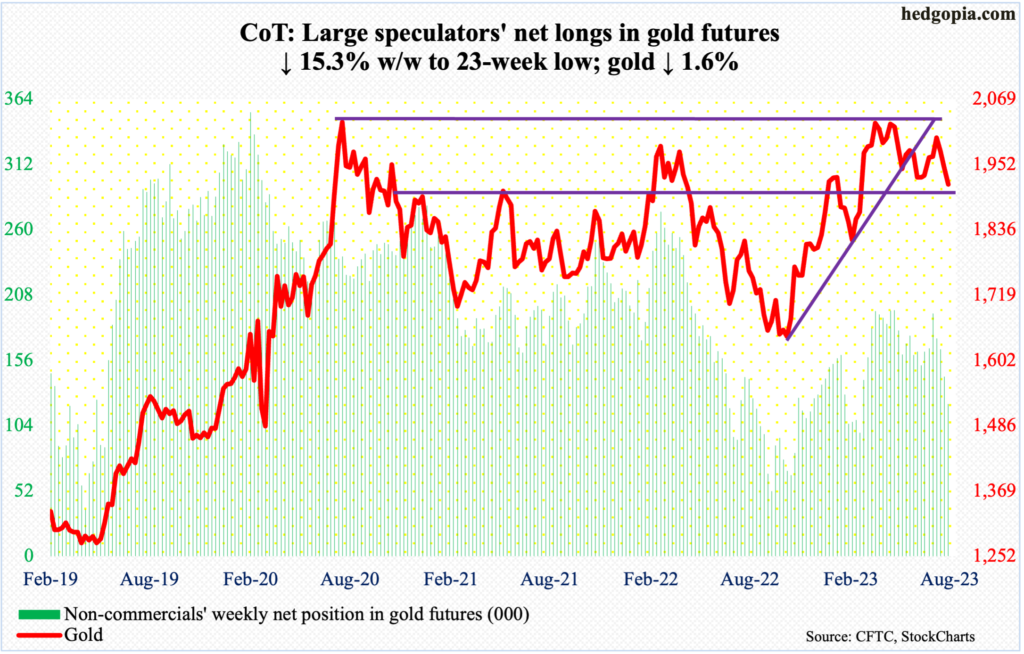
Gold ($1,917) is clinging on to make-or-break $1,920s. Gold bugs are losing momentum as the weekly RSI at 46.05 is now pushed back below the median.
The metal bottomed at $1,620s last October-November. Soon thereafter, the weekly RSI rallied past the median, eventually peaking just north of 70 early April. The metric then went on to make a lower high when gold ticked $2,085 on May 4 (this year) before pulling back. In the past, $2,089 was tagged in August 2020 – an all-time high – and $2,079 in March 2022. Failure to take out $2,080s has proven expensive, even as non-commercials’ net longs in gold futures are now at a 23-week low.
Nasdaq 100 index (mini): Currently net long 5.2k, up 16k.
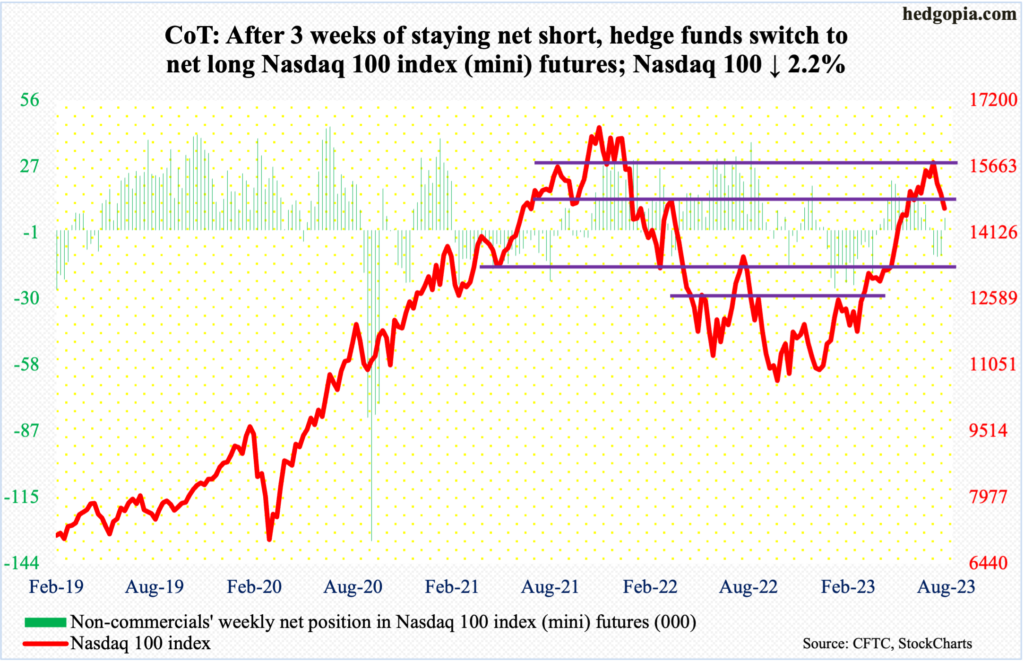
The Nasdaq 100 has come under pressure since July 19 when it ticked 15932. From last October’s low through that high, the tech-heavy index shot up 52.6 percent.
Until the week to July 18, non-commercials were net long. Then they switched to net short and remained that way for the next couple of weeks. The Nasdaq 100 gave back 2.22 percent this week – its third down week in a row. In the meantime, these traders switched to net long this week.
Through Friday’s intraday low of 14556, the Nasdaq 100 declined 8.6 percent from the July 19 high. tech bulls have an opportunity to put their foot down here – at least for a relief rally.
Horizontal resistance lies at 15200s, with the 50-day at 15193.
Russell 2000 mini-index: Currently net short 71.3k, up 6.8k.
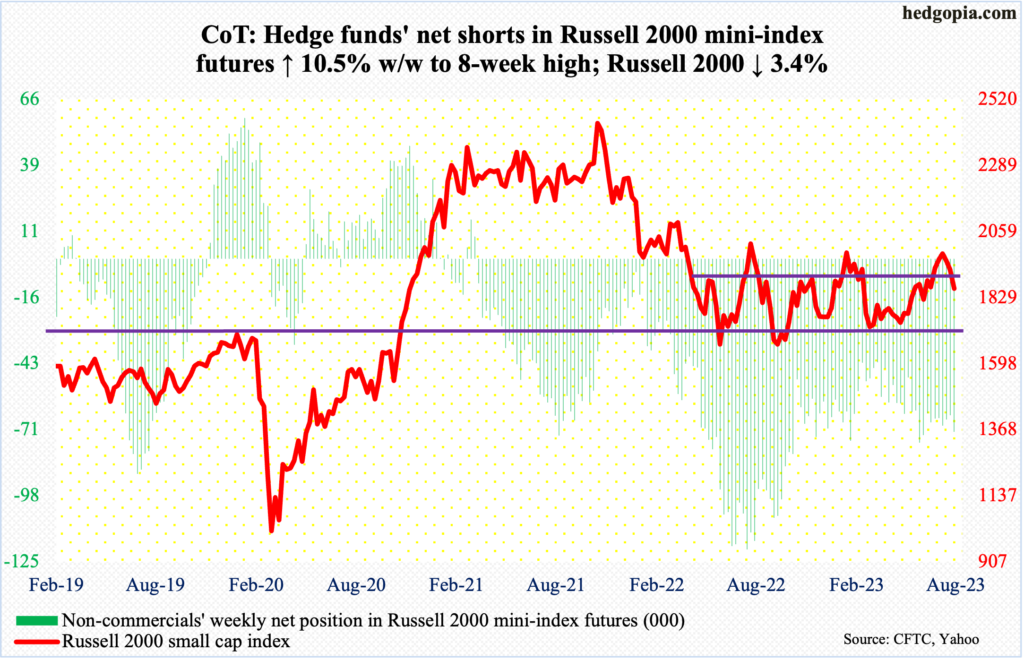
Small-cap bulls were unable to defend breakout retest at 1900. The Russell 2000 had been rangebound between 1700 and 1900 since January last year, and the breakout occurred on July 11 (this year). Post-breakout, the small cap index went on to rally to 2004, which was hit on July 31, but came up short of eclipsing the February (2023) high of 2007 – meaning no higher high.
The index then quickly unraveled, touching 1831 intraday Friday, but closing the session at 1859. For a year now, the midpoint of the range has proven to be important. It was retaken in early June. It is unlikely this gives way right away.
US Dollar Index: Currently net long 5k, up 2.4k.
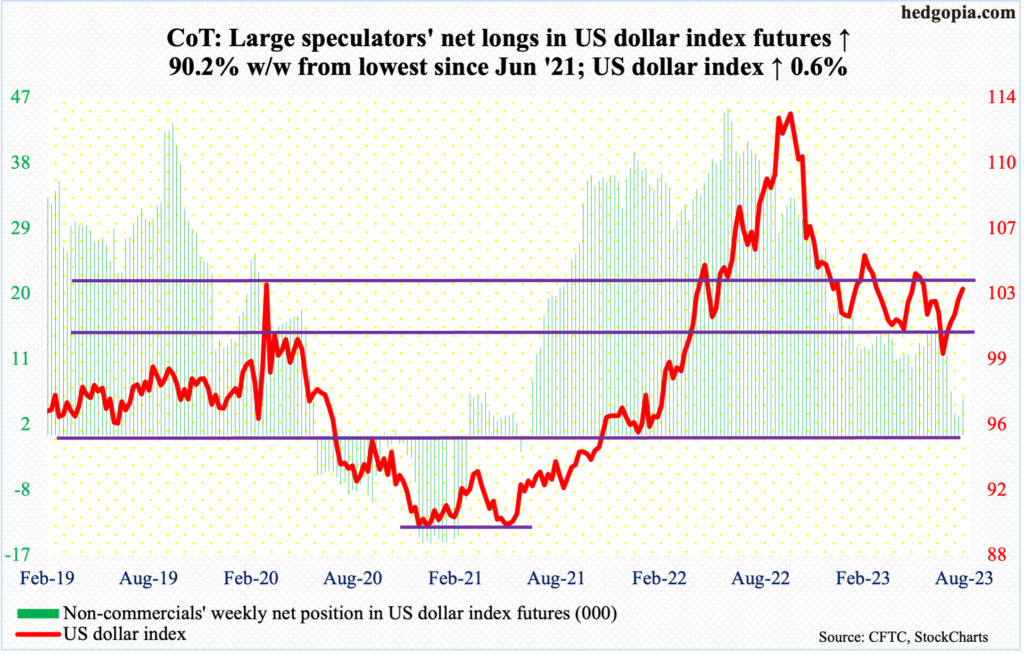
The US dollar index has now rallied for five weeks in a row. It is probable it is ready to take a breather. This week, it rallied as high as 103.57 on Friday, closing at 103.28. Resistance at 103-104 goes back to at least December 2016. A test of that level was rejected in May-June, subsequently bottoming at 99.20s in July.
Friday’s spinning-top-session high would have recaptured the 200-day but ended up closing right at the average (103.30). The daily is itching to head back down.
VIX: Currently net short 26k, down 18.4k.
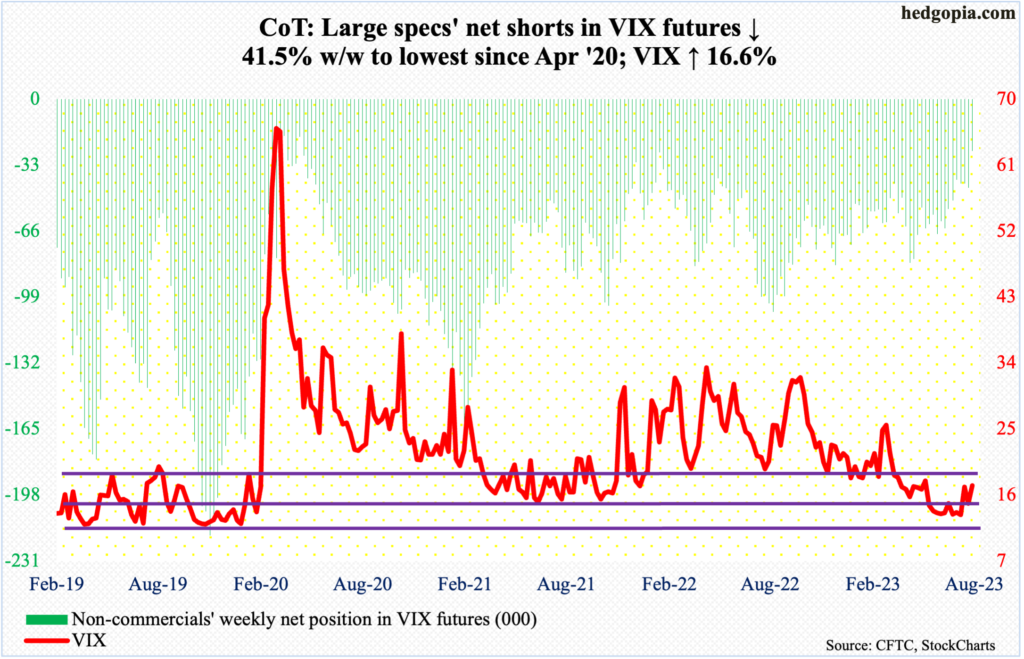
The monthly is just beginning to move up. Viewed this way, volatility has a long way to go on the upside mid- to long-term. But this may not necessarily hold true near term.
VIX tagged 18.88 intraday Friday but only to reverse and close at 17.30. The volatility index turned back down as soon as it kissed the 200-day (18.78). It is likely headed lower in the sessions ahead.
Of note, non-commercials reduced net shorts in VIX futures to the lowest since April 2020. Several times in the past, VIX has tended to peak once these traders either go net long or get close to doing that.
Thanks for reading!
